Project 1 - Parsing NASA thermodynamic data
The code for parsing NASA Thermodynamic data is given below:
%MATLAB programme to parse the NASA Thermodynamic data

clear all   %clear the workspace
close all   %clear all the figure window
clc         %clear the command window
%opening and reading the data file
nasa_data = fopen('THERMO.dat','r');     %opening the given file to read
heading = fgetl(nasa_data);              %defining the heading file
%assigning the global temperature ranges
global_temp_values = fgetl(nasa_data);   %defining the global temperature values
A = strsplit(global_temp_values,' ');    %splitting the global temp using space character
global_low_temp = str2num(A{2});         %defining the global low temp from array A as a number
global_mid_temp = str2num(A{3});         %defining the global mid temp from array A as a number
global_high_temp = str2num(A{4});        %defining the global high temp from array A as a number
%Next three lines are comments
for j = (1:3)
    comments = fgetl(nasa_data);
end
% Getting Elements Information
for i = 1:53                             %Running a for loop for every molecule
    elements = fgetl(nasa_data);         %Assigning the molecule data from 1st line
    elements_name = elements(1:14);      %defining the elements name
    %local temp values for each elements
    B = strsplit(elements,' ');          %splitting the line using space character
    local_low_temp = str2num(B{end-3});  %defining the local low temp from array B as a number
    local_high_temp = str2num(B{end-2}); %defining the local high temp from array B as a number
    local_mid_temp = str2num(B{end-1});  %defining the local mid temp from array B as a number
    line_1 = fgetl(nasa_data);           %assigning the molecule coefficient data from 2nd line
    L1 = strfind(line_1,'E');            %finding the 'E' letter from line to differentiate the data
    line_2 = fgetl(nasa_data);           %assigning the molecule coefficient data from 3rd line
    L2 = strfind(line_2,'E');            %finding the 'E' letter from line to differentiate the data
    line_3 = fgetl(nasa_data);           %assigning the molecule coefficient data from 4th line
    L3 = strfind(line_3,'E');            %finding the 'E' letter from line to differentiate the data
    %Defining the High Temp Coefficients
    a1 = str2num(line_1(1:(L1(1)+3)));
    a2 = str2num(line_1((L1(1)+4):(L1(2)+3)));
    a3 = str2num(line_1((L1(2)+4):(L1(3)+3)));
    a4 = str2num(line_1((L1(3)+4):(L1(4)+3)));
    a5 = str2num(line_1((L1(4)+4):(L1(5)+3)));
    a6 = str2num(line_2(1:(L2(1)+3)));
    a7 = str2num(line_2((L2(1)+4):(L2(2)+3)));
    %Defining the Low Temp Coefficients
    a8 = str2num(line_2((L2(2)+4):(L2(3)+3)));
    a9 = str2num(line_2((L2(3)+4):(L2(4)+3)));
    a10 = str2num(line_2((L2(4)+4):(L2(5)+3)));
    a11 = str2num(line_3(1:(L3(1)+3)));
    a12 = str2num(line_3((L3(1)+4):(L3(2)+3)));
    a13 = str2num(line_3((L3(2)+4):(L3(3)+3)));
    a14 = str2num(line_3((L3(3)+4):(L3(4)+3)));
    %Universal gas constant value
    R = 8.314;
    %assuming temperature range using linspace command
    T = linspace(local_low_temp,local_high_temp,600);
    %calculation of cp,h,s based on lower and upper temp
    for k = 1:length(T)                     %running a for loop for different temp values
        if T(k)>=local_mid_temp             %comparing with local temp
            %calculation for specific heat(cp) for high tempe coefficients
            cp = (a1+a2.*T+a3.*(T.^2)+a4.*(T.^3)+a5.*(T.^4)).*R;
            %calculation for enthalpy(h) for high temp coefficients
            h = (a1+a2.*(T./2)+a3.*((T.^2)./3)+a4.*((T.^3)./4)+a5.*((T.^4)./5)+a6./T).*R.*T;
            %calculation for entropy(s) for high temp coefficients
            s = (a1.*log(T)+a2.*T+a3.*((T.^2)./2)+a4.*((T.^3)./3)+a5.*((T.^4)./4)+a7).*R;
        else
            %calculation for specific heat(cp) for low tempe coefficients
            cp = (a8+a9.*T+a10.*(T.^2)+a11.*(T.^3)+a12.*(T.^4)).*R;
            %calculation for enthalpy(h) for low temp coefficients
            h = (a8+a9.*(T./2)+a10.*((T.^2)./3)+a11.*((T.^3)./4)+a12.*((T.^4)./5)+a13./T).*R.*T;
            %calculation for entropy(s) for low temp coefficients
            s = (a8.*log(T)+a9.*T+a10.*((T.^2)./2)+a11.*((T.^3)./3)+a12.*((T.^4)./4)+a14).*R;
        end
    end
    atoms = ['H','c','N','O','Ar'];                                      %creating a character array
    atomic_mass = [1.008 12.011 14.007 15.999 39.948];                   %storing atomic values of all character sequentially
    molecular_weight = 0;                                                %initializing the molecular weight varible
    for x = 1:length(elements_name)                                      %running a for loop for each character of elements
        for y = 1:length(atoms)                                          %running for loop for each character of array
            if strcmp(elements_name(x),atoms(y))                         %comparing the xth elements with yth character array
                molecular_weight = molecular_weight + atomic_mass(y);    %calculating molecular weight by sum
                z = y;                                                   %defining the y value in z variable
            end
        end
        %calculating molecular weight when more than one atoms is present
        n = str2num(elements_name(x));                                   %converting the xth character of elements to number
        if n>1
            molecular_weight = molecular_weight + atomic_mass(z)*(n-1);  %calculating molecular weight by sum
        end
    end
    %printing and disply the molecular weight for each elements
    fprintf('Molecular weight of %s:- ',elements_name)
    fprintf('%d',molecular_weight);
    disp(' ');
    %Read and write molecular list
    molecular_list = fopen('Molecular weight.txt','a+');
    fprintf(molecular_list,'Molecular weight of %s is %f \n',elements_name,molecular_weight);
    fclose(molecular_list);
    %Saving data in folder
    cur_dir=pwd;
    mkdir(elements_name);
    cd(elements_name);
    %Plotting of cp,h,s vs temperature for all elements
    figure(1)
    %plot temp vs specific heat
    plot(T,cp,'color','r','linewidth',3);
    title(sprintf('Specific Heat(cp) Vs Temperature for %s',elements_name))
    xlabel('Temperature(K)')
    ylabel('Specific Heat(J/Kg K)')
    saveas(1,'Specific Heat.png');      %saving figure of plot of specific heat
    figure(2)
    %plot temp vs enthalpy
    plot(T,h,'color','g','linewidth',3);
    title(sprintf('Enthalpy(h) Vs Temperature for %s',elements_name))
    xlabel('Temperature(K)')
    ylabel('Enthalpy(J/K)')
    saveas(2,'Enthalpy.png');           %saving figure of plot of enthalpy
    figure(3)
    %plot temp vs entropy
    plot(T,s,'color','b','linewidth',3);
    title(sprintf('Entropy(s) Vs Temperature for %s',elements_name))
    xlabel('Temperature(K)')
    ylabel('Entropy(J/K)')
    saveas(3,'Entropy.png');            %saving figure of plot of entropy
    cd(cur_dir);

end
fclose(nasa_data)
In the command window output shows for molecular weight is as per the below figure:
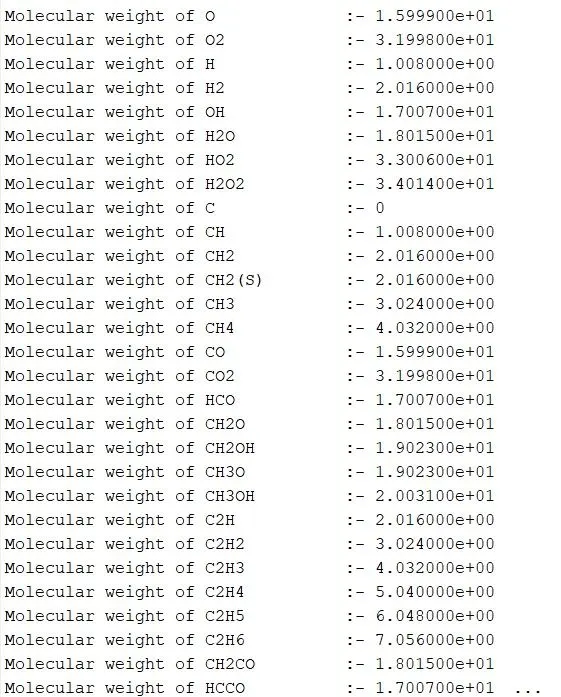
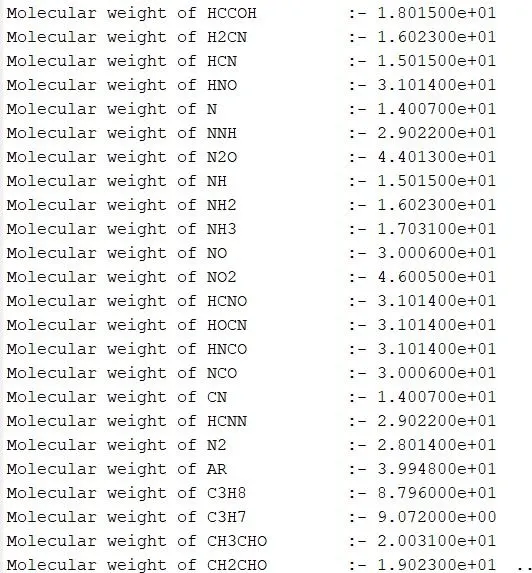
The screenshot of the windows where the all folders data is saved as given below:

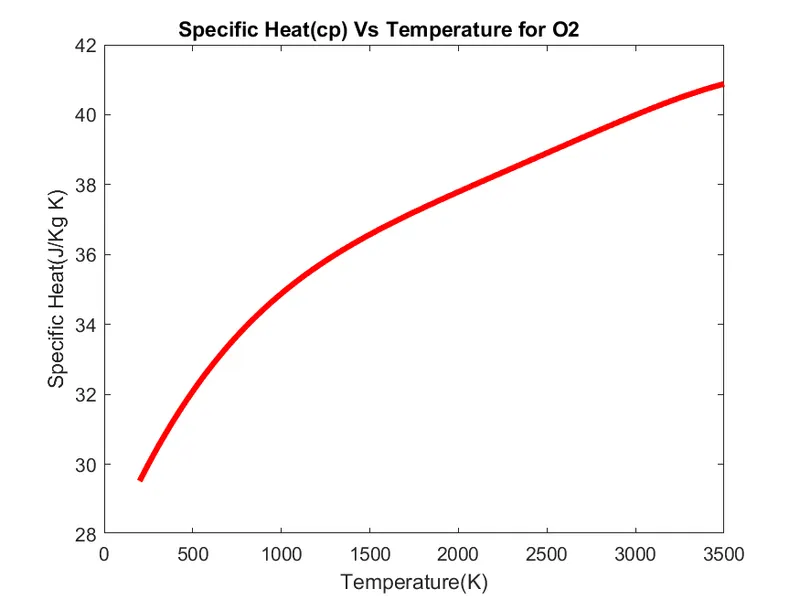
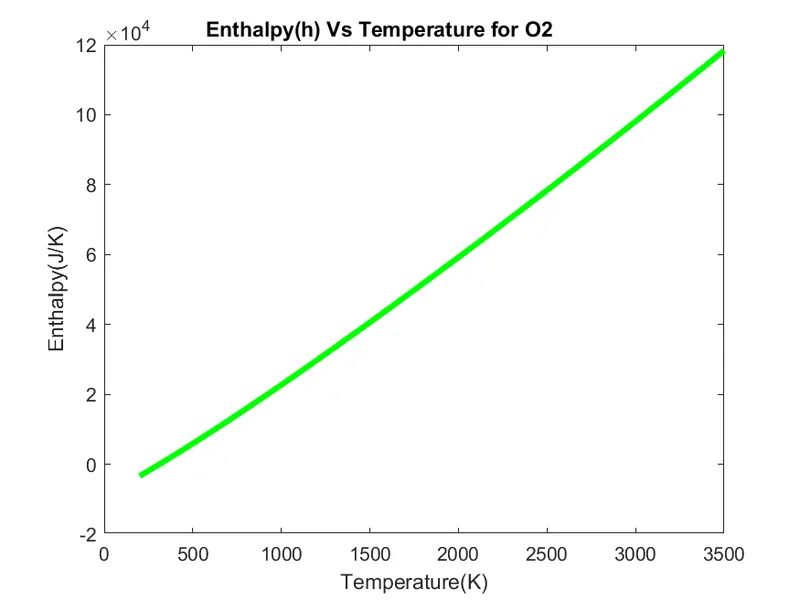
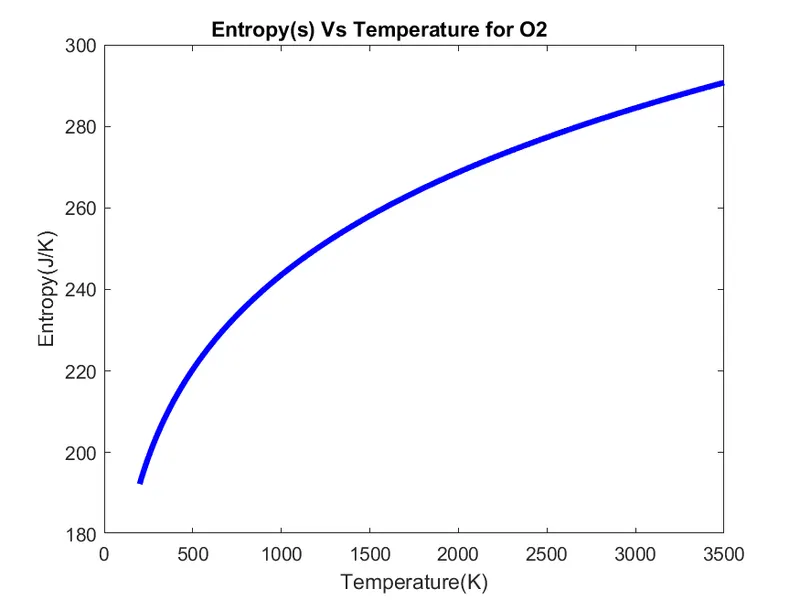
The plot for O2 is given in below figures:
1)Specific Heat(cp) vs Temp
2)Enthalpy Vs Temp
3)Entropy Vs Temp
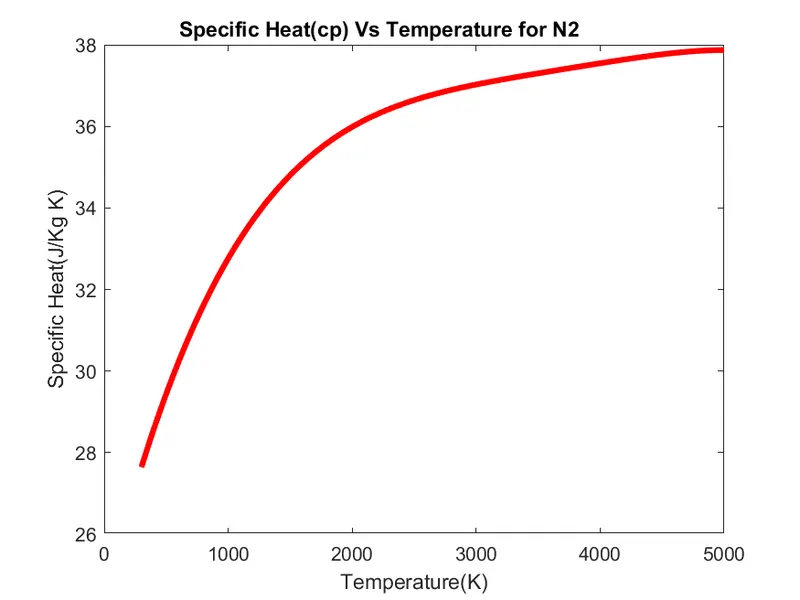
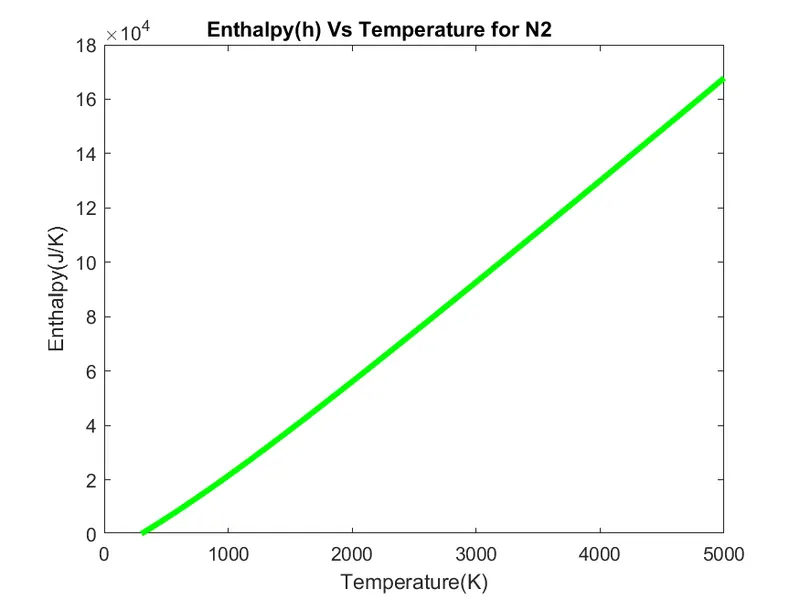
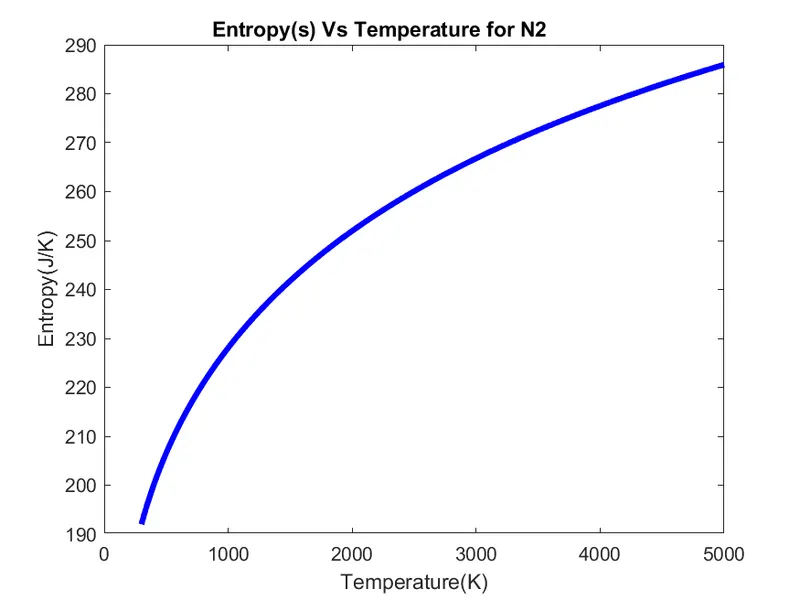
The plots for N2 is given below figures:
1)Specific Heat Vs Temp
2)Enthalpy Vs Temp
3)Entropy Vs Temp
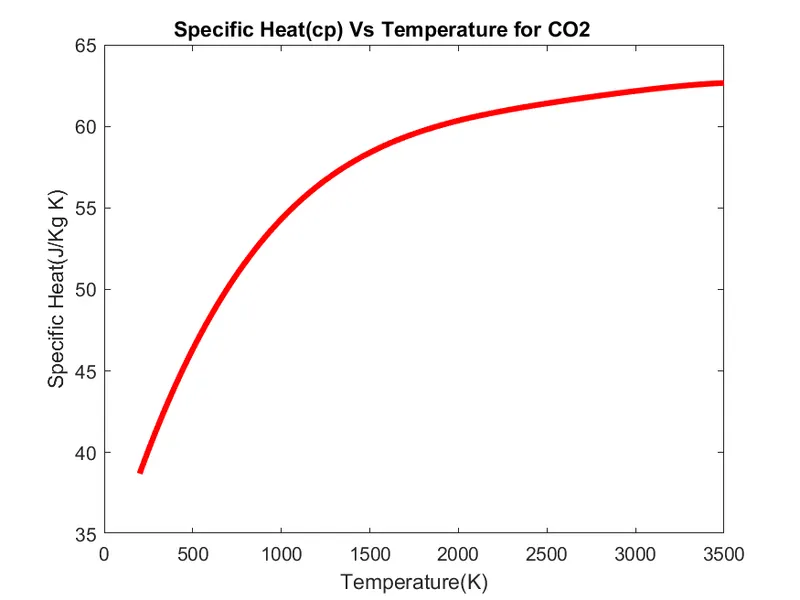
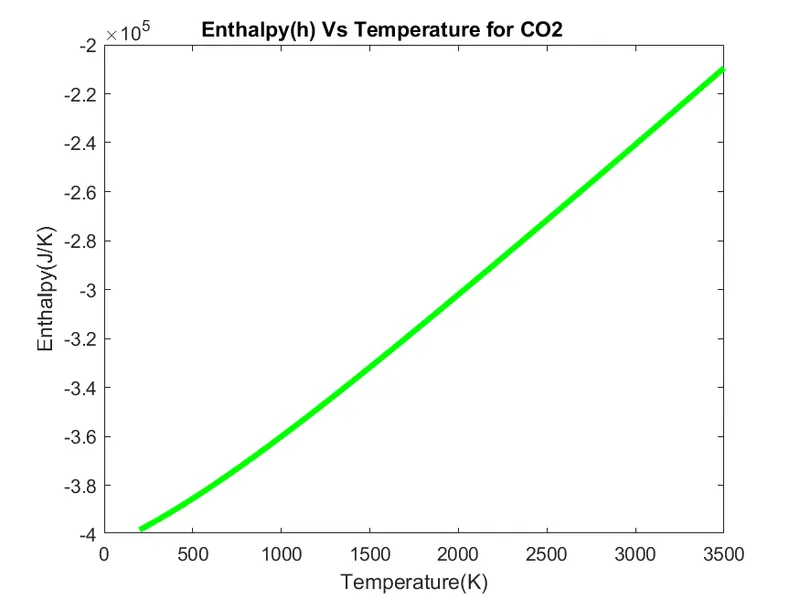
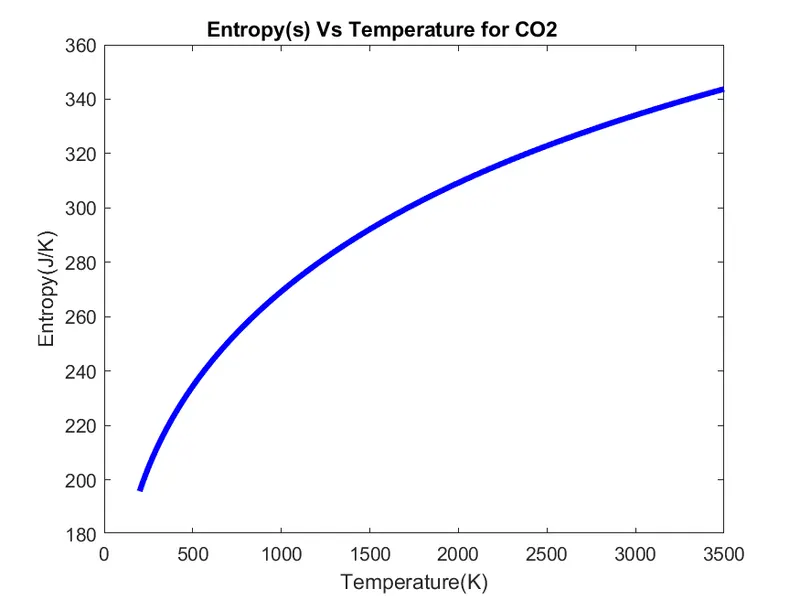
The Plots for CO2 is given below figures:
1)Specific Heat Vs Temp
2)Enthalpy Vs Temp
3)Entropy Vs Temp
Explainations for the code as below:
In given data file the first line shows the heading for the data given. and after that in the second line gives the details about the global temperature ranges for speices which contains global low temperature value , global mid temperature value and global high temperature value.
after that next three lines shows the comment lines. and then start the data for different speices.
in which the first line of the elements gives the name of the elements and the values of the local temperature range for that element which contains local low temp,local high temp and local mid temp value for that element.
and then next three lines shows the values of different 14 coefficients. in which first seven coefficients are high temperature coefficients and then another seven coefficients are low temperature coefficients.
so, now using the MATLAB code going to calculate the value of the specific heat(cp), enthalpy(h), entropy(s) and the molecular weight of each elements using the above data and the equation which is given as below:

now, in the code going to first of clear all the workspace and close all the files using the basic matlab commands.
after that usnig the fopen command the given data files is read and then using the fgetl command going to read the data one by one.
when use the fgetl command first time it is read the first line of the data file.
after that again use that command it reads the second line of the data.
in second line of the data gives the values of global temperature ranges.
so splitting the data for single value i use the code 'strsplit' and in this code use the blank space as a delimiter and it creates the array for temperature ranges values.
now from that array vector obtain the values for global low temp,mid temp and high temp i have use the 'str2num' command.
now using 'fgetl' command three times by using for loop and skip the next three lines which contains comments lines.
from line 6 to 218 , there is a set of 4 lines in which first line consist of the name of the speices and local temp values and other three lines consist the values of high temp coeffiecients anf low temp coefficients.
so , for each elements i am use the for loop for next 4 lines data of all elements. so here total 53 elements is given so going to use the for loop for 1 to 53.
now using the fgetl command red the first line of the elements and stored the values as a 'elements'. and definfing the name of that elements from the character of 1 to 14 and stored the value as a 'elements_name'.
now using 'strsplit' command split the lines and from that lines distingues the values of the local low temp,high temp, and mid temp values and stored them.
for next three lines of the elements use the 'fgetl' command and stored the values each as a 'line_1','line_2','line_3' respectively.
from that all lines finding the character 'E' and using that distingues the values for coefficients. so for finding the character 'E' for all lines use the code 'strfind' and stored the values each as a 'L1','L2','L3' respectively.
and using 'str2num' command stored and find the values of coefficeint and stored all values seperatly and in that values the first 7 coefficients values is for high temp and another seven is for low temp.
for next we entering the values of gas constant which is the standard value and store as R. now create a vector of 600 evenly spaced temp points by using 'linspace' command.
now running the for loop and creating a function for calculating the values of specific heat(cp), enthalpy(h) and the entropy(s) using the given equation.
for finding the molecular weight of the elements need the molecular weight of each contain atoms. so here in this all elements there are five atoms contain. so define that and store the values of that atomic mass . and using the for loop create the function for finding the values of atomic weight for each elements and printing that value using 'fprintf' command and display in command line as a output. and creating the text file for the all atomic weight of the elements.
now the all data is saving in the folder using 'cur_dir' and creating a new folder for each elements with their name using 'mkdir' command and store the data.
now in the next plot the values of all elements and save them as a image files.
at the end, close the NASA's thermodynamic data file with the help of 'fclose' command.
References:
mathworks help website used for reference of the all command and their work.
Error faced while run this code:
some grametical mistakes and one error found during storing the values of atoms in that i have used the 'AR' atom for storing the value which shows the error. so i have replace that with 'Ar' and the command run succesfully.