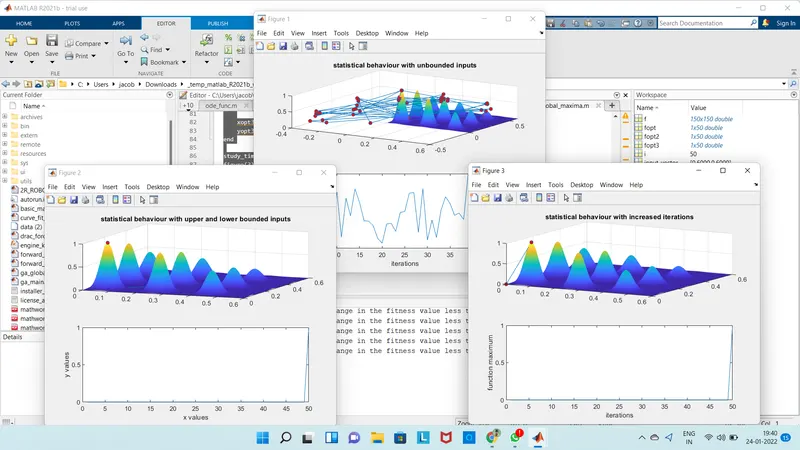
Week 4.1 - Genetic Algorithm
INSERT SAMPLE CODE
% CODE FOR GA GLOBAL MAXIMA

clear all
close all
clc

% defining our search space

x = linspace(0,0.6,150);% instead of , i have written .
y = linspace(0,0.6,150);

% total no of iterations
num_cases = 50


% creating a 2 dimensional mesh

[xx yy] = meshgrid(x,y);

% evaluating the stalagmite funtion and equating to f

for  i = 1:length(xx)
    for  j = 1:length(yy)
        input_vector(1) = xx(i,j);
        input_vector(2) = yy(i,j);
        f(i,j) = stalagmite(input_vector);
    end
end

% study1 statistical behaviour with unbounded inputs
% study timers tic toc commands
tic
for  i = 1:num_cases
    [inputs,fopt(i)] = ga(@stalagmite,2);
    xopt(i) = inputs(1);
    yopt(i) = inputs(1);
end

study_time_1 = toc
figure(1)
subplot(2,1,1)
hold on
surf(xx,yy,-f)
grid on
shading interp
plot3(xopt,yopt,-fopt,'marker','o','MarkerSize',5,'MarkerFaceColor','r')
title('statistical behaviour with unbounded inputs')
subplot(2,1,2)
plot(-fopt)
xlabel('iterations')
ylabel('function maximum')

% study2 statistical behaviour with upper and lower bound inputs

tic
for  k = 1:num_cases
    [inputs2,fopt2(i)] = ga(@stalagmite,2,[],[],[],[],[0;0],[0.4;0.4]);
    xopt2(k) = inputs2(1);
    yopt2(k) = inputs2(1);
end

study_time_2 = toc
figure(2)
subplot(2,1,1)
hold on
surf(x,y,-f)  % i have used xx,yy thats one error
grid on
shading interp
plot3(xopt2,yopt2,-fopt2,'marker','o','MarkerSize',5,'MarkerFaceColor','r')
title('statistical behaviour with upper and lower bounded inputs')
subplot(2,1,2)
plot(-fopt2)
xlabel('x values')
ylabel('y values')

% study3 increasing the population of ga
options = optimoptions('ga');
options = optimoptions(options,'PopulationSize',170);

tic
for  m = 1:num_cases
    [inputs3,fopt3(i)] = ga(@stalagmite,2,[],[],[],[],[0;0],[0.4;0.4],[],[],options);

    xopt3(k) = inputs3(1);
    yopt3(k) = inputs3(1);
end

study_time_3 = toc
figure(3)
subplot(2,1,1)
hold on
surf(xx,yy,-f)
grid on
shading interp
plot3(xopt3,yopt3,-fopt3,'marker','o','MarkerSize',5,'MarkerFaceColor','r')
title('statistical behaviour with increased iterations')
subplot(2,1,2)
plot(-fopt3)
xlabel('iterations')
ylabel('function maximum')

% stalagmite function

function f = stalagmite(i)
x = i(1);
y = i(2);
a = (sin(5.1*pi*x+0.5))^6;
b = (sin(5.1*pi*y+0.5))^6;
c = exp(-4*log(2)*(x-0.0667)^2/0.64);
d = exp(-4*log(2)*(y-0.0667)^2/0.64);
f = -a*b*c*d;
end
Genetic Algorithm(ga) are optimisation technique used to solve non linear or non differentiable optimisation problems.They use concepts from evolutionary biology to search for global minimum an optimisation problem.
MATLAB has a inbuilt predefined function for genetic algorithm ga, it is used to minimise problems. This is similar to a process that performs biological evolution.
Syntax of GA in MATLAB
Study 1
x = ga(fun,nvars);
fun = function name
nvars = number of variables
study 2
x = ga(fun,nvars,A,B,Aeq,Beq,lb,ub);
A = linear inequality constraints as real matrix
B = linear inequality constraints as real vector
Aeq =linear equality constraints as real matrix
Beq = linear equality constraints as real vector
lb = lower boundary
ub = upper boundary
study 3
x = ga(fun,nvars,A,B,Aeq,Beq,lb,ub,nonlcon,intcon,options);
nonlcon = non linear constraints
options = creating optimisation option using 'optimoptions'
Explanation of code
first of all clear all, close all , clc commands are for making sure only program variables are used,in the code and all other get erased by this command.
The search space of ga is used by linspace command where x and y values be in between from 0 to 0.6 , here 150 values are used as search space.
The number of iterations of ga is num_cases = 50;
By using meshgrid command of x and y we can create a 2dimensional plot.
Then for loop is used to give inputs to stalagmite function
study timers commands tic toc commands are used
The ga syntax is used for study1 (unbounded inputs)
x = ga(fun,nvars)
Figure command is used for opening a figure window and using subplot command to get multiple plots in one figure window.
plot3 command is used to get the surface as 3d .
Using title command to get a title to the plot.
In the 2nd study we are using upper boundary and lower boundary in the syntax of ga
x = ga(fun,nvars,A,B,Aeq,Beq,lb,ub)
Incase of 3rd study we are using optimoptions and increased iterations size to 170
x = ga(fun,nvars,A,B,Aeq,Beq,lb,ub,nonlcon,intcon,options)
OUTPUT