Week 4.1 - Genetic Algorithm
Theory of ga
The idea of GA was proposed by Holland in his 1975 book. Since then GA has been an active field of research and there has been numerous publications on it. TSP is one of the problems where GA has been successfully used.
GA has two primary functions: population selection and crossover. Selection algorithm describes the methodology to pick parents that will create children for the next generation. There are four strategies shown in the diagram: elite, roulette, rank, and tour. The elite strategy gives preference to selecting the best members from the current population itself . In roulette selection, members are mapped to a roulette wheel occupying space that is proportional to their fitness and members are selected randomly from it avoiding duplicates. Rank selection method is similar to roulette, but instead of proportional representation of the pie based on fitness, members are ranked in ascending order based on their fitness . In tournament selection, population members are chosen to compete and the best one is selected to be a parent from the pool of members . This process is continued until all members have been examined.
- Uses concepts from evolutionary biology.
- Starts with an initial generation of candidate solution that are tested against the objective function.
- Subsequent generation envolve from the 1st through selection,crossover & mutation.
How Evolution works?
Selection - Retain the best performing bit string from one generation to the next.
parent1 = [1 0 1 0 0 1 1 0 0 0]
parent2 = [1 0 0 1 0 0 1 0 1 0]
Crossover -
parent1 = [1 0 1 0 0 1 1 0 0 0]
parent2 = [1 0 0 1 0 0 1 0 1 0]
child = [1 0 0 0 0 1 1 0 1 0]
Mutation -
parent1 = [1 0 1 0 0 1 1 0 0 0]
child = [0 1 0 1 0 1 0 0 0 1]
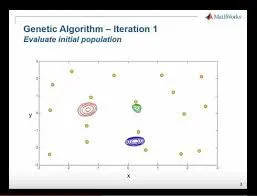
Genetic Algoritm - Iteration 1
Evolute Initial Population
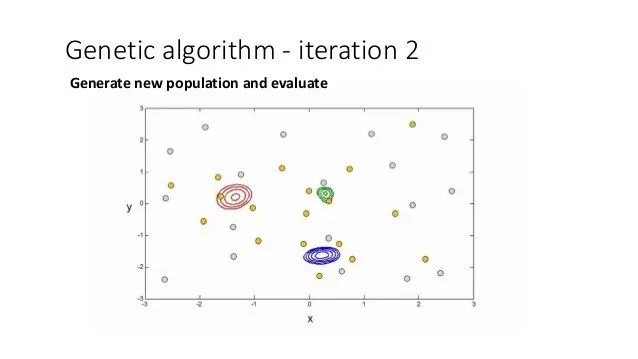
Genetic Algoritm - Iteration 2
Evolute Initial Population
Stopping Criteria
The number of iterations in an optimization depends on a solver's stopping criteria. These criteria include several tolerance you can set. Generally, a tolerance is threshold which, if crossed,stop the iterations of a slover.
Syntax for ga
The 'ga' syntex in the matlab is used to find the minimum of function using genetic algorithm. There are several ways to define the 'ga' function depending on the problem being solved. The syntex used for this study is shown.
- x = ga(fun,nvars)
where,
x = optimal solution / variables
fun = objective function
nvars = number of variables
Sometimes '[x,fval]' is used instead of 'x' where 'fval' gives objective function value at the solution.
- x = ga(fun,nvars,A,B,Aeq,Beq,lb,ub)
where,
A,B = Linear inequality constraint
Aeq,Beq = Linear equality constraint
If there are no linear equalities & inequalities , then A,B,Aeq,Beq are set to [];
- x = ga(fun,nvars,A,B,Aeq,Beq,lb,ub,nonlcon,intCon,options)
where,
nonlcon = non lineae constraint
intCon = integer value
options = optimization option
If there is no non linear constrain and interger values , the nonlcon and intCon are set to '[]'.
Signification of running multiple iteration
Some results suggest that multiple runs can reach solutions of similar or better quality than a single run in a shorter time.The search for the best solution depends mainly on the creation of new individuals from the old ones. The process of crossover ensures the exchange of genetic material between parents and thus creates chromosomes that are more likely to be better than the parents.
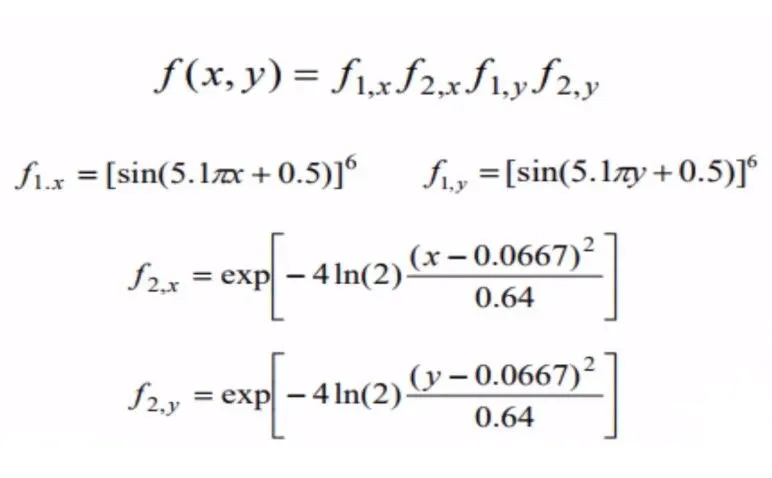
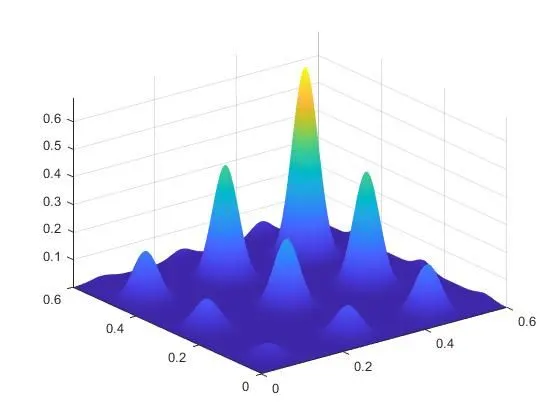
Stalagmite Function
A stalagmite function generally refers to the function with which we are generating values over a stalagmite kind of surface for finding out the local and global maxima and minima of that particular given function.
CODE OF STALAGMITE FUNCTION
% mathematical formulae

function [A] = stalagmite(input_vector)

x = input_vector(1);
y = input_vector(2);

f1 = [sin(5.1*pi*x + 0.5)].^6;
f2 = exp(-4*log(2)*((x-0.667).^2)/0.64);
f3 = [sin(5.1*pi*y + 0.5)].^6;
f4 = exp(-4*log(2)*((y-0.667).^2)/0.64);
A = -(f1*f2*f3*f4);

end
GENETIC CODING
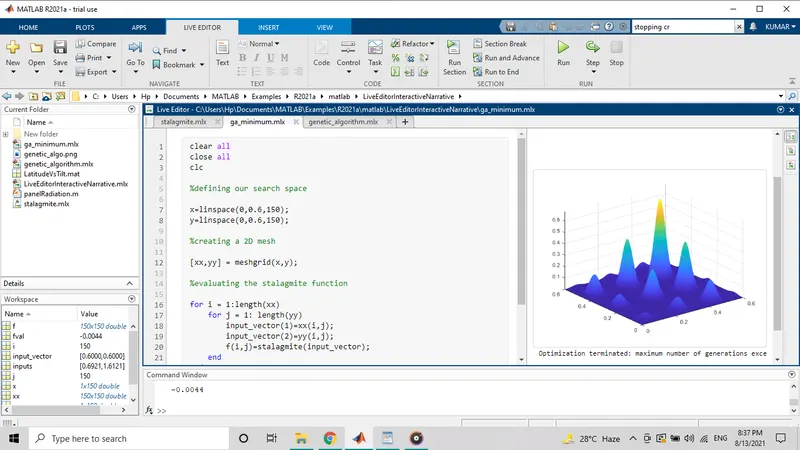
Stalagmite Mathematical Model
clear all
close all
clc

%defining our search space

x=linspace(0,0.6,150);
y=linspace(0,0.6,150);

%creating a 2D mesh

[xx,yy] = meshgrid(x,y);

%evaluating the stalagmite function

for i = 1:length(xx)
    for j = 1: length(yy)
        input_vector(1)=xx(i,j);
        input_vector(2)=yy(i,j);
        f(i,j)=stalagmite(input_vector);
    end
end

%plotting
surfc(xx,yy,-f)
shading interp
[inputs,fval]=ga(@stalagmite,2)
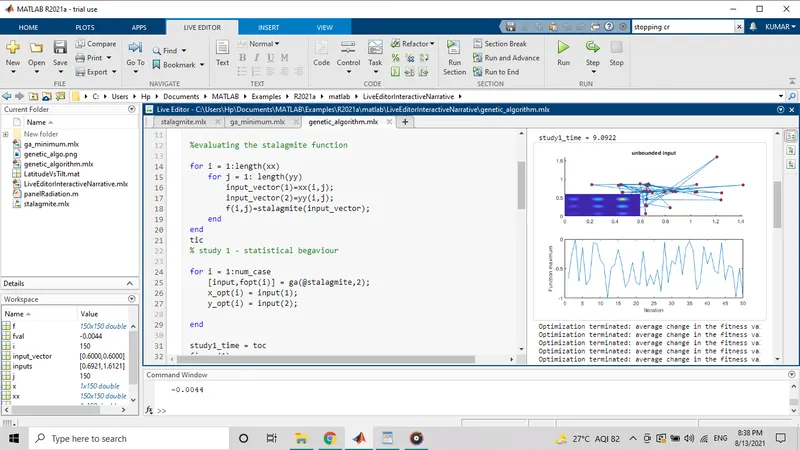
GENETIC ALOGITHM CODE
clear all
close all
clc

x = linspace(0,0.6,150);
y = linspace(0,0.6,150);

num_case = 50

[xx,yy] = meshgrid(x,y);

%evaluating the stalagmite function

for i = 1:length(xx)
    for j = 1: length(yy)
        input_vector(1)=xx(i,j);
        input_vector(2)=yy(i,j);
        f(i,j)=stalagmite(input_vector);
    end
end
tic
% study 1 - statistical begaviour

for i = 1:num_case
    [input,fopt(i)] = ga(@stalagmite,2);
    x_opt(i) = input(1);
    y_opt(i) = input(2);

end

study1_time = toc
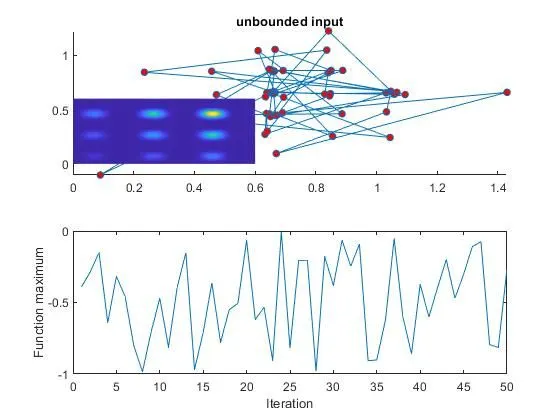
figure(1)
subplot(2,1,1)
hold on
surfc(x,y,-f)
shading interp
plot3(x_opt,y_opt,fopt,'marker','o','markersize',5,'markerfacecolor','r')
title('unbounded input')
subplot(2,1,2)
plot(fopt)
xlabel('Iteration')
ylabel('Function maximum')

% study2 - statistical behaviour - with upper & lower bound

for i = 1: num_case
    [input,fopt(i)] = ga(@stalagmite,2,[],[],[],[],[0;0],[1,1]);
    x_opt(i)=input(1);
    x_opt(i)=input(2);

end

study2_time=toc
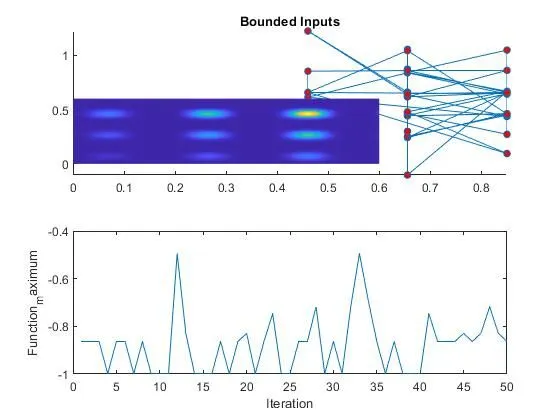
figure(2)
subplot(2,1,1)
hold on
surfc(x,y,-f)
shading interp
plot3(x_opt,y_opt,fopt,'marker','o','markersize',5,'markerfacecolor','r')
title('Bounded Inputs')
subplot(2,1,2)
plot(fopt)
xlabel('Iteration')
ylabel('Function_maximum')

%study3 - Increasing ga interactions

options = optimoptions('ga');
options = optimoptions(options,'PopulationSize',170);
tic

for i = 1:num_case
    [input,fopt(i)]=ga(@stalagmite,2,[],[],[],[],[0;0],[1,1]);
    x_opt(i)=input(1);
    x_opt(i)=input(2);

end

study3_time = toc
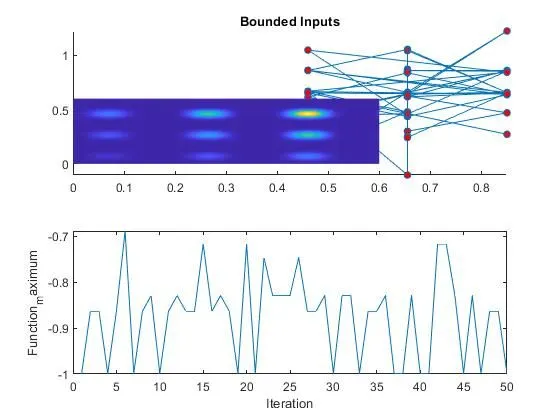
figure(3)
subplot(2,1,1)
hold on
surfc(x,y,-f)
shading interp
plot3(x_opt,y_opt,fopt,'marker','o','markersize',5,'markerfacecolor','r')
title('Bounded Inputs')
subplot(2,1,2)
plot(fopt)
xlabel('Iteration')
ylabel('Function_maximum')
GRAPHS
ERRORS:
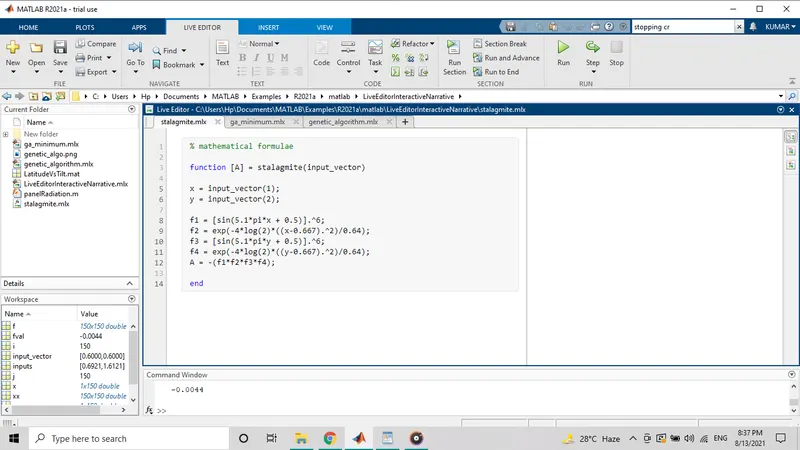
Not such serious error was on the time of code writing , but
- minor mistakes in the brackets in writing the code for stalagmite function.
- In genetic algorithm code had some issues in plot syntex.
SOURCE:
- mathworks.com
- google.com
- youtube.com