Week 4.1 - Genetic Algorithm
AIM :- To find a optimise global maxima of the stalagmite function using MATLAB code.
OBJECTIVE :-
- optimised global maxima of the stalagmite function.
- clearly explain the genetic algoritham (GA) syntax in MATLAB.
- To get same output and plot three studies F maximum vs no of iterations.
THEORY :-
Stalagmite Function :-
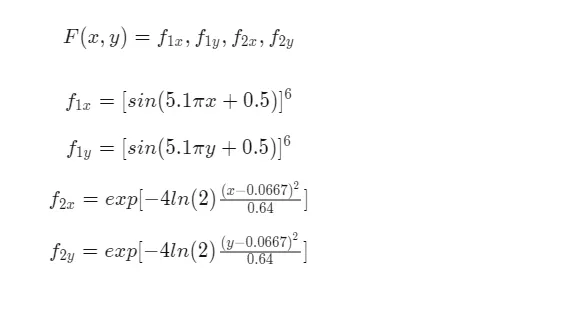
A stalagmite function generally refers to the function with which we are generating values over a stalagmite kind of surface for finding out the local and global maxima and minima of the particular given function, For this in matlab we are using a method i called optimization.
Genetic Algoritham (GA) :-
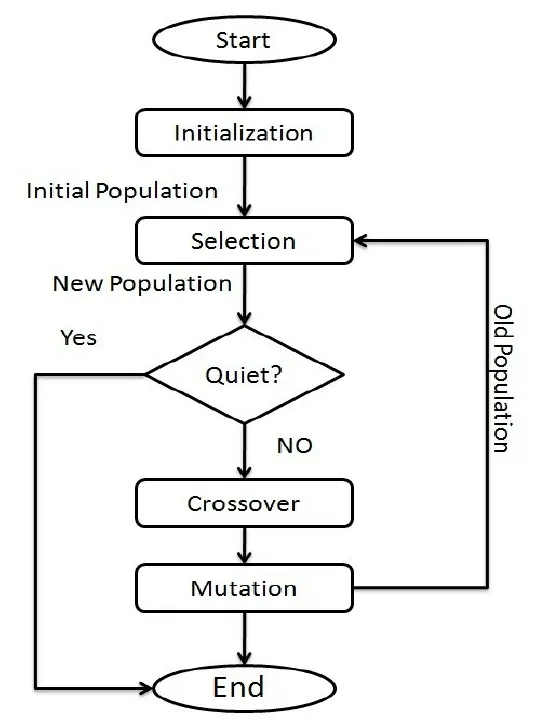
Genetic Algorithms (GAs) comes under category of evoluvationary algorithms with working principle based on the mechanics of natural genetics. The basic objective in natural genetics is retention of the fit genes and discard of the redundant. New generations created by manipulating the genetic code using the tools such as selection, cross over and mutation. GA also works in similar manner with the objective to search appropriate solutions for the problems involving either minimization or maximization of the objective function. GA use to similar tools selectin, crossover and mutation applied to the population binary strings generated randomly. in every generation, a new set of artificial spices or strings is created using bits and pieces of the fittest amoung old, an occosional new part of may be tried for good measure. Genetic algoritham are proven to yield robust search in complex spaces.
Five Phases are considered in a Genetic Algorithm:-
- Initial population
- Fitness function
- Selection
- Cross over
- Mutation
Initial Population :-
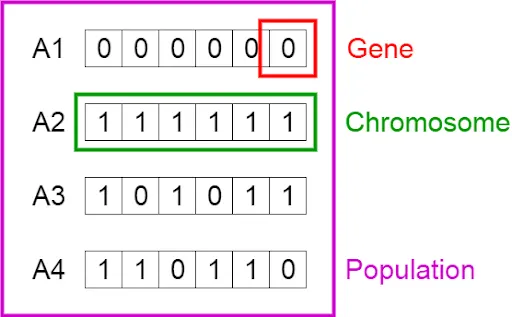
The process begins with a set of indviduals which is called a population. each invidual is solution to the problem you want solve. an individual is characterized by a set of parameters (variables) known as Genes. Genes are joined into string to form a chromosome (solution). In genetic algorithm, the set of genes of an indivudal is represented using a string. in terms of an alphabet. usually binary values are used (string of 1s and 0s) we stay that we encode the genes in a chromosome.
Fitness Function :-
Fitness function determines how fit on individuals is the ability of an individual to complete with other inviduals. It gives a fitness score to each invidual. the probality that an invidual will be selected for the reproduction is based on its fitness score.
Selection :-
The idea of selection phase is to be select the fittest inviduals and let them pass their genes to next generation. two parts of individuals (parents) are selected based on their fitness scores. Inviduals with high fitness have more chance to be selected for reproduction.
Crossover :-
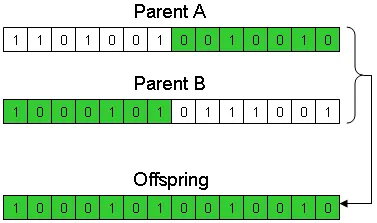
- Crossover is the most significatnt phase in agenetic algorithm. for each pair of parents to be mated a crossover point is choosen at random from within the genes.
- Offspring are created by exchanging the genes of parents amoung themesleves untill the cross over point reached.
- A new offspring added to the population.
Mutation :-
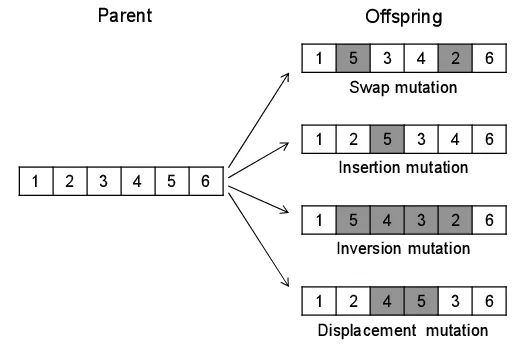
In certain new offspring formed, some of their genes can be subjected to a mutation with low random probability. This implies that same of bits in the bit string can be fipped. mutation occurs to maintain diversity within the population and prevent prematine convergence.
Termination :-
The algorithm terminates if the population has converged (does not produce offspring which are significantly diffrent from the previous generation). Then it is said that the genetic algorithm has provided set solutions to our problem.
Matlab syntax of Genetic Algorithm :-
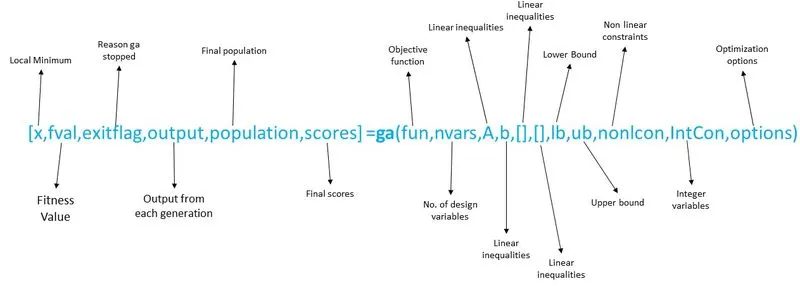
- Local minimum
- Fitness value
- Reason ga stopped
- Ouput from each generation
- Final scores
- objective function
- No.of design variables
- Linear inequalites
- lower bound
- upper bound
- non linear constraints
- integer variables
- Optimization options
STOPPING CRITERIA :-
- Stopping criteria, since an iterative method compute the succesive approximations to the solution of a linear system, a practical test is needed to determine when to stop the iteration. ideally this test will measure the distance of the last iterate to the true solution. but this is not possible.
- For iterative methods the diffrence from one iteration to the other gets lower and lower as it is supposed to converge. Therefore absolute error or absolute squrred error from one iteration to the other is usually defined as the stopping criterion.
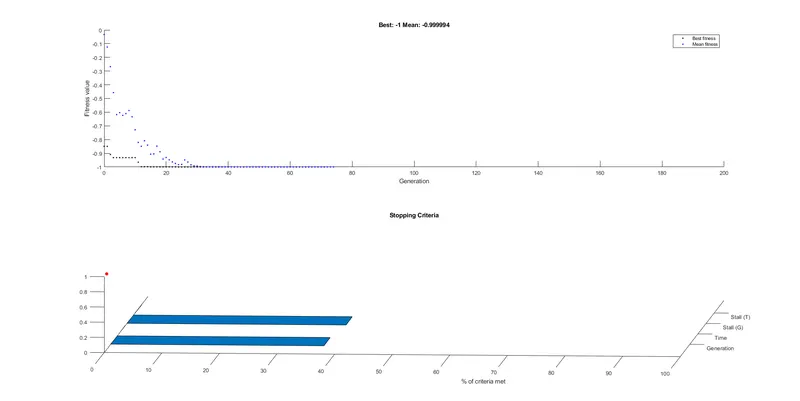
- Stopping criteria options is MaxGenerations, Maxtime, MaxStallGenerations,MaxstallTime,FunctionTolerence, ConstraintTolerence.
Syntax for stopping criteria :-
options = optimoptions('ga','OutputFcn',@myfun); (single output functions)
options = optimoptions('ga','OutputFcn',{@myfun1,@myfun2,...}); (multiple output functions)
MATLAB PROGRAM CODE :-
Stalagmite Function Code :-
function [f1] = stalagmite_fun(input_vector)
f1x = (sin((5.1*pi).*input_vector(1)+0.5)).^6;
f1y = (sin((5.1*pi).*input_vector(2)+0.5)).^6;
f2x = exp((((input_vector(1)-0.0667).^2)/0.64)*(-4*log(2)));
f2y = exp(((input_vector(2)-0.0667).^2/0.64)*-(4*log(2)));
f1 = f1x*f1y*f2x*f2y;
[f1] = -f1;
end
STUDY 1 :- (Unbounds)
% Start of the program of (Unbounds)
clear all
close all
clc
% Defining the constraints (1D array)
x = linspace (0,0.6,150);
y = linspace (0,0.6,150);
num_cases = 50;
% Converting array (1D to 2D) use of meshgrid
[xx yy] = meshgrid(x,y);
num_cases = 50;
% Nested loop for array value input
for  i = 1:length(xx)
  for j = 1:length(yy)
    input_vector(1) = xx(i,j);
    input_vector(2) = yy(i,j);
    f(i,j) = stalagmite_fun(input_vector) ;
    end
end
tic
% Genetic Algoritham (GA)
for i = 1:num_cases
[input,fval(i)] = ga(@stalagmite_fun,2);
x_out(i) = input(1);
y_out(i) = input(2);
end
study_1time_1 = toc
% Creating a figure
figure(1)
% Creating a subplot
subplot(2,1,1)
% Creating a surface
surfc(xx,yy,-f)
% To make axix labelling
xlabel('X-value')
ylabel('Y-value')
% To give title of code
title('study_1(unbounded)','color','k')
% Creating a shading
shading interp
hold on;
% To creating a plot
plot3(x_out,y_out,-fval,'marker','o','markersize',6,'markerfacecolor','r');
subplot(2,1,2)
plot(-fval);
xlabel('No of iterations')
ylabel('max function value')
STUDY 2 :- (Upper and Lower bounds)
% Start of the program (upper and lower Bounds)
clear all
close all
clc
% Defining the constraints (1D array)
x = linspace (0,0.6,150);
y = linspace (0,0.6,150);
num_cases = 50;
% Converting array (1D to 2D) use of meshgrid
[xx yy] = meshgrid(x,y);
num_cases = 50;
% Nested loop for array value input
for  i = 1:length(xx)
  for j = 1:length(yy)
    input_vector(1) = xx(i,j);
    input_vector(2) = yy(i,j);
    f(i,j) = stalagmite_fun(input_vector) ;
    end
end
tic
% Genetic Algoritham (GA)
for i = 1:num_cases
[input,fval(i)] = ga(@stalagmite_fun,2,[],[],[],[],[0;0],[0.6;0.6]);
x_out(i) = input(1);
y_out(i) = input(2);
end
study_1time_2 = toc
% Creating a figure
figure(2)
% Creating a subplot
subplot(2,1,1)
% Creating a surface
surfc(xx,yy,-f)
% To make axix labelling
xlabel('X-value')
ylabel('Y-value')
% To give title of code
title('study_1(unbounded)','color','k')
% Creating a shading
shading interp
hold on;
% To creating a plot
plot3(x_out,y_out,-fval,'marker','o','markersize',6,'markerfacecolor','r');
subplot(2,1,2)
plot(-fval);
xlabel('No of iterations')
ylabel('max function value')
STUDY 3 :- Increasing Genetic algorithm iterations and give population size)
% Start of the program (Increasing Genetic algoritham iterations and give population size)
clear all
close all
clc
% Defining the constraints (1D array)
x = linspace (0,0.6,150);
y = linspace (0,0.6,150);
num_cases = 50;
% Converting array (1D to 2D) use of meshgrid
[xx yy] = meshgrid(x,y);
num_cases = 50;
% Nested loop for array value input
for  i = 1:length(xx)
  for j = 1:length(yy)
    input_vector(1) = xx(i,j);
    input_vector(2) = yy(i,j);
    f(i,j) = stalagmite_fun(input_vector) ;
    end
end
tic
% Genetic Algoritham (GA)
options = optimoptions('ga');
options = optimoptions(options,'populationsize',100);
for i = 1:num_cases
[input,fval(i)] = ga(@stalagmite_fun,2,[],[],[],[],[0;0],[0.6;0.6],[],[],options);
x_out(i) = input(1);
y_out(i) = input(2);
end
study_1time_3 = toc
% Creating a figure
figure(3)
% Creating a subplot
subplot(2,1,1)
% Creating a surface
surfc(xx,yy,-f)
% To make axix labelling
xlabel('X-value')
ylabel('Y-value')
% To give title of code
title('study_1(unbounded)','color','k')
% Creating a shading
shading interp
hold on;
% To creating a plot
plot3(x_out,y_out,-fval,'marker','o','markersize',6,'markerfacecolor','r');
subplot(2,1,2)
plot(-fval);
xlabel('No of iterations')
ylabel('max function value')
STUDY 4 :- Practise program
% Start of the program (Increasing Genetic algoritham iterations and give population size)
clear all
close all
clc
% Defining the constraints (1D array)
x = linspace (0,0.6,300);
y = linspace (0,0.6,300);
num_cases = 100;
% Converting array (1D to 2D) use of meshgrid
[xx yy] = meshgrid(x,y);
num_cases = 100;
% Nested loop for array value input
for  i = 1:length(xx)
  for j = 1:length(yy)
    input_vector(1) = xx(i,j);
    input_vector(2) = yy(i,j);
    f(i,j) = stalagmite_fun(input_vector) ;
    end
end
tic
% Genetic Algoritham (GA)
options = optimoptions('ga');
options = optimoptions(options,'populationsize',500);
for i = 1:num_cases
[input,fval(i)] = ga(@stalagmite_fun,2,[],[],[],[],[0;0],[0.6;0.6],[],[],options);
x_out(i) = input(1);
y_out(i) = input(2);
end
study_1time_4 = toc
% Creating a figure
figure(4)
% Creating a subplot
subplot(2,1,1)
% Creating a surface
surfc(xx,yy,-f)
% To make axix labelling
xlabel('X-value')
ylabel('Y-value')
% To give title of code
title('study_1(unbounded)','color','k')
% Creating a shading
shading interp
hold on;
% To creating a plot
plot3(x_out,y_out,-fval,'marker','o','markersize',6,'markerfacecolor','r');
subplot(2,1,2)
plot(-fval);
xlabel('No of iterations')
ylabel('max function value')
STOPPING CRITERIA :-
% start the program (stopping crietria)
clear all
close all
clc
% Defining the constraints (1D array)
x = linspace (0,0.6,150);
y = linspace (0,0.6,150);
num_cases = 100;
% Converting array (1D to 2D) use of meshgrid
[xx yy] = meshgrid(x,y);
num_cases = 100;

%creating the surface plot of stalagmite function
 for i=1:length(xx)
     for j=1:length(yy)
         input_vector(1)=xx(i,j);
         input_vector(2)=yy(i,j);
         f(i,j)=stalagmite_fun(input_vector);
     end
 end
 options=optimoptions('ga','plotFcn',{@gaplotbestf,@gaplotstopping},'populationsize',200);
[x,fval]=ga(@stalagmite_fun,2,[],[],[],[],[0;0],[1;1],[],options);
xopt=x(1);
yopt=x(2);

figure(1)
hold on
plot3(xopt,yopt,-fval,'ro','markersize',5,'markerfacecolor','r')
MATLAB CODE EXPLANATION STEP BY STEP PROCEDURE :-
- Write a code in MATLAB to optimise the stalagmite function and find the global maxima of the function. To write the stalagmite calling function code based on stalagmite equation.
function [f1] = stalagmite_fun(input_vector)
f1x = (sin((5.1*pi).*input_vector(1)+0.5)).^6;
f1y = (sin((5.1*pi).*input_vector(2)+0.5)).^6;
f2x = exp((((input_vector(1)-0.0667).^2)/0.64)*(-4*log(2)));
f2y = exp(((input_vector(2)-0.0667).^2/0.64)*-(4*log(2)));
f1 = f1x*f1y*f2x*f2y;
[f1] = -f1;
end- we start the explain the code from study 3 starting point is the inputs of deifining constraints and converting one dimension arrays to two dimension arrays using mesh grid command and also give the number of cases in 50.
% Defining the constraints (1D array)
x = linspace (0,0.6,150);
y = linspace (0,0.6,150);
num_cases = 50;
% Converting array (1D to 2D) use of meshgrid
[xx yy] = meshgrid(x,y);
num_cases = 50;- To create Nested loop for array value input vector i,j and constrain region for two dimensional xx and yy and calling the stalagmite function.
% Nested loop for array value input
for  i = 1:length(xx)
  for j = 1:length(yy)
    input_vector(1) = xx(i,j);
    input_vector(2) = yy(i,j);
    f(i,j) = stalagmite_fun(input_vector) ;
    end
end- Tic and toc function and displays the elapsed time since the most recent call to the tic function without an output. The elasped time with in expressed seconds.
- Genetic Algorithms syntax is called functions is options and optimo options 'ga'. geetic algorithm syntax fortmat is [x fval] = ga (@objectivefunction ,nvars,[],[],[],[],lower bound, upper bound,[],integers,options). nvars- Number of variables, [] - linear equality or unequality constraints and integers. options - GA optimization techniques. and also to functioned for for loop to give input vector datas.
% Genetic Algoritham (GA)
options = optimoptions('ga');
options = optimoptions(options,'populationsize',100);
for i = 1:num_cases
[input,fval(i)] = ga(@stalagmite_fun,2,[],[],[],[],[0;0],[0.6;0.6],[],[],options);
x_out(i) = input(1);
y_out(i) = input(2);
end
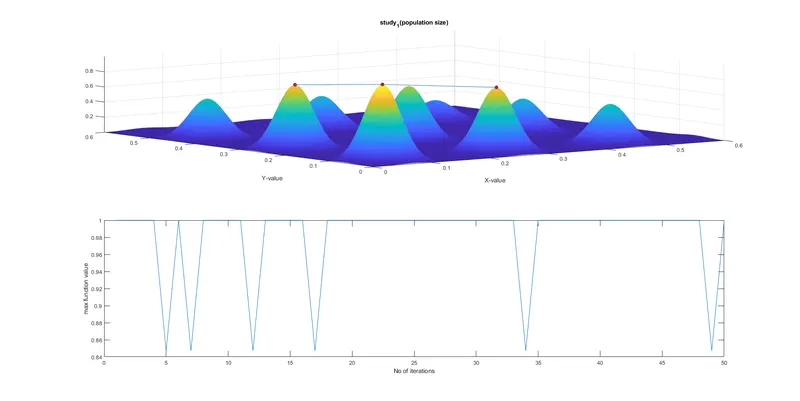
study_1time_3 = toc- To create a figure, subplot and surface plot to show the maximized results, and accuracy to point out the global maxima points in given number of iterations.
% Creating a figure
figure(3)
% Creating a subplot
subplot(2,1,1)
% Creating a surface
surfc(xx,yy,-f)
% To make axix labelling
xlabel('X-value')
ylabel('Y-value')
% To give title of code
title('study_1(population size)','color','k')
% Creating a shading
shading interp
hold on;- To make a axis labelling and give the title of code and also creating a shading of the figure. the subplot make a same plot figure in two plots. The hold on command used to stay in the same plot make and attached in another plot.
% To creating a plot
plot3(x_out,y_out,-fval,'marker','o','markersize',6,'markerfacecolor','r');
subplot(2,1,2)
plot(-fval);
xlabel('No of iterations')
ylabel('max function value')- To creating a plot outputs of given values it is based on number of iterations and maximum function value. axis labelling also mentioned as x axis and y axis.
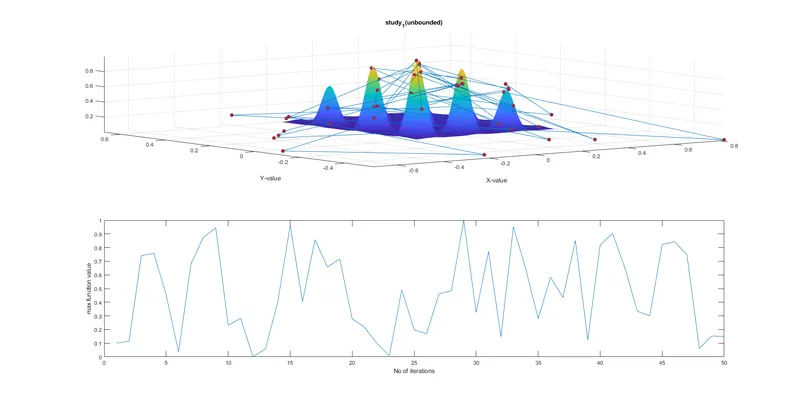
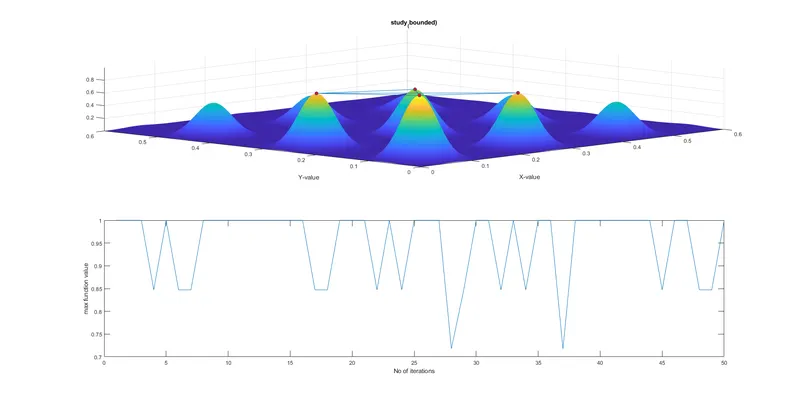
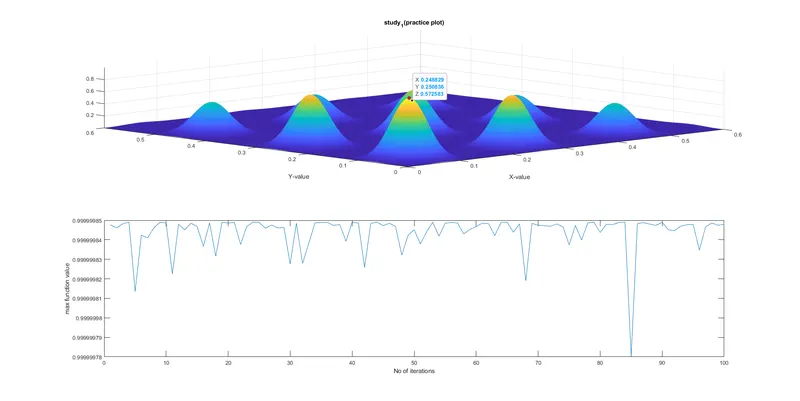
- The number three of studies to get diffrent plots and sub plots. it's graphically representation or display the glopal maxima values points in particular iterations. plots are shown given below,
STUDY 1 :- (Unbounds)
STUDY 2 :- (Upper and Lower bounds)
STUDY 3 :- Increasing Genetic algorithm iterations and give population size)
STUDY 4 :- Practise program
STOPPING CRITERIA :-
Error mentioning and Overcome the Errors :-
The error is geting my self to write a code on stalagmite equvation into code, used number of open and closed brackets mistake that point, and also creating a for loop calling function name same to displayed error. this mistakes we overcome easily.
RESULT AND DISCUSSION :-
- Optimise the stalagmite function and find out the global maxima ponit of the given function is solved in diffrent studies, The tic tac command used to measured time taken for each study to get ouput plots.
- Study 1 to give without unbounds the stalagmite function run and global maxima in many points it's collapsed and confused plot we get and hard to find the global maxima point, in this process take a time is (study time 1 :- 3.9172) in seconds.
- Study 2 to give upper bound and lower bound values the stalagmite function run and global maxima get in four maximum points, it is easy to find global maxima ponit compare to study 1. in this process take a time is (study time 2 :- 5.5145) in seconds.
- study 3 to give population size with same iterations of study 2, the stalagmite function run and global maxima get in three points, it is to global maxima point compare to study 1&2. in this process take a time is (10.1137) in seconds.
- study 4 is a practice type to increasing the population size 500 and number of iteration 100, the stalagmite function run and get global maxima get accurately one point, that point consider a global maxima value of stalagmite function of genetic algorithm. it is easy to find the global maxima value in previous studies. In this process take a time into (73.0189) in seconds.
CONCLUSION :-
- The conclude of a optimise the stalagmite function to find out the global maxima, comparative all studies to get a best solution is to increase a population size and also increase the number of iterations, to get a accurate results it is easily point out in plots.
- To increase the population size and number of iterations in this process take a time to get better results.