Week 4.1 - Genetic Algorithm
PROJECT GENETIC ALGORITHM
AIM- Write a code in MATLAB to optimise the stalagmite function and find the global maxima of the function.
Plot graphs for all 3 studies and for F maximum vs no. of iterations with Title and labels.
THEORY-
STALAGMIGHT- Stalagmites are convex deposits that grow upward, commonly fed by an overhanging stalactite and show flat, rounded, or slightly hollow tops, but not a central canal. The morphology of stalagmites is mostly determined by the drip rate, and in particular by the interannual variability of the drip rate and by the distance from the tip of the feeding stalactite.
Genetic Algorithm (GA) is a search-based optimization technique based on the principles of Genetics and Natural Selection. It is frequently used to find optimal or near-optimal solutions to difficult problems which otherwise would take a lifetime to solve. It is frequently used to solve optimization problems, in research, and in machine learning.
Optimization is the process of making something better. In any process, we have a set of inputs and a set of outputs.
Population − It is a subset of all the possible (encoded) solutions to the given problem. The population for a GA is analogous to the population for human beings except that instead of human beings.
cross over- In this section we will discuss some of the most popularly used crossover operators. It is to be noted that these crossover operators are very generic and the GA Designer might choose to implement a problem-specific crossover operator as well.
selection- Based on the fitness values of each individual, at each generational step, a parents is chosen from the parent population, using a selection mechanism, such that the fittest individuals will have a greater probability of passing on genetic material to subsequent generations.
mutation- Mutation in gentic Algorithms is typically the standard method of introducing new genetic material into the population. Once the child population has been created through crossover, mutation in Genetic Algorithms then occurs on all children in a bit flip fashion by randomly changing on the chromosome.
EQUATION-
stalagmite mathematical eq,
FUNCTION CODE FOR THE GA-
%function call for the GA(genetic algorithm)

function f = func_stalagmite(input_value)
x = input_value(1);
y = input_value(2);

fx1=(sin(5.1*pi*x+0.5))^6;
fy1=(sin(5.1*pi*y+0.5))^6;

fx2=exp((-4*log(2)*(x-0.0667)^2)/(0.64));
fy2=exp((-4*log(2)*(y-0.0667)^2)/(0.64));

f=-(fx1*fy1*fx2*fy2);
end
MAIN CODE-
% PROJECT GENETIC ALGORITHM (GA)
%Stalagmite function

clear all
close all
clc

% Defining search space in 1-D arrray
x=linspace(0,0.6,150);
y=linspace(0,0.6,150);

%create mesh in 2-D array
[xx,yy]=meshgrid(x,y);
for i=1:length(xx)
    for j=1:length(yy)
        input_value(1)=xx(i,j);
        input_value(2)=yy(i,j);
        f(i,j)=func_stalagmite(input_value); % input values of function
    end
end

%study 1 (UN-BOUNDED CASE)
% for first iteration
num_case = 50;

tic
for i = 1:num_case
    [input_value,fopt(i)] = ga(@func_stalagmite,2);

    xopt(i) = input_value(1); %@ each iteration value of x
    yopt(i) = input_value(2); %@ each iteration value of y
end

case_1_time=toc; %displaying the time taken to evaluate

%Plotting
figure(1)        %creates separate window for plotting
subplot(2,1,1)   %creates multiple plots on same window
surfc(xx,yy,-f); % - denotes maximizing function
shading interp   % making smooth and removing the grid lines in plot
hold on
%to plot optimum values and function values
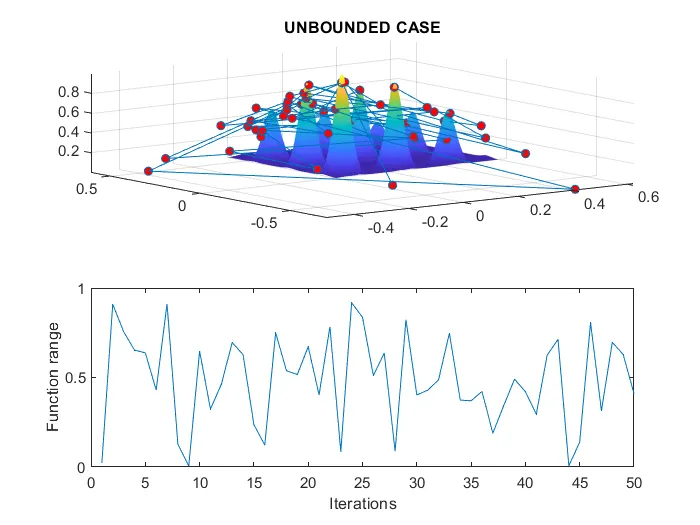
plot3(xopt,yopt,-fopt,'Marker','o','MarkerSize',4,'MarkerFaceColor','r');
title('UNBOUNDED CASE');
subplot(2,1,2)     %to creates plot in same figure window
plot(-fopt);       %plot for function maxima
xlabel('Iterations');
ylabel('Function range');

%--------------------------------------------------------------------------
%study 2 (BOUNDED CASE)
% with no constraints statstical behaviour
% with bound and upper bound

tic

for i=1:num_case
    [input_value,fopt(i)]=ga(@func_stalagmite,2,[],[],[],[],[0;0],[0.4;0.4]);
    %[0;0]-lower bound limits for x & y
    %[0.4;0.4]-upper bounded limits for x & y
    %[] empty bracket coz of no constrains

    xopt(i)=input_value(1);
    yopt(i)=input_value(2);
end

case_2_time=toc;

%Plotting
figure(2)
subplot(2,1,1)
surfc(xx,yy,-f);
shading interp
hold on
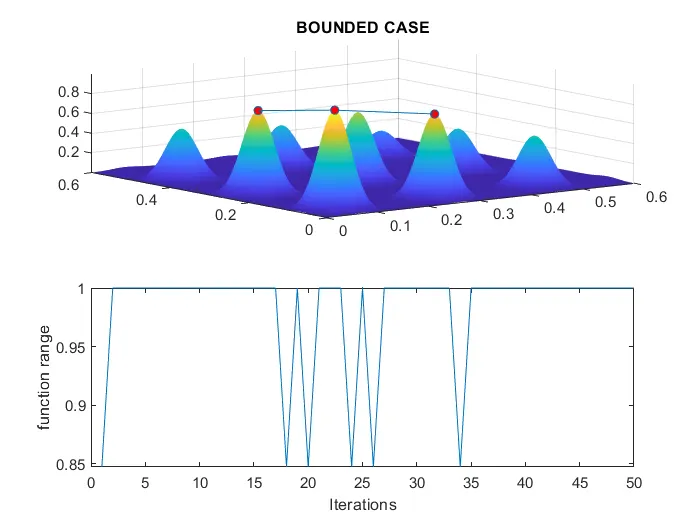
plot3(xopt,yopt,-fopt,'Marker','o','MarkerSize',4,'MarkerFaceColor','r');
title('BOUNDED CASE')
subplot(2,1,2)
plot(-fopt);
xlabel('Iterations');
ylabel('function range');

%------------------------------------------------------------------------------
% study 3 - (BUNDED CASE AND INCREASING POPULATION SIZE)
% with no linear ans non linear constraints statstical behaviour with lower bound and upper bound
options=optimoptions('ga');

%increasing population size by 200
options=optimoptions(options,'PopulationSize',200);

tic
for i=1:num_case
    [input_value,fopt(i)]=ga(@func_stalagmite,2,[],[],[],[],[0;0],[0.4;0.4],[],[],options);


    xopt(i)=input_value(1);
    yopt(i)=input_value(2);
end
case_3_time=toc;

%Plotting
figure(3)
subplot(2,1,1)
surfc(xx,yy,-f);
shading interp
hold on
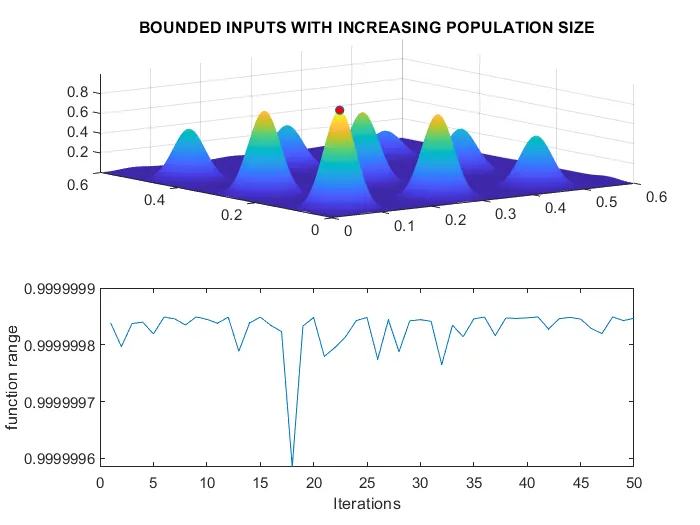
plot3(xopt,yopt,-fopt,'Marker','o','Markersize',4,'MarkerFaceColor','r');
title('BOUNDED INPUTS WITH INCREASING POPULATION SIZE');
subplot(2,1,2)
plot(-fopt);
xlabel('Iterations');
ylabel('function range');
PLOTS-
CASE-1 (unbounded )
case 2- (bounded case)
case 3- (bounded case with increase in population)
explanation-
cases involving in code
case 1- unbounded case for the 1st iteration
case2- bounded case for the 2nd iteration with Lower and Upper bounded conditions.
case3 - bounded case with increase in population
Thus this way, we studied the optimization of the genetic algorithm for the stalagmite
Written the code to find out maxima for the given function.
and successfully, we plot the graph for different cases.