Project 1 - Parsing NASA thermodynamic data
project:- file parsing for the NASA thermodynamic data
Aim:- Write a function that extracts the 14 coefficients and calculates the enthalpy, entropy and specific heats for all the species in the data file.
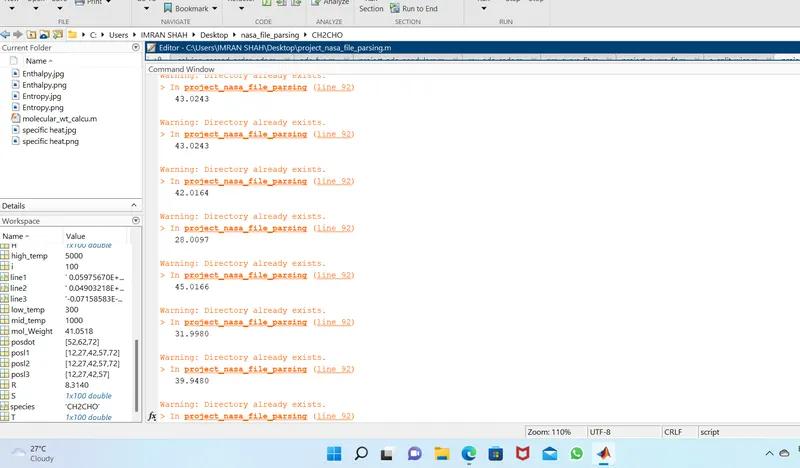
Objectives:- Calculate the molecular weight of each species and display it in the command window.
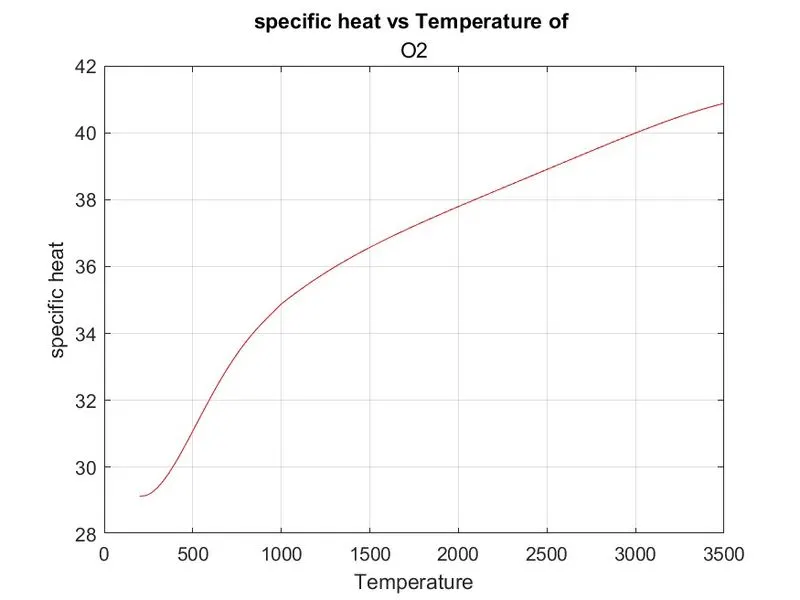
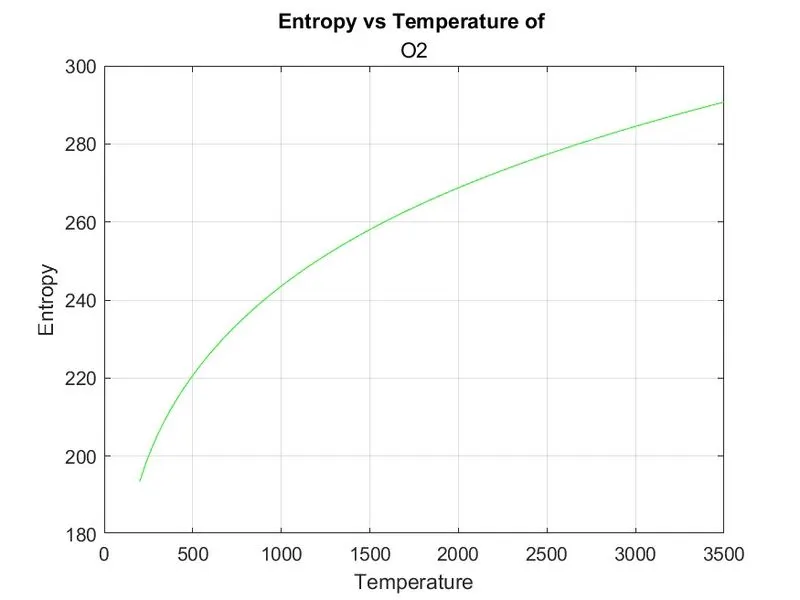
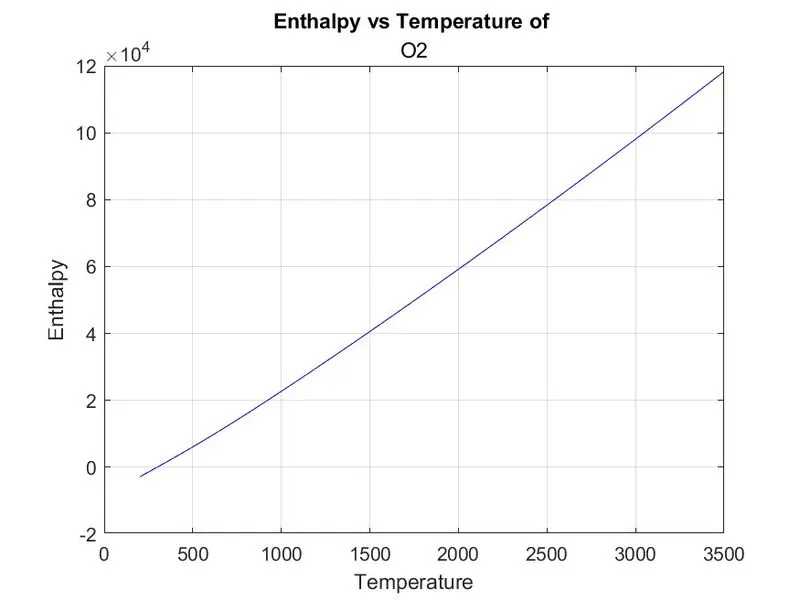
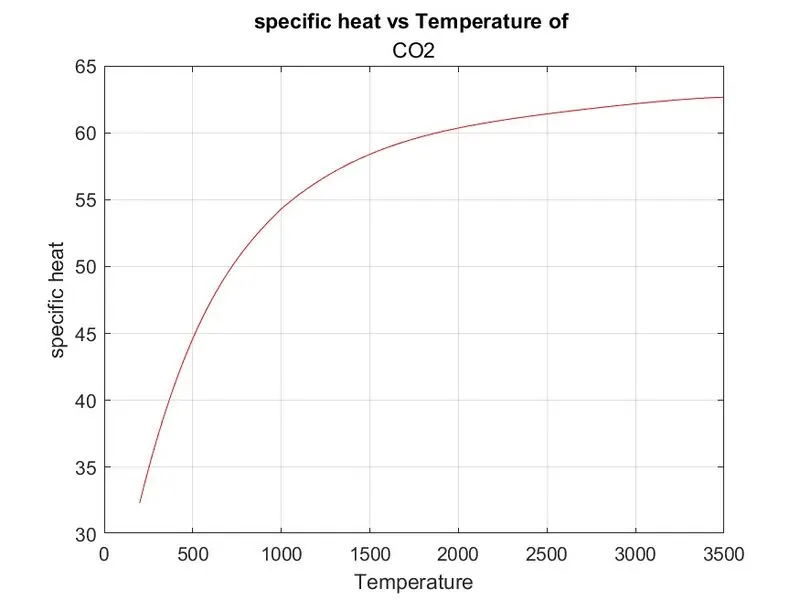
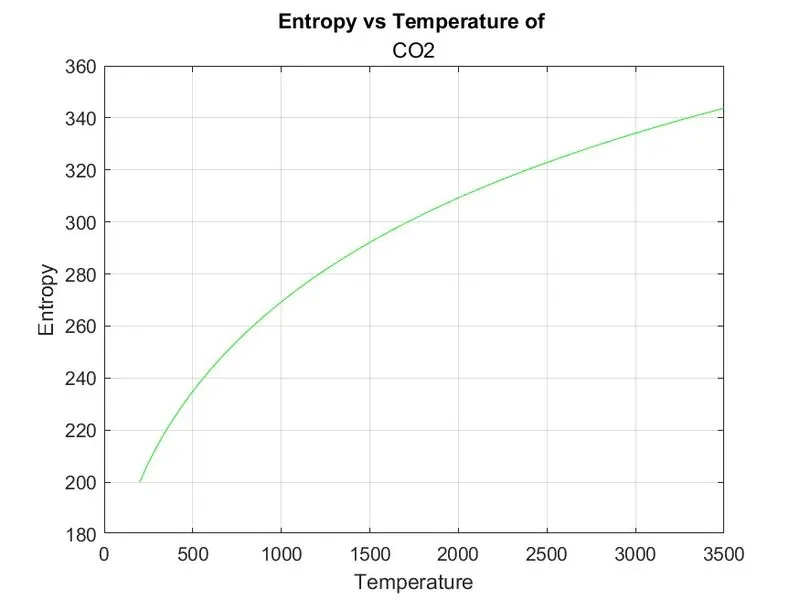
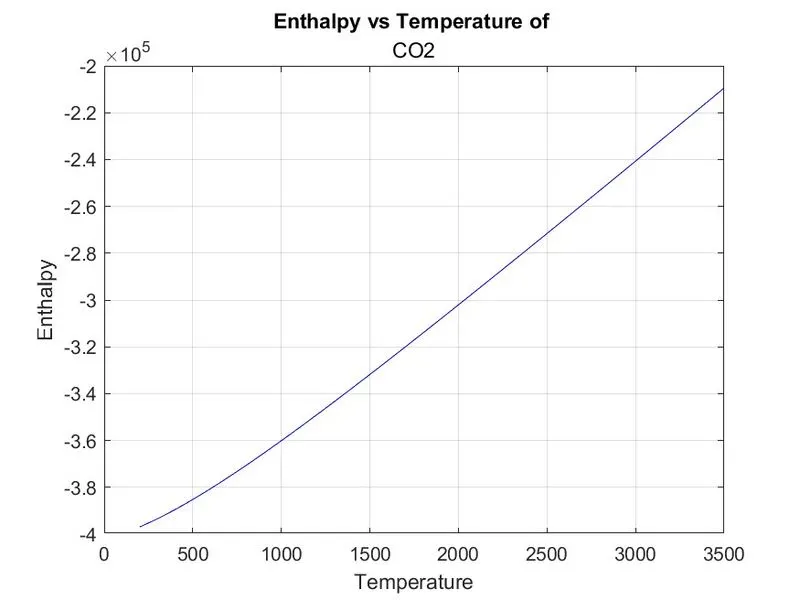
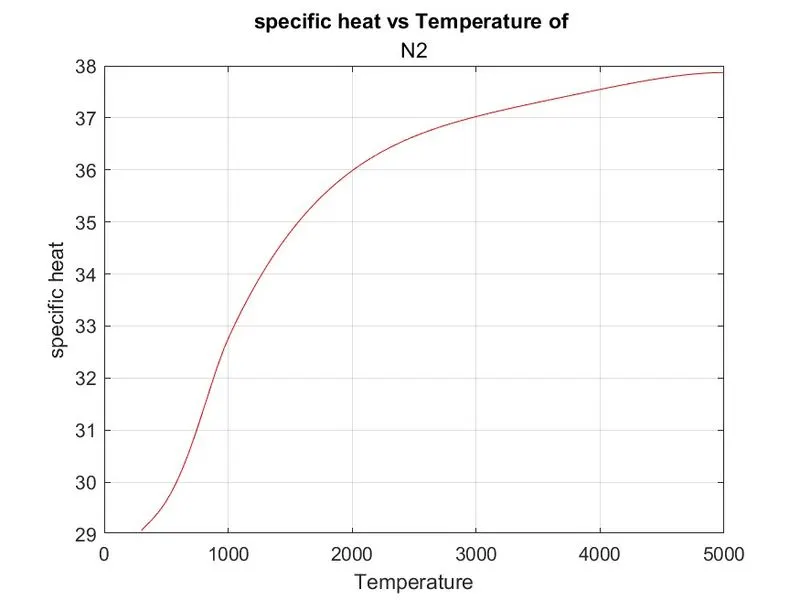
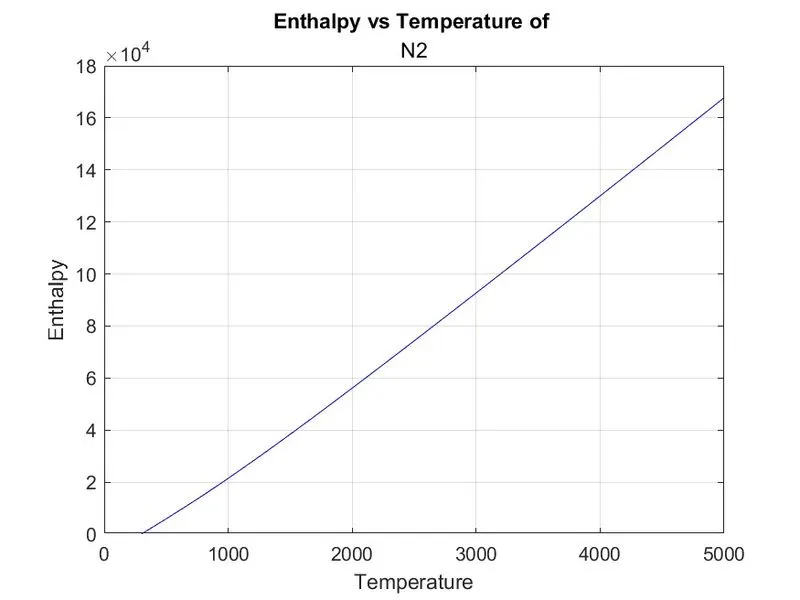
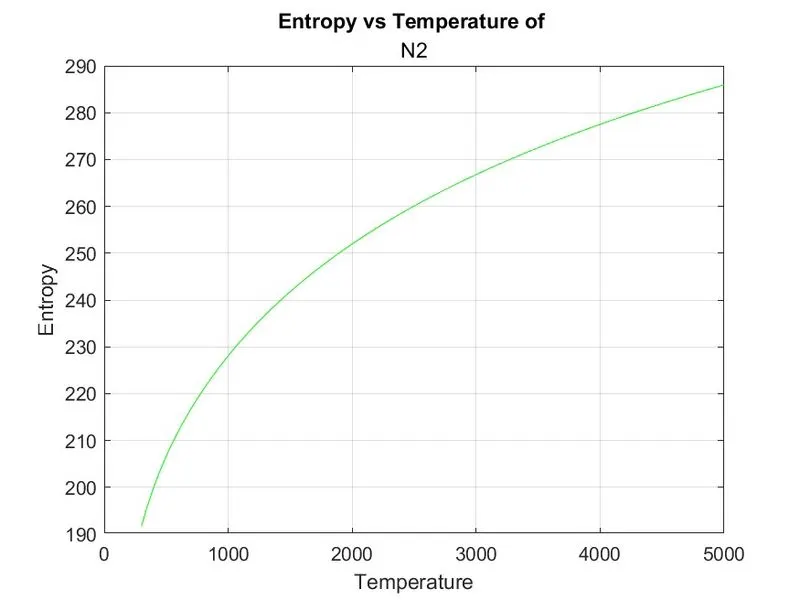
Plot the Cp, Enthalpy and Entropy for the local temperature range.
Save the plots as images with appropriate names and dump them in separate folders for each species with a suitable name. All these should be generated automatically.
Screenshot of the window where all the folders are saved.Plots for o2, N2 and Co2 species.
parsing means- It can be used to describe split or separation. Parsing a file means reading in a data stream of some sort and building an in memory model of the semantic content of that data. This aims at facilitating perfoming some kind of transformation on the data
T- is the range of local tempature.where,
a1-a7 is the range of local high temp. and
a8-a14 is the range of local low temp.
following eq. used to calculate the specific heat,enthalpy,and entropy
where R is the universal gas constant which is nothing but the 8.314
now, extract the data from these files and to find out the cp,h,s & molecular weight for each and every species mentioned in the data file.
MAIN-CODE
% PROJECT - NASA THEROMDYNAMIC FILE PARSING

clear all
close all
clc

%open the given file of nasa thermo
f=fopen('THERMO.dat','r')
fgetl(f)

%skip the first 4 line  after thermo
fgetl(f)
fgetl(f)
fgetl(f)
fgetl(f)

%insted of skip above 4 line you can use
%for i=4
%fgetl(f)
%end


for i = 1:53;   %for all species

    A= fgetl(f);
    b= strsplit(A,' ');
    species=b{1};

% LOCAL TEMPRATURE OF ELEMENT

posdot = strfind(A,'.');
low_temp = A(posdot(1)-3:posdot(1)+3);
low_temp = str2double(low_temp);

mid_temp = A(posdot(3)-4:posdot(3)+3);
mid_temp = str2double(mid_temp);

high_temp = A(posdot(2)-4:posdot(2)+3);
high_temp = str2double(high_temp);


% finding the coefficient for line1
line1= fgetl(f);
posl1= strfind(line1,'E');
a1= str2double(line1(1:posl1(1)+3));
a2= str2double(line1(posl1(1)+4:posl1(2)+3));
a3= str2double(line1(posl1(2)+4:posl1(3)+3));
a4= str2double(line1(posl1(3)+4:posl1(4)+3));
a5= str2double(line1(posl1(4)+4:posl1(5)+3));

% finding the coefficient for line2
line2= fgetl(f);
posl2= strfind(line2,'E');
a6= str2double(line2(1:posl2(1)+3));
a7= str2double(line2(posl2(1)+4:posl2(2)+3));
a8= str2double(line2(posl2(2)+4:posl2(3)+3));
a9= str2double(line2(posl2(3)+4:posl2(4)+3));
a10= str2double(line2(posl2(4)+4:posl2(5)+3));

% finding the coefficient for line3
line3= fgetl(f);
posl3= strfind(line3, 'E');
a11= str2double(line3(1:posl3(1)+3));
a12= str2double(line3(posl3(1)+4:posl3(2)+3));
a13= str2double(line3(posl3(2)+4:posl3(3)+3));
a14= str2double(line3(posl3(3)+4:posl3(4)+3));


%calculation for CP, H ,S
% by using given eqn or formulaes
% R= univarsal gas constant

T = linspace(low_temp,high_temp,100);
R= 8.314;
 for i=1:length(T)
     if T(i)>mid_temp
         cp(i)= R*(a1+a2.*T(i)+a3.*T(i).^2+a4.*T(i).^3+a5.*T(i).^4);
         H(i)= R*T(i).*(a1+((a2*T(i)/2))+((a3*T(i).^2)/3)+((a4*T(i).^3)/4)+((a5*T(i).^4)/5)+((a6./T(i))));
         S(i)= R*(a1.*log(T(i))+a2.*T(i)+a3.*(T(i)^2)/2+a4.*(T(i)^3)/3+a5.*(T(i)^4)/4+a7);
     else
         cp(i)= R*(a8+a9.*T(i)+a10.*T(i).^2+a11.*T(i).^3+a12.*T(i).^4);
         H(i)= R*T(i).*(a8+((a9*T(i)/2))+((a10*T(i).^2)/3)+((a11*T(i).^3)/4)+((a12*T(i).^4)/5)+((a13./T(i))));
         S(i)=R* (a8.*log(T(i))+a9.*T(i)+a10.*(T(i)^2)/2+a11.*(T(i)^3)/3+a12.*(T(i)^4)/4+a14);
     end
 end


% creating folders for the 53 element
 cd('C:\Users\IMRAN SHAH\Desktop\nasa_file_parsing')
mkdir(species);
cd(species);


% plot Specific heat vs Temperature
figure(1)
plot(T,cp,'Color','r')
xlabel('Temperature')
ylabel('specific heat')
grid on
title('specific heat vs Temperature of ', species)

% plot Enthalpy vs Temperature
figure(2)
plot(T,H,'Color','b')
xlabel('Temperature')
ylabel('Enthalpy')
grid on
title('Enthalpy vs Temperature of ', species)

% plot Entropy vs Temperature
figure(3)
plot(T,S,'Color','g')
xlabel('Temperature')
ylabel('Entropy')
grid on
title('Entropy vs Temperature of ', species)


% save the plot as images
 saveas(figure(1),'specific heat.jpg')
 saveas(figure(2),'Enthalpy.jpg')
 saveas(figure(3),'Entropy.jpg')


% molecular wt. calculation
% using function call for the molecular wt calculation

[mol_Weight] = mol_wt(species);
 sprintf('mol_Weight %s:%f',species,mol_Weight);
disp(mol_Weight)


end
FUNCTION CODE FOR THE MOLE.WT -
% CALLING FUNCTION TO CALCULATE THE MOLECULAR WEIGTH OF ALL SPECIES

function [mol_Weight]= mol_wt(species)
mol_Weight = 0;
elements=['H','C','N','O','A'];
atomic_weight= [1.0079 12.0107 15.999 14.0067 39.948];
for i= 1:length(species)
    for j=1:length(elements)
        if strcmpi(species(i),elements(j))
           mol_Weight=mol_Weight+atomic_weight(j);
            position=j;
        end
    end
    number = str2double(species(i));
    if (number>1)
        mol_Weight = mol_Weight + atomic_weight(position)*(number-1);
    end

end
end
explantion-
commands used to write a code
fopen- it open the file , it gives permission to read or write the given file.
fgetl- it shows each line when we write or read the file.
converts a character array or string scalar to a numeric matrix.
strsplit- it is used to split the string.
findstr- finds the starting indices of any occurrences of the shorter string within the longer.or find the string in the bunch of string.
mkdir- it stands for make a directory, it used to create the new folder.
cd- stands for changing the directory, it used to change the folder.
title- used to give a title to a plots.
saveas - it is used to save the figure with figure name and number in the particular folder.
start with the clear all, close all and clc, first open the given file by using fopen command. r is for the reading purpose.
read the each line with the help of fgetl, skip first 5 line that are not necessary.
use for loop for the all species/element given in the file.
read all the given temperatures, and separate them into low,mid,and high categories. eliminate the space between data and convert this data into 14 coefficients for each element.
after, getting all 14 element , calculate the values of specific heat (cp), enthalpy(h), entropy(s). by using the range of temperature from higher to lower. used 'linspace' command for it. compare this temp.range with respect to mid temp. used if else loop for calculating the cp,h,s values.
take R is as univarsal gas constant.
after calculation,
we have to make a separate folder to store the plots for each element, used ''mkdir and cd" command. in this copy the storage path of the new folder , save the folder with a particular name.
now plots all the graph for the each 53 elements.apply labels and titles to them.
now , save ths plots in the respective folder,by using "saveas" command. with fig. umber and name.
now write a function code for the calculation of molecular weight, for each element. save its file name as a function name. and use "disp" command to display the molecular wt.
PLOTS ANS SCREENSHOTS:-