Week 4.1 - Genetic Algorithm
AIM:
Write a code in MATLAB to optimise the stalagmite function and find the global maxima of the function.
Clearly expalin the concept of genetic algorithm in your own words and also explain the syntax for ga in MATLAB in your report.
Make sure that your code gives the same output, even if it is made to run several times.
Plot graphs for all 3 studies and for F maximum vs no. of iterations. Title and axes labels are a must, legends could be shown if necessary.
- Stalagmite Function is a function to determine global min and global max. By that we can get lot of things like mainly its use to genrate the population in future years. Stalagmite structures are formed from the cave floor that point upward.
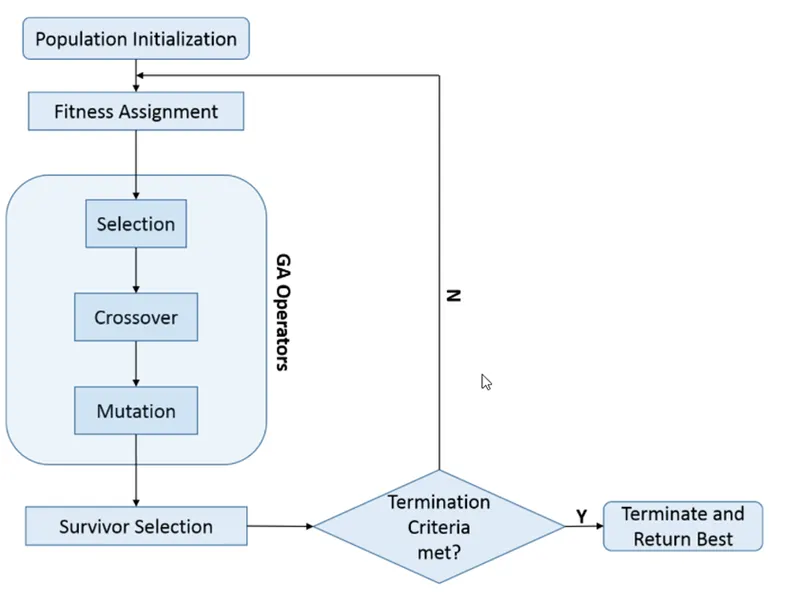
- The below format is the structure to get the global max and min.
GA:
GA is one of the optimization processes. the first time proposed by CHARLES DARVIN, the idea behind the ga is to calculate/predict the next generation or population using the iterative method till the optimum or a satisfactory result is found
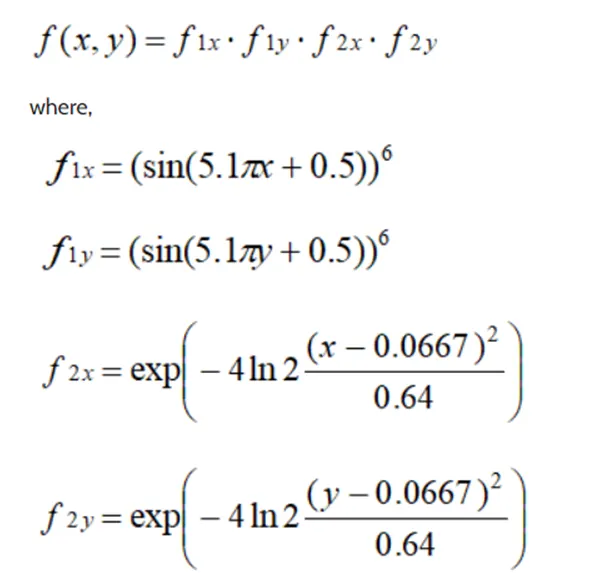
The stalagmite function is defined as below mentioned equation
- The below syntaxes have been used to solve the ga function
1 . x = ga(fun,nvars) finds a local unconstrained minimum, x, to the objective function, fun. nvars is the dimension (number of design variables) of fun.
- x = ga(fun,nvars,A,b,Aeq,beq,lb,ub) defines a set of lower and upper bounds on the design variables, x, so that a solution is found in the range lb ≤ x ≤ ub. (Set Aeq=[] and beq=[] if no linear equalities exist.)
- x = ga(fun,nvars,A,b,Aeq,beq,lb,ub,nonlcon,options) minimizes with the default optimization parameters replaced by values in options. (Set nonlcon=[] if no nonlinear constraints exist.) Create options using optimoptions.
% stalagmite function code :
function f = stalagmite(input_vector)

f1x = (sin(5.1*pi*input_vector(1)+0.5))^6;
f2x = exp(-4*log(2)*((input_vector(1)-0.0667)^2/0.64));
f1y = (sin(5.1*pi*input_vector(2)+0.5))^6;
f2y = exp(-4*log(2)*((input_vector(2)-0.0667)^2/0.64));
f = f1x*f2x*f1y*f2y;
end
% GA main code
clear all
close all
clc

% input 1d array
x=linspace(0,1,150);
y=linspace(0,1,150);

% 2d array meshgrid
[xx,yy]=meshgrid(x,y);

% evaluating the function
for i=1:length(xx);
  for  j=1:length(yy);
    input_vector(1)=xx(i,j);
    input_vector(2)=yy(i,j);
 f(i,j)=stalagmite(input_vector);
end
end

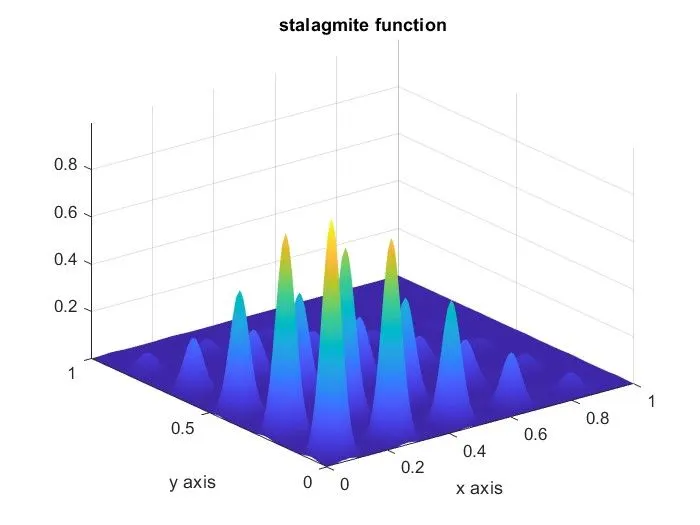
surfc(xx,yy,f)
shading interp
xlabel('x axis')
ylabel('y axis')
title('stalagmite function')
see above plot for local minima.
Next, we can find the global maxima. we will change nagative sign for stalagmite function code.
function f = stalagmite(input_vector)

f1x = (sin(5.1*pi*input_vector(1)+0.5))^6;
f2x = exp(-4*log(2)*((input_vector(1)-0.0667)^2/0.64));
f1y = (sin(5.1*pi*input_vector(2)+0.5))^6;
f2y = exp(-4*log(2)*((input_vector(2)-0.0667)^2/0.64));
f = -f1x*f2x*f1y*f2y;
end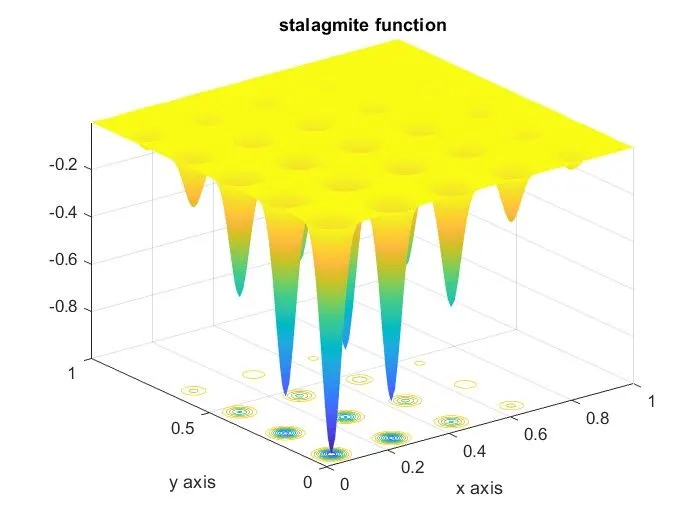
To create a program using ga for optimum solution of the population num_cases = 100, so the program will be in 3 parts-
study1,
study2,
and study3 to get the best optimum solution, we know that the ga work on random sampling so setting the limit and narrowing the search area od ga to get the same answer everytime when executed. How for that please check below.
% STUDY 1
tic
% study case stastistical behaivoir unbounded
num_cases=100;
for i=1:num_cases;
    [inputs, fopt(i)]= ga(@stalagmite,2);
xopt(i)=inputs(1);
yopt(i)=inputs(2);
end

study1_time=toc

figure(2)
subplot(2,1,1);
hold on
surfc(x,y,f);
shading interp;
plot3(xopt,yopt,fopt,'marker','+','MarkerSize',6,'MarkerFaceColor','b');
subplot(2,1,2);
plot(fopt);
title('unbounded inputs');
xlabel('ittrations')
ylabel('function max')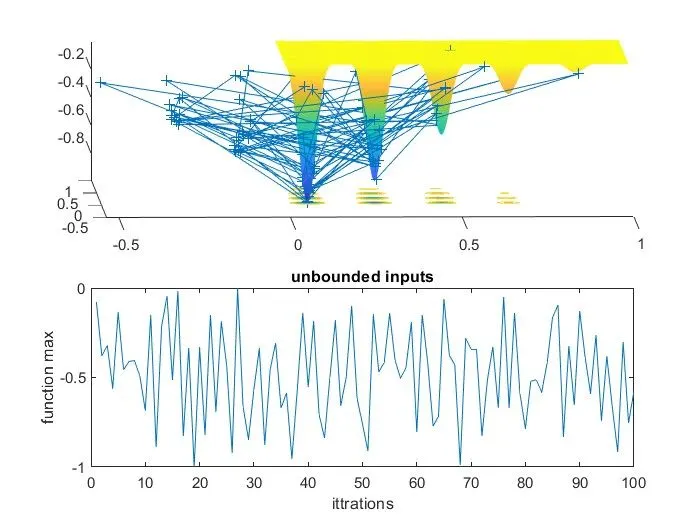
study time 1= 7.0243 sec. this time time will change, when i am run the code.
% study case stastistical behaivoir  bounded - upeer and lower value

num_cases=100;
for i=1:num_cases;
    [inputs, fopt(i)]= ga(@stalagmite,2,[],[],[],[],[0;0],[0.8;0.8]);
xopt(i)=inputs(1);
yopt(i)=inputs(2);
end

study2_time=toc

figure(3)
subplot(2,1,1);
hold on
surfc(x,y,f);
shading interp;
plot3(xopt,yopt,fopt,'marker','+','MarkerSize',6,'MarkerFaceColor','b');
subplot(2,1,2);
plot(fopt);
title('unbounded inputs');
xlabel('ittrations')
ylabel('function max')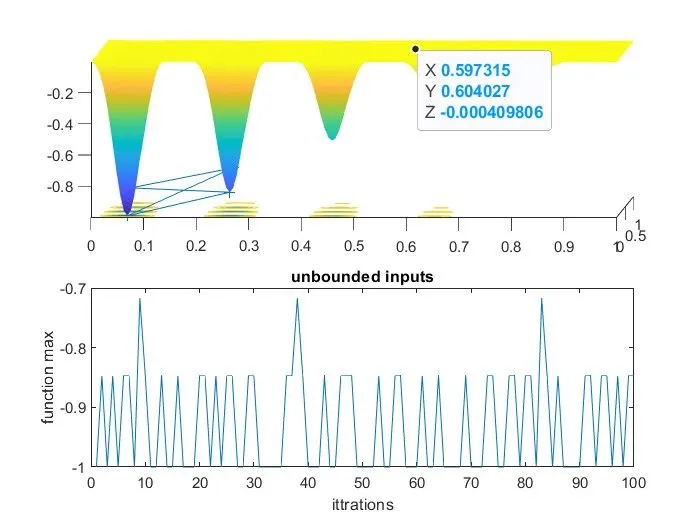
Study time 2 = 18.00sec, the plot is now narrowed as compared to the figure (2) and the optimum solution is might come in 0.7 to 0.9 but still we will get different output on execution. by setting up the lower and upper bound the result is near to best which means we are in the right direction.
what if increasing the population number and in a certain limit of ga, will give an exact answer, let check this also in study 3
% study 3 papulation ga increase
options=optimoptions('ga')
options=optimoptions(options,'PopulationSize',50)

num_cases=100;
for i=1:num_cases;
    [inputs, fopt(i)]= ga(@stalagmite,2,[],[],[],[],[0;0],[0.8;0.8],[],[],options);
xopt(i)=inputs(1);
yopt(i)=inputs(2);
end

study3_time=toc

figure(4)
subplot(2,1,1);
hold on
surfc(x,y,f);
shading interp;
plot3(xopt,yopt,fopt,'marker','+','MarkerSize',6,'MarkerFaceColor','b');
subplot(2,1,2);
plot(fopt);
title('unbounded inputs');
xlabel('ittrations')
ylabel('function max')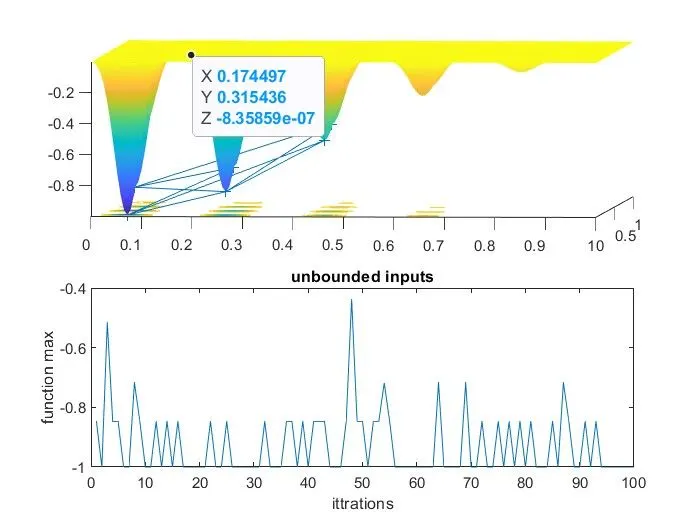
The above graph gives us the required maxima value by using ga.
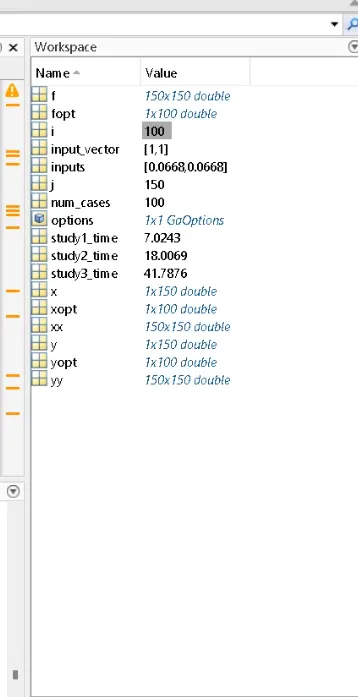
study time 3 = 41.787sec this 5 times in study 1 time.
ERROR :
I got minor error, during this program let's see this below,
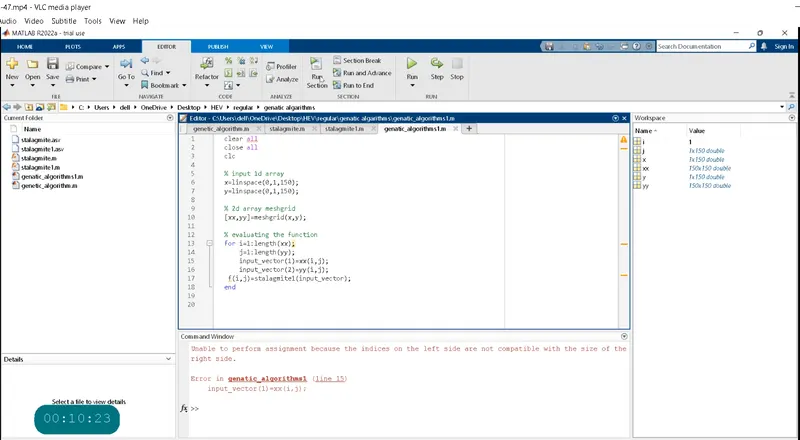
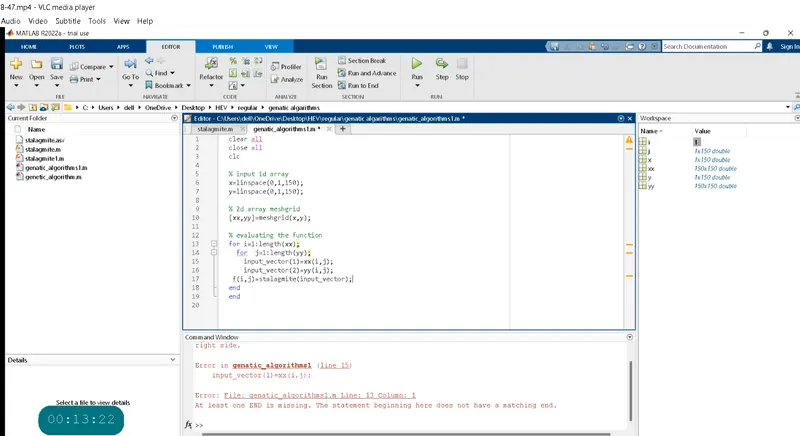
when i use for loop function must put for and end,
i missed starting for command.
i missed starting end command
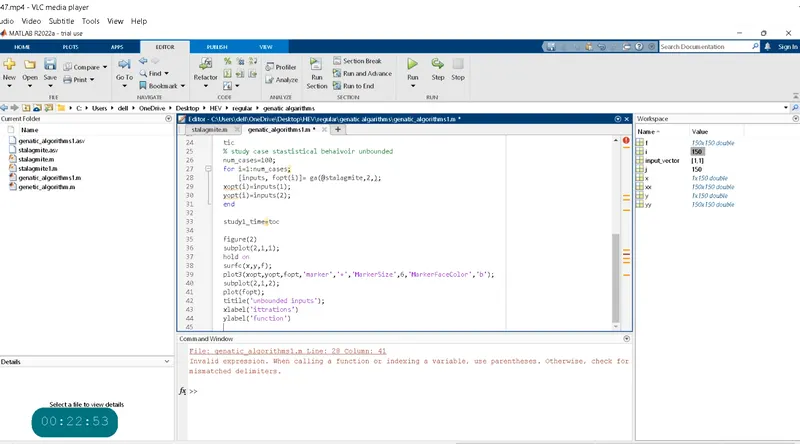
line no 28, func i will remove (,) after variable 2. when i close the function no put other additon.
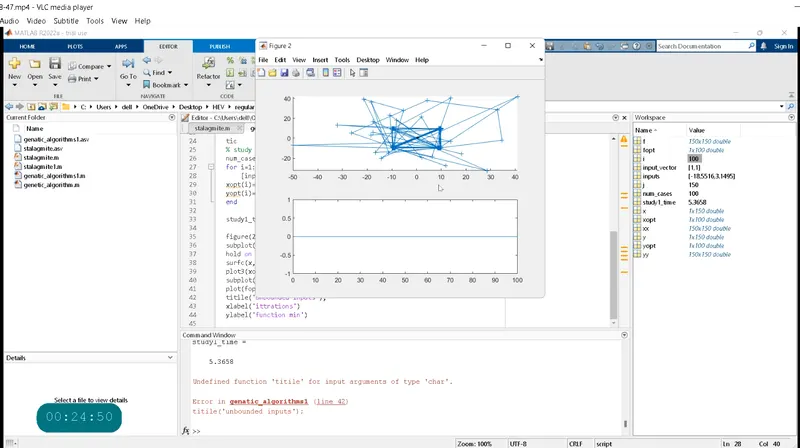
titile mistake.
CONCUSON:
We are getting results for glbal maxima using the GA optimazation.
https://drive.google.com/file/d/1SquZVXaHW_765kkN79Rlvf6BFKIw1caI/view?usp=sharing