Week 4.1 - Genetic Algorithm
Objective:
- To write a code in MATLAB to optimize the stalagmite function and find the global maxima of the function.
- explain the concept of genetic algorithm in your own words and also explain the syntax for ga in MATLAB in your report.
- Plot graphs for all 3 studies and for F maximum vs no. of iterations.
Theory:
The genetic algorithm GA is a method for the finding of the maximum and minimum values of the function.GA repeatedly modifies the population of individual solutions
At each step, the ga selects the individual at random from the current to be parents and uses them to produce children for the next generation. Over successive generations, the population evolves towards an optimal solution.
GA can be applied to solve a variety of optimization problems that are not well suited for standard optimization algorithms, including problems in which the objective function is discontinuous, non-differentiable, highly non-linear.
Function for the problem:
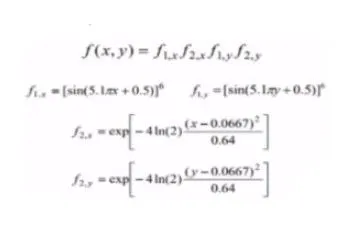
Code for stalagmite function:
function [f] = stalagmite1(input_vector)

x = input_vector(1);
y = input_vector(2);

f1x = (sin((5.1*pi*x)+0.5))^6;
f1y = (sin((5.1*pi*y)+0.5))^6;

f2x = exp(-4*log(2)*(((x-0.0667)^2)/0.64));
f2y = exp(-4*log(2)*(((y-0.0667)^2)/0.64));
f = (f1x*f1y*f2x*f2y);

end
Explanation:
- create a function named stalagmite for the function of problem.
- put x and y as input_vector(1),input_vector(2) which will get from the main coding.
- put values of x and y in the given function f1x,f1y,f2x,f2y.
Code for main problem with three case study:
clear all
close all
clc

x = linspace(0,0.6,150);
y = linspace(0,0.6,150);
num_cases = 50;

[xx,yy] = meshgrid(x,y);

for i = 1:length(xx)% takes values until length of xx
      for j = 1:length(yy)% takes values until length of xx
          inputs(1) = xx(i,j);
          inputs(2) = yy(i,j);
          f(i,j) = stalagmite1(inputs);
      end
end

figure(1)
surfc(xx,yy,f)

shading interp

% study case


tic;

% study1- statistical behavior

for i = 1:num_cases
    [inputs,fopt(i)]=ga(@stalagmite1,2);
    xopt(i) = inputs(1);
    yopt(i) = inputs(2);
end

study1_time = toc;

figure(2)
subplot(2,1,1);
hold on
surfc(x,y,-f);
shading interp
plot3(xopt,yopt,-fopt,'marker','o','markersize',5,'markerfacecolor','r');
title('unbounded inputs');
subplot(2,1,2);
plot(-fopt);
xlabel('iteration');
ylabel('Function minimum');

% study2- statistical behaviour with upper and lower bounds

tic;
for i = 1:num_cases
    [inputs,fopt(i)]=ga(@stalagmite1,2,[],[],[],[],[0;0],[1;1]);
    xopt(i) = inputs(1);
    yopt(i) = inputs(2);
end

study2_time = toc;

figure(3)
subplot(2,1,1);
hold on
surfc(x,y,-f);
shading interp
plot3(xopt,yopt,-fopt,'marker','o','markersize',5,'markerfacecolor','r');
title('bounded inputs');
subplot(2,1,2);
plot(-fopt);
xlabel('iteration');
ylabel('Function minimum');

% study3- increasing GA iterations
options = optimoptions('ga');
options = optimoptions(options,'populationsize',170);


tic;
for i = 1:num_cases
    [inputs,fopt(i)]=ga(@stalagmite1,2,[],[],[],[],[0;0],[1;1],[],[],options);
    xopt(i) = inputs(1);
    yopt(i) = inputs(2);
end

study3_time = toc;

figure(4)
subplot(2,1,1);
hold on
surfc(x,y,-f);
shading interp
plot3(xopt,yopt,-fopt,'marker','o','markersize',5,'markerfacecolor','r');
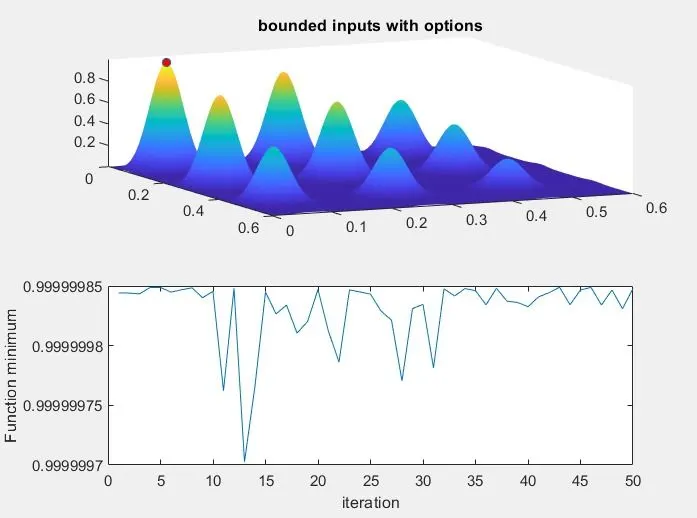
title('bounded inputs with options');
subplot(2,1,2);
plot(-fopt);
xlabel('iteration');
ylabel('Function minimum');
Explanation:
- set the values of x and y from 0 to 0.6 using linspace command.
- make 2D array using meshgrid command.
- create a for-loop for stalagmite function.
- use surfc coomand to make a 3d plot.
- Syntax of GA is ga(@functionhandle,n), where n is no. of input variables.
Plot:
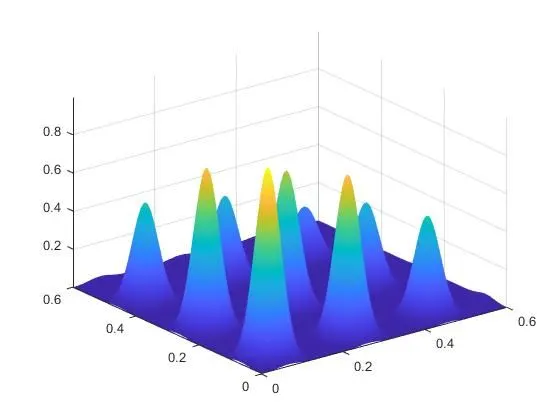
study1-case:
- create a for-loop for num_cases for GA, i.e GA will repeatedlly play for 50 times.
- find out xopt,yopt,fopt for every GA.
- use tic,toc command for execution of study1-case.
- make subplot for optimum values of x,y and function.
- this case is for unbounded inputs, so we get many values for x,y and function.
- from this case we did not get accurate value of global maxima of the fucntion.
- here syntax of GA is ga(@function handle,n), where n is no. of input variables.
Plot:
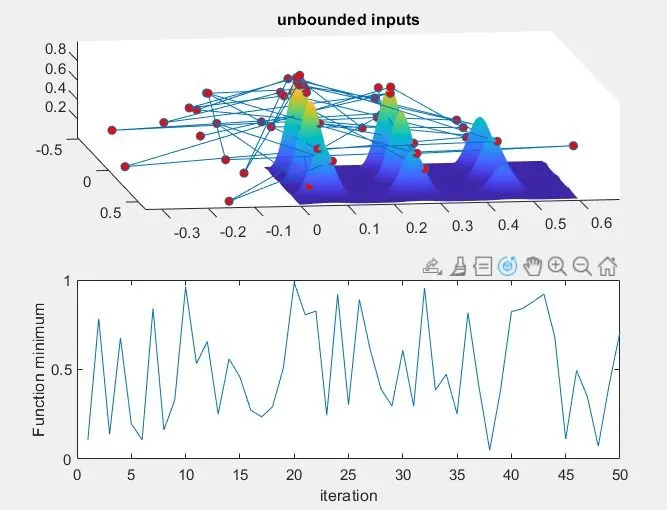
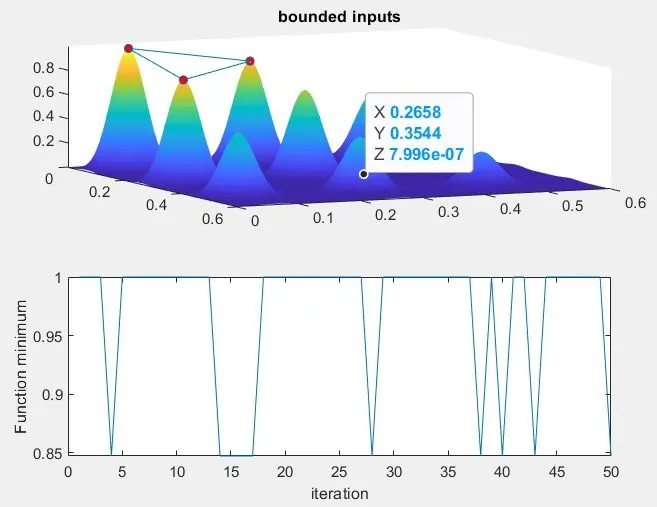
Study2-case:
- create for-loop for stastical behaviour for lower bounds and uper boundes of the function with same num_cases.
- Syntax of GA is ga(@function handle,n,A,B,Aeq,Beq,lb,ub), where A,B are linear inequalities. Aeq,Beq are linear equalities. lb,up are lower and uper limits for a fucntion for getting optimum values.
- we got better result then case1 but not so much satisfied as we want, so we will increase the no. of GA iterations.
Plot:
study3-case:
- create for-loop for increase no. of GA iteration.
- create options variable for GA using optimoption command.
- here syntax of GA is ga(@function handle,n,A,B,Aeq,Beq,lb,ub,option), where option will give us more no. of iterations.
- we got accurate value for global maxima of the function.
Plot: