Project 1 - Parsing NASA thermodynamic data
AIM:
To write a code for parse nasa thermodynamic data file and then calculate the thermodynamic properties for various gas species.
Objective:
- Write a function that extracts the 14 coefficients and calculates the enthalpy, entropy, and specific heats for all the species in the data file
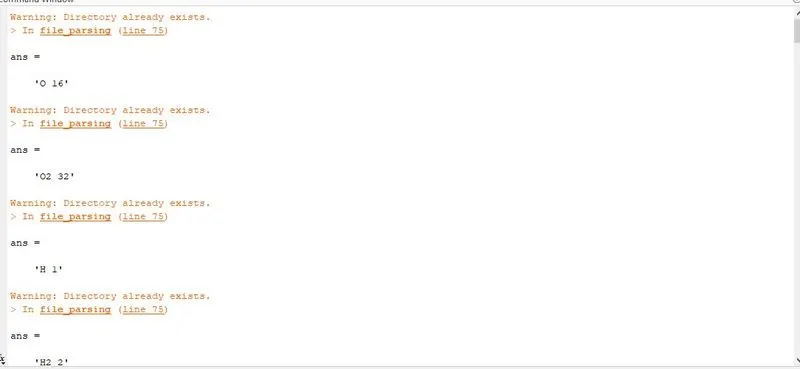
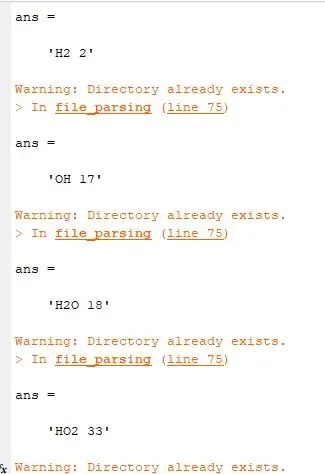
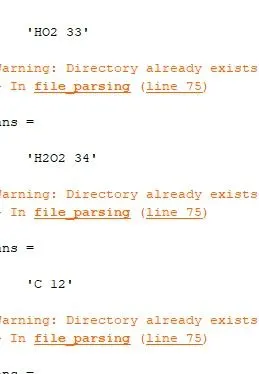
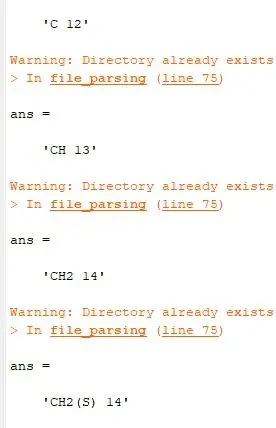
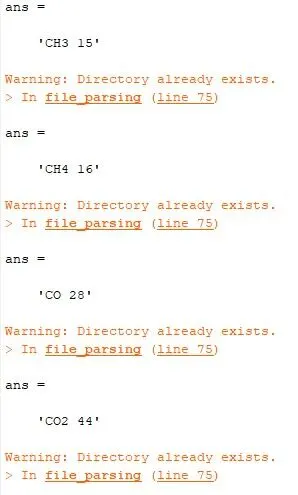
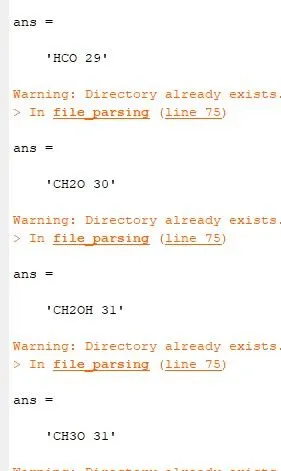
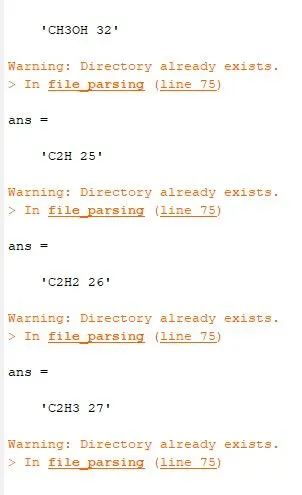
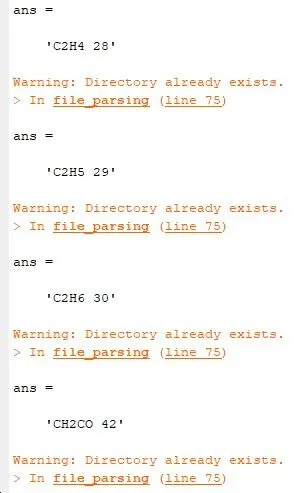
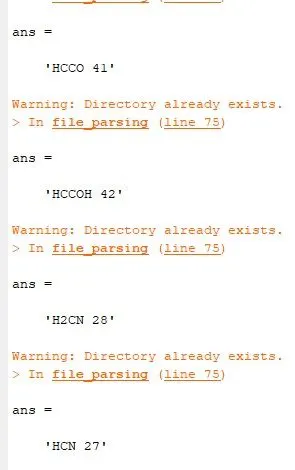
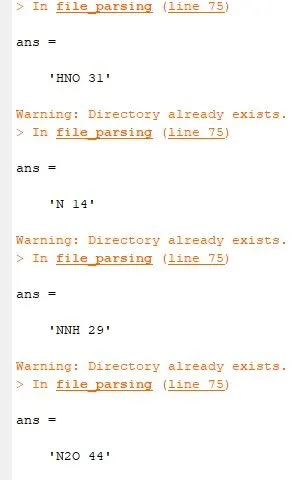
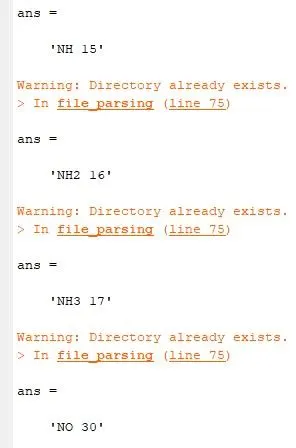
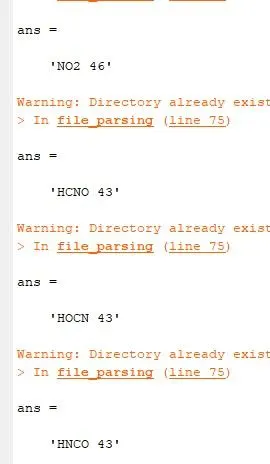
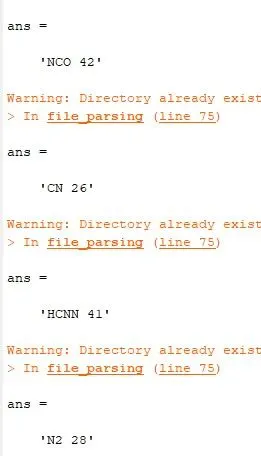
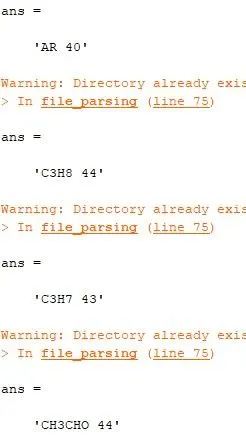
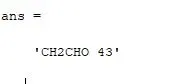
- Calculate the molecular weight of each species and display it in the command window.
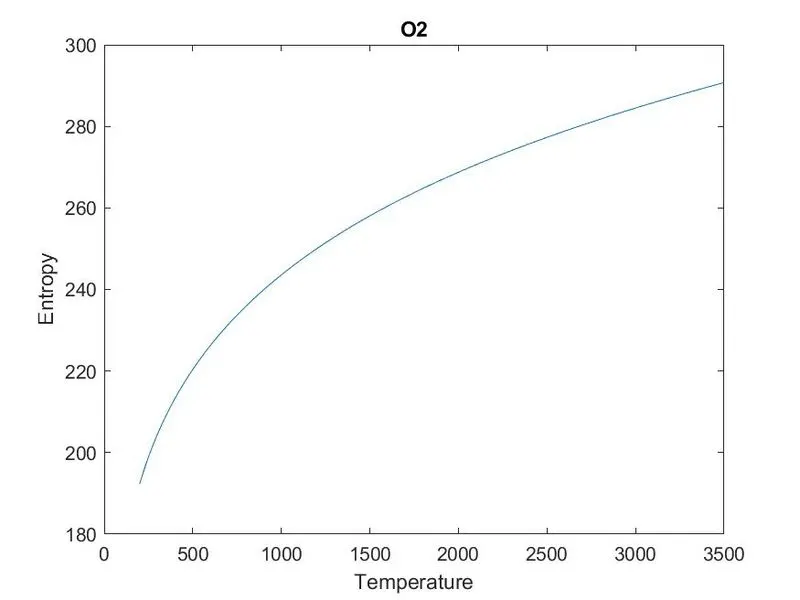
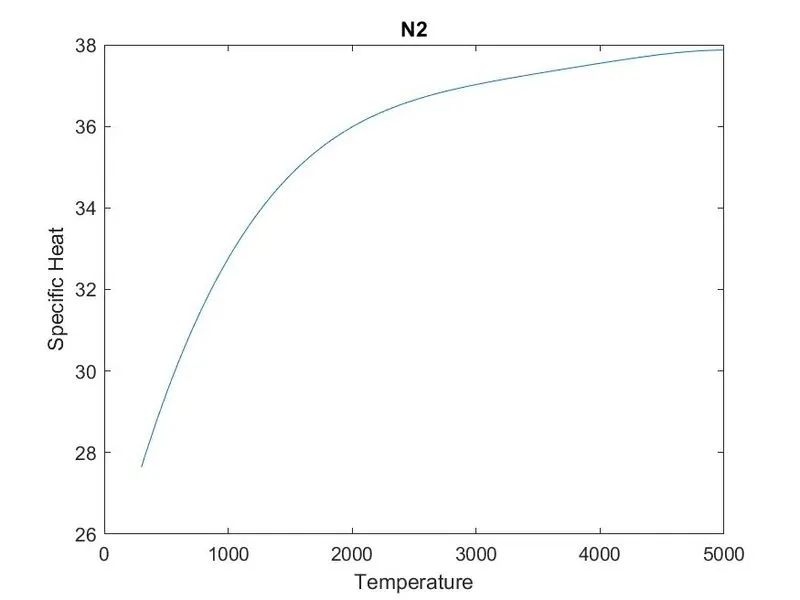
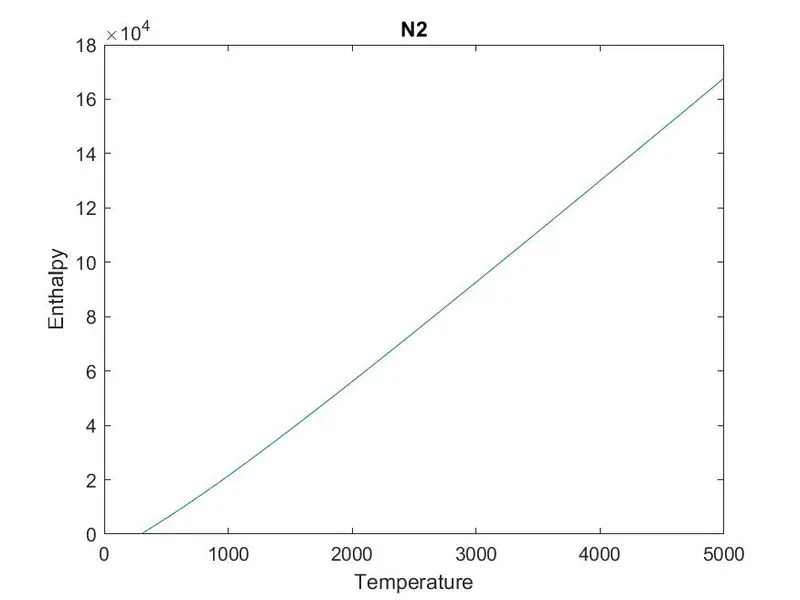
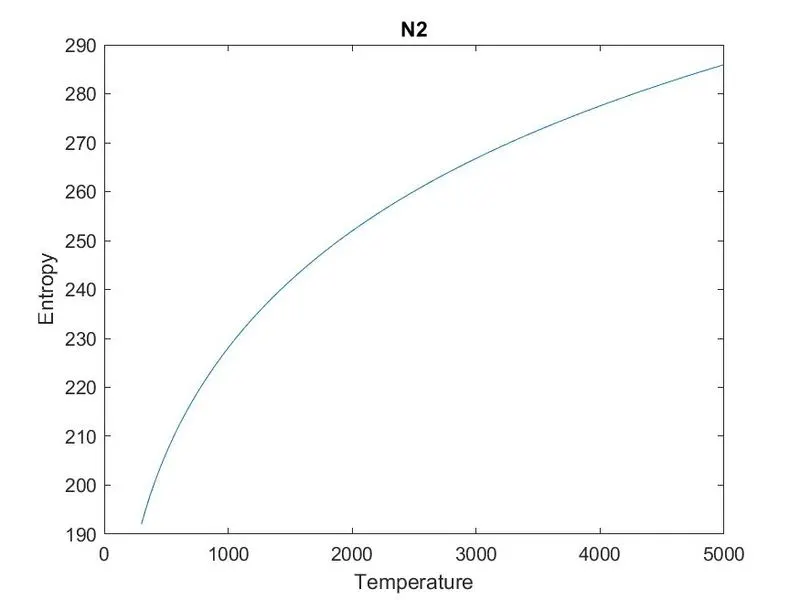
- Plot the Cp, Enthalpy, and Entropy for the local temperature range (low temperature: high temperature) specific for each species.
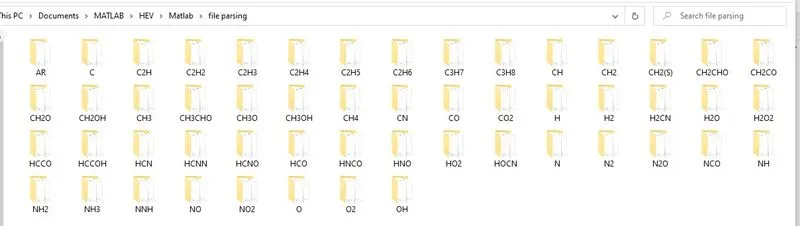
- Save the plots as images with appropriate names and dump them in separate folders for each species with a suitable name. All these should be generated automatically.
- The main program that you will submit will just take the "THERMO.dat" file as an input and generate Cp, H, and S plots.
Theory:
File Parsing: Parsing a file means splitting a file or other input into a piece of data that can easily be stored or manipulated. we are splitting a string into parts then recognize the parts to convert it into something simpler than a string.
Enthalpy: A thermodynamic quantity equivalent to the total heat content of the system, i.e sum of internal energy and the product of pressure and volume for the system.
Entropy: A thermodynamic quantity representing the unavailability of a system's thermal energy for conversion into mechanical work, often interpreted as the degree of disorder or randomness in the system.
Specific Heat: The heat required to raise the temperature of the unit mass of a given substance by a given amount (usually one degree).
Molecular Weight: The ratio of the average mass of one molecule of an element or compound to one-twelfth of the mass of an atom of carbon-12.
Given equations for H, S, Cp:
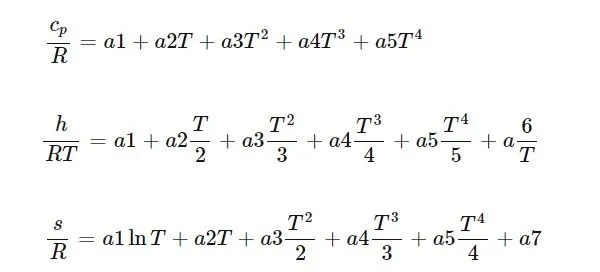
where,
Cp is specific heat.
h is specific enthalpy.
s is specific entropy.
R is the universal gas constant.
T is the temperature in kelvin.
Coding for file parsing:
close all
clear all
clc

% file reading
f1 = fopen('THERMO.dat','r');
tline = fgetl(f1);
tline = fgetl(f1);
A = strsplit(tline,' ');
global_min_temp = str2double(A{2});
global_mid_temp = str2double(A{3});
global_max_temp = str2double(A{4});

% skip next three comments
for i = 1:3
    tline1 = fgetl(f1);
end

% reading the data
for j = 1:53 %loop for all element blocks

    header_line = fgetl(f1);
    a = strsplit(header_line,' ');
    species_name = a{1};
    B = strfind(header_line, 'G');
    temp_values = header_line(B+4:length(header_line)-5);
    C = strsplit(temp_values,' ');
    local_low_temp = str2double(C{1});
    local_mid_temp = str2double(C{3});
     local_high_temp = str2double(C{2});


     tline2 = fgetl(f1);
     D = strfind(tline2,'E');
     a1 = str2double(tline2(1:D(1)+3));
     a2 = str2double(tline2(D(1)+4:D(2)+3));
     a3 = str2double(tline2(D(2)+4:D(3)+3));
     a4 = str2double(tline2(D(3)+4:D(4)+3));
     a5 = str2double(tline2(D(4)+4:D(5)+3));

     tline3 = fgetl(f1);
     F = strfind(tline3,'E');
     a6 = str2double(tline3(1:F(1)+3));
     a7 = str2double(tline3(F(1)+4:F(2)+3));
     a8 = str2double(tline3(F(2)+4:F(3)+3));
     a9 = str2double(tline3(F(3)+4:D(4)+3));
     a10 = str2double(tline3(F(4)+4:F(5)+3));

      tline4 = fgetl(f1);
      G = strfind(tline4,'E');
      a11 = str2double(tline4(1:G(1)+3));
      a12 = str2double(tline4(G(1)+4:G(2)+3));
      a13 = str2double(tline4(G(2)+4:G(3)+3));
      a14 = str2double(tline4(G(3)+4:G(4)+3));

      T =linspace(local_low_temp,local_high_temp,500);
      R = 8.314;
for k = 1:length(T)

    if (T(k)>= local_mid_temp)
        Cp = (a1+a2.*T+a3.*T.^2+a4.*T.^3+a5.*T.^4)*R;
        H = (a1+((a2.*T)/2)+((a3.*T.^2)/3)+((a4.*T.^3)/4)+((a5.*T.^4)/5)+a6./T).*(R.*T);
        S = ((a1*log(T)+a2.*T)+((a3.*T.^2)/2)+((a4.*T.^3)/3)+((a5.*T.^4)/4)+a7)*R;
    else
        Cp = (a8+a9.*T+a10.*T.^2+a11.*T.^3+a12.*T.^4)*R;
        H = (a8+((a9.*T)/2)+((a10.*T.^2)/3)+((a11.*T.^3)/4)+((a12.*T.^4)/5)+a13./T).*(R.*T);
        S = ((a8*log(T)+a9.*T)+((a10.*T.^2)/2)+((a11.*T.^3)/3)+((a12.*T.^4)/4)+a14)*R;


    end


end
      % create new folder
     mkdir(['C:\Users\DELL\Documents\MATLAB\HEV\Matlab\file parsing\',species_name]);

     % plots for all species

      figure(1);
      plot(T,Cp);
      title('specific heat');
      xlabel('Temperature');
      ylabel('Specific Heat');
      title(species_name)


       figure(2);
      plot(T,H);
      title('Enthalpy');
      xlabel('Temperature');
      ylabel('Enthalpy');
      title(species_name)


      figure(3);
      plot(T,S);
      title('Entropy');
      xlabel('Temperature');
      ylabel('Entropy');
       title(species_name)

      cd(['C:\Users\DELL\Documents\MATLAB\HEV\Matlab\file parsing\',species_name]);

      saveas(1,'Cp vs T.jpg')
      saveas(2,'H vs T.jpg')
      saveas(3,'S vs T.jpg')

% calculating molecular mass

 atomic_mass = [1 12 14 16 40];
 elements = ['H','C','N','O','A'];
  molecular_weight = 0;
 for l = 1:length(species_name)
     for m = 1:length(elements)
         if strcmpi(species_name(l),elements(m))
     molecular_weight = molecular_weight+atomic_mass(m);
     z = m;
         end
     end

 t = str2double(species_name(i));
if (t>1)

      molecular_weight = molecular_weight+(atomic_mass(z)*(t-1));

 end
 end
sprintf( '%s %d',species_name,molecular_weight)
end
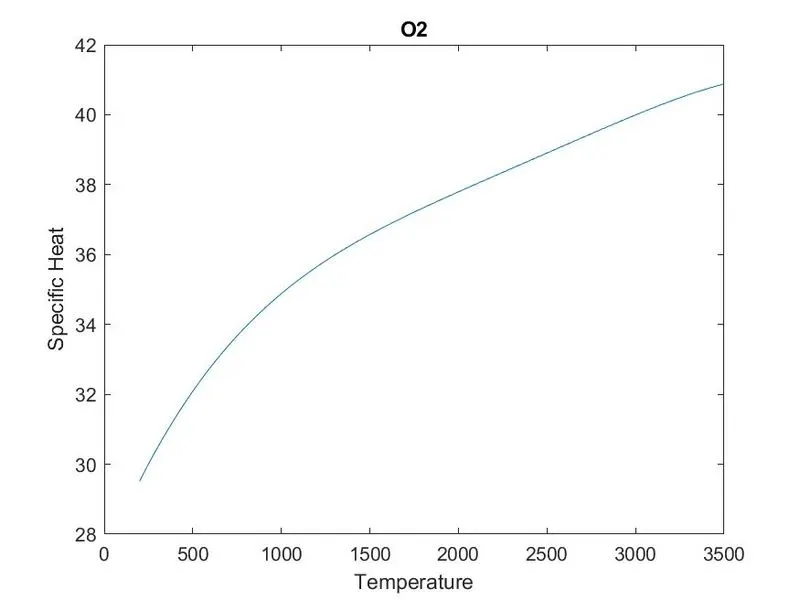
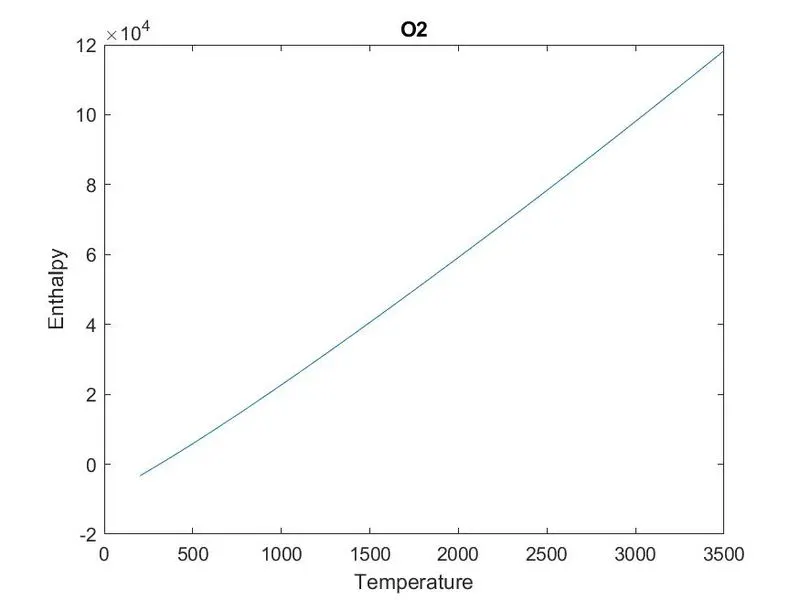
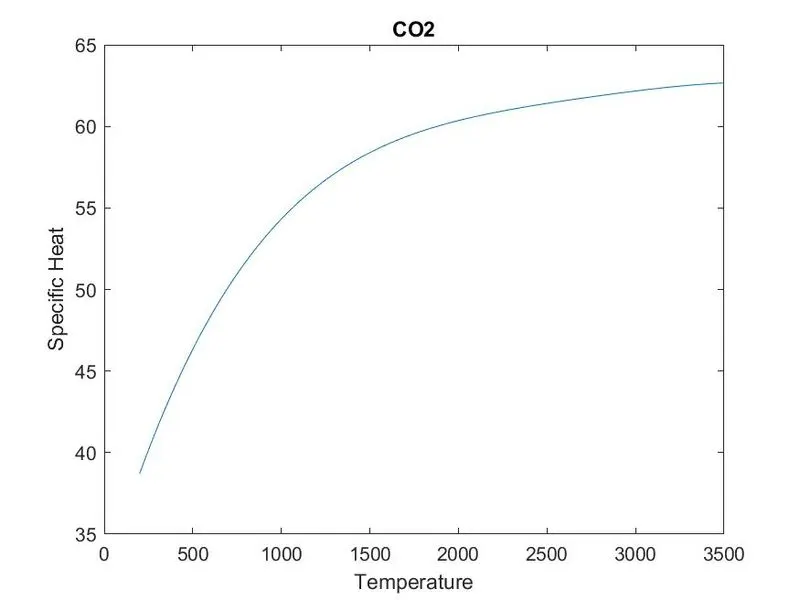
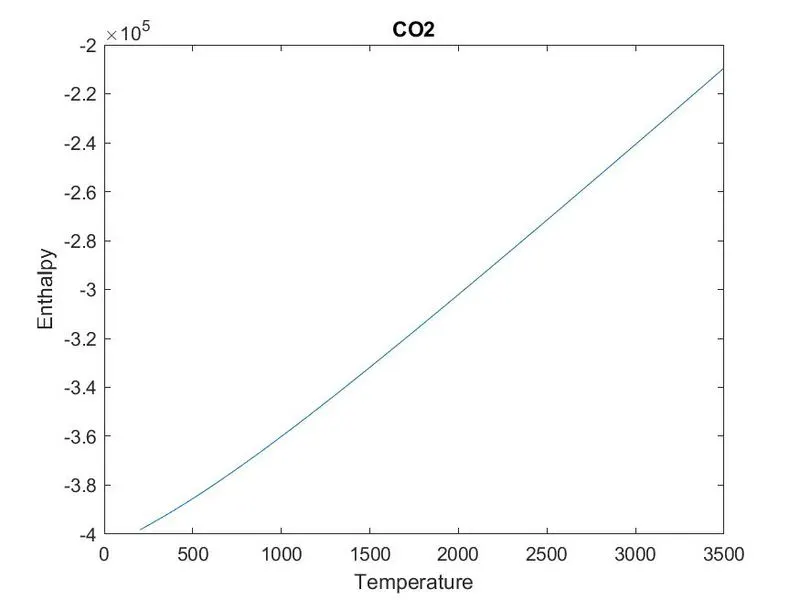
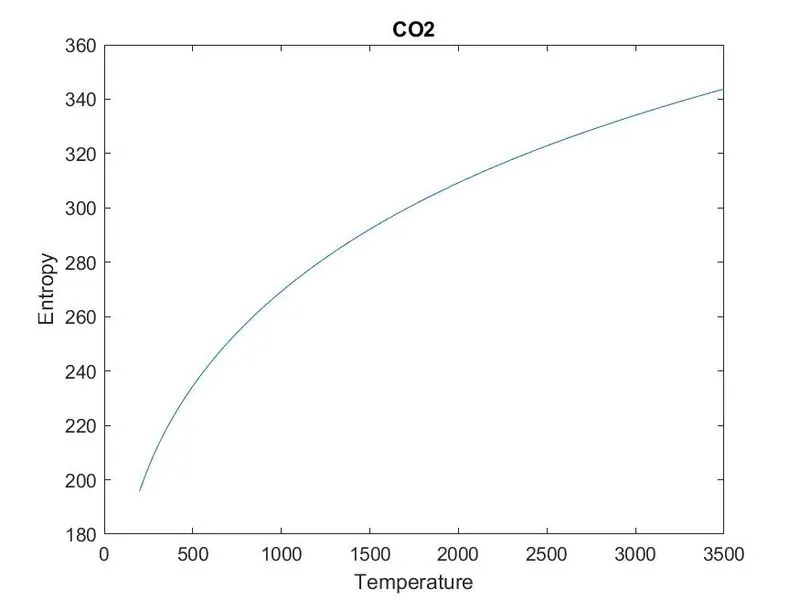
Plots for o2, N2 and Co2 species:
Explanation:
- Read and open the file of TERMO.dat using fopen command and syntax for fopen is fopen(filename,r), where r stands for reading the file.
- read all the lines of the file one by one using fgetl command.
- split the line from the space between the temperatures using strsplit command and the syntax for strsplit is strsplit(line,' '), where ' ' presenting the space between the temperatures.
- now change a string into a number using the str2double command for global temperatures.
- skip the next three comments by creating a for-loop.
- creating another for-loop to read the coefficient data for 1st species and use fgetl command again for coefficient lines.
- split the line from the space between the values using strsplit command and the syntax for strsplit is strsplit(line,' '), where ' ' presenting the space between the values.
- create a variable named species_name for species.
- use strfind command to find out the position of G in the coefficients lines.
- create a variable for temperature and then split them using strsplit command and convert the string into a number using str2double for all values of local temperature.
- now again use fgetl command three times one by one and find out all the coefficients for O2 but this is in for-loop so we will get coefficient for all species.
- now divide the local min. temperature and local max. temperature into 500 parts using linspace command for variable T.
- now create another for-loop for the length of variable T and find all values of Cp, H, S for every possible value of T.
- use mkdir command for automatically creating the folder and the syntax is mkdir(folder name,file name).
- plot for all species of specific heat, entropy, enthalpy using plot command and give titles to the plots using title command.
- specify the file name using cd.
- save all the plots using saveas command.
An explanation for molecular weight:
- create for-loop for atomic mass and for elements.
- now compare the species_name with elements using strcmpi command.
- find out molecular weight using the standard formula (molecular weight = molecular weight+atomic mass).
- if we have two elements together then use the formula molecular weight = molecular weight+atomic mass*(t-1), where t represents the no. of the same element more than one in the same molecule.
- use sprintf command to display the species name and molecular weight together with the help of %s %d.
Molecular weight for each species in the command window:
Screenshot of the window where all the folders saved.