Week 4.1 - Genetic Algorithm
OBJECTIVE :- GENETIC ALGORITHM.
clear all
close all
clc
%Defining our search space
x = linspace(0,0.6,150);
y = linspace(0,0.6,150);


%creating a 2dimensional mesh
[xx,yy] = meshgrid(x,y);

%evaluating the stalagmite function
for i = 1:length(xx)
    for j = 1:length(yy)
        input(1) = xx(i,j);
        input(2) = yy(i,j);
        f(i,j) = stalagmite1(input);
    end
end

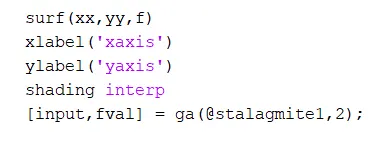
surf(xx,yy,f)
xlabel('xaxis')
ylabel('yaxis')
shading interp
[input,fval] = ga(@stalagmite1,2);
EXPLINATION:-
we start the code with the clear all , close all , and clc to clear out the workspace ,previous graphs,and command window.
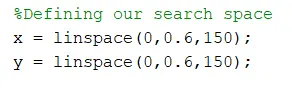
we take time interval from 0 to 0.6 and we need 150 intervals so for this we use linspace command,for the 'x' and 'y'.
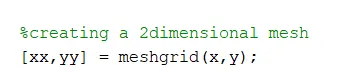
creating 2d grid coordinates contain 'x' and 'y',this we use the meshgrid command.
CREATING A STALAGMITE FUNCTION:-
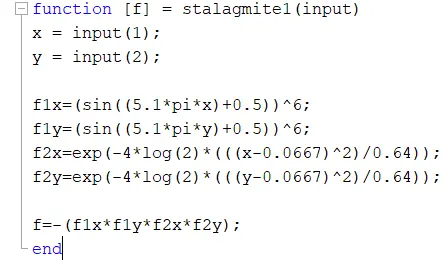
EXPLINATION:-
it is one of the test function performing the characteristics of opt. algorithm. create the function of 'f' is to 'stalagmite1(input)'.then we have 'x' and 'y' is the 'input(1)' and 'input(2).then using the formula, of 'f1x' = (sin((5.1*pi*x)+0.5))^6;' and 'f1y = (sin((5.1*pi*y)+0.5))^6;. same as to 'f2x' = exp(-4*log(2)*(((x-0.0667)^2)/0.64)); and 'f2y' = exp(-4*log(2)*(((y-0.0667)^2)/0.64)); . we have the multiply for f1x,f1y,f2x,f2y.the given equation is (f=-(f1x*f1y*f2x*f2y);) and the end this function.
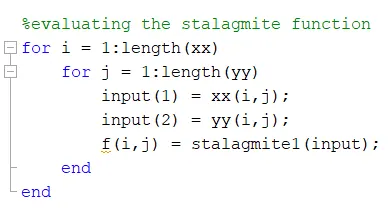
EXPLINATION:-
evaluating the stalagmite function using for loop for i = 1 to length of 'xx' and for j = 1 to length of 'yy'.the input of 1 is xx for (i,j) and the input 2 is yy for (i,j).then apply the creating the function for f(i,j) = stalagmite1(input); and we last the close the loop.we have use the for loop will be the helpful to cover the 2dinput.the point xyplane stalagmit function to calculate the 'f' value.
EXPLINATION:-
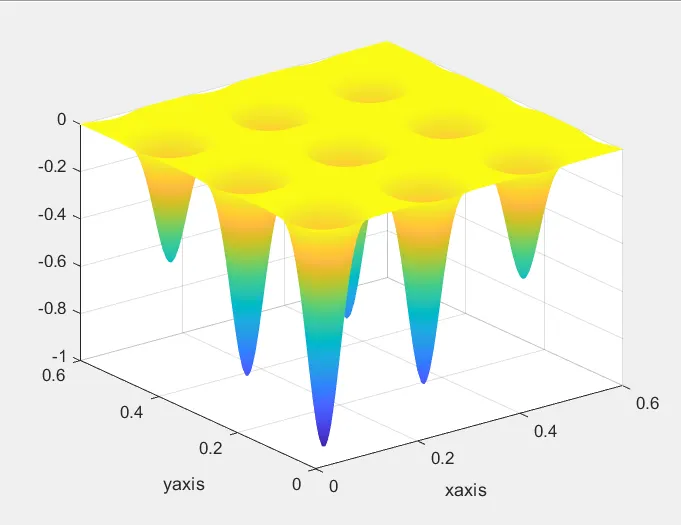
We using the surf command for 'xx,yy,f' plane ,then we have use the label for x and y axis for name xlabel show xaxis and ylabel show yaxis.then the shading interp command is use for clear the object.we have last using the function for stalagmite for input and fval.ga(2stalagmite1,2).
OUTPUT FOR THE CODE IS:-
GENETIC ALGORITHM AND GA SYNTAX:-
genetic algorithm solving the three main process (1) selection,(2) crossover (3)mutation. the selectin process is base on the fitness value of the function,crossover is the process is alogrithm to extract the best character from different individual and recombine potentially superior.and mutation is algorithm to generateindividual with better fitness value .x= ga(fun,nvars,A,b,aeq,beq,lb,ub,nonlcon,options) fun is the objective function.,nvar is the number of variables,A i real matrix and b is real vector, lu is the lower biunds and ub is the upper bound,nonlcon is the nonlinear constrain options is optimization option.
CASE 1 = UNBOUNDED INPUT
%case 1 = Unbounded input
for i = 1:50
    [input,fopt(i)] = ga(@stalagmite1,2);
    xopt(i)= input(1);
    yopt(i)= input(2);
end
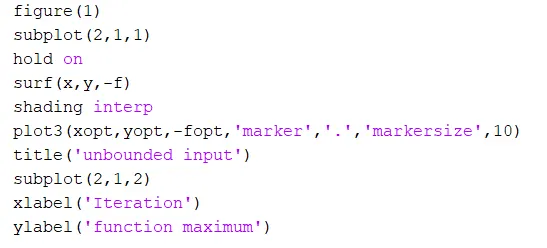
figure(1)
subplot(2,1,1)
hold on
surf(x,y,-f)
shading interp
plot3(xopt,yopt,-fopt,'marker','.','markersize',10)
title('unbounded input')
subplot(2,1,2)
xlabel('Iteration')
ylabel('function maximum')
EXPLINATION:-
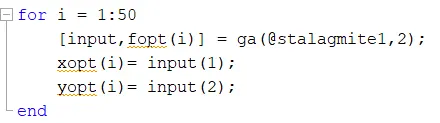
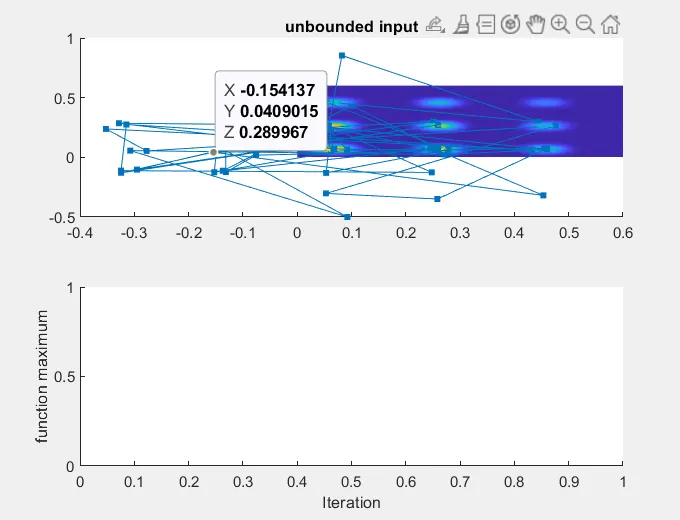
the unbounded condition for using the for loop cover the 2 dimensional input the every point in the xy plane stalagmite function is call f .using the for loop for i=1 to 50 and the function call input and fopt(i), then call the function ga(@stalagmite1,2),xopt(i) and yopt(i) is the value for input(1) and input(2) is given and then the loop is end.the unbounded case the lower and upper bound are not define.
EXPLINATION:-
figure1 is the command is output command, then we use the subplot having (2,1,1) hold on command is use to holding the figure, surf is using the x,y,-f having the 2 dimensional surface,shading interp command is use to clear the shade for unbounded region,plotting the xopt,yopt,-fopt is the optiomum function havhing the 'marker is use the figure and markersize is show the size of the unbounded region.title command is use the name of given code,then using the subplot for (2,1,2),then we have use the label command for xaxis and y axis xlabel command show the Iteration and ylabel command show the function maximum.
RESULT FOR CASE 1:-
CASE 2 = BOUNDED INPUT
EXPLINATION:-

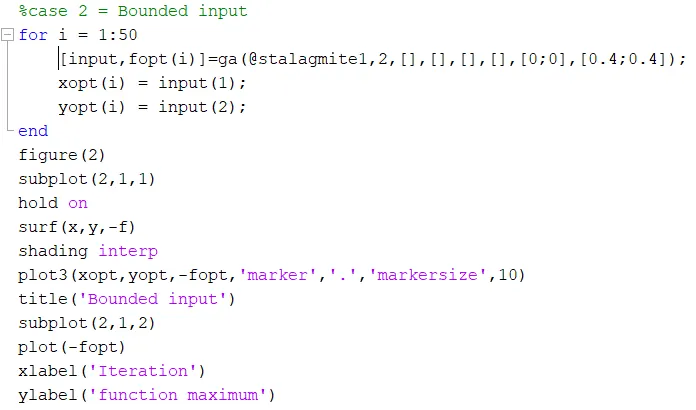
we have use the for loop for i = 50. 50 is the num_cases, then apply for function foer input and fopt ga(@stalagmite) then the ga syntax the lowe and upper bounded are define, with define the bounds of x from 0 to 0.4 and bound of y from 0 to 0.4 result in the better optimization.and xopt for i and yopt for i is the given inputs for input(1) and input(2) then the loop is end.
EXPLINATION:-
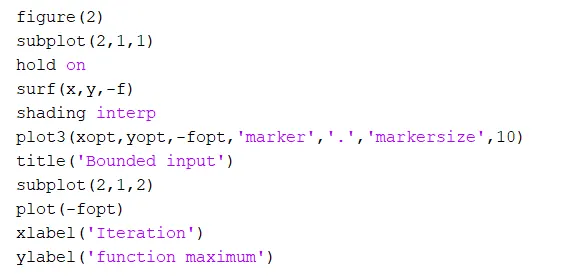
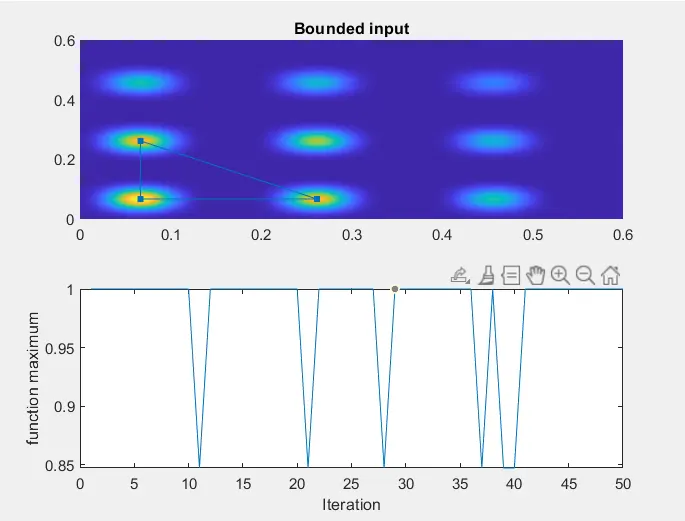
figure2 is the command is output command, then we use the subplot having (2,1,1) hold on command is use to holding the figure, surf is using the x,y,-f having the 2 dimensional surface,shading interp command is use to clear the shade for bounded region,plotting the xopt,yopt,-fopt is the optiomum function havhing the 'marker is use the figure and markersize is show the size of the bounded region.title command is use the name of given code 'Bounded input',then using the subplot for (2,1,2),then we have use the label command for xaxis and y axis xlabel command show the Iteration and ylabel command show the function maximum.
RESULT FOR CASE 2:-
CODE 3 = POPULATION SIZE
EXPLINATION:-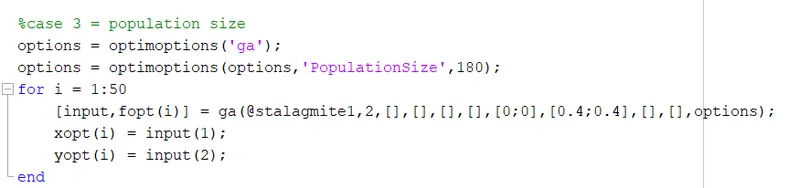
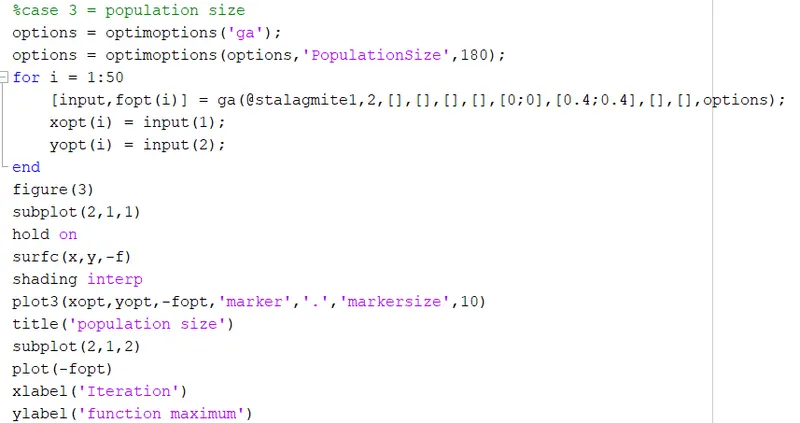
the ga syntax lower and upper bound are define the population size is increased 180,the optimoptions will be used to define the population.we have use the for loop for i = 50. 50 is the num_cases, then apply for function foer input and fopt ga(@stalagmite) then the ga syntax the lowe and upper bounded are define, with define the bounds of x from 0 to 0.4 and bound of y from 0 to 0.4 result in the better optimization.and xopt for i and yopt for i is the given inputs for input(1) and input(2) then the is end.
EXPLINATION:-
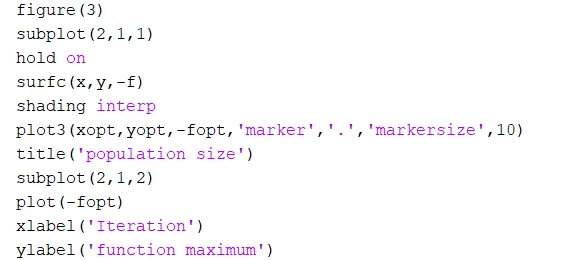
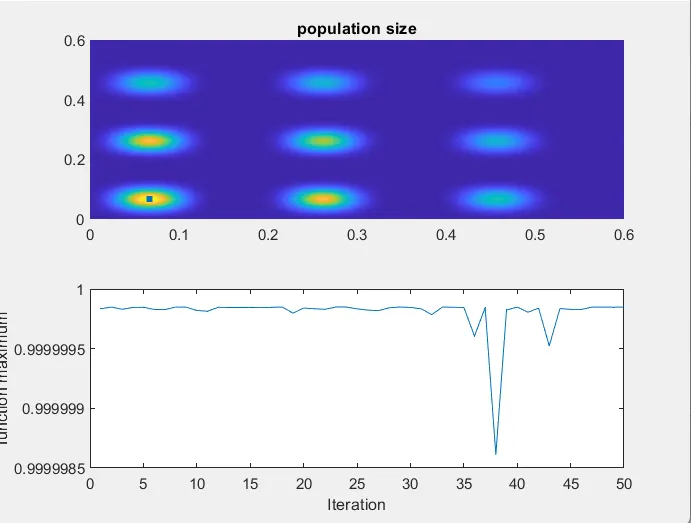
figure3 is the command is output command, then we use the subplot having (2,1,1) hold on command is use to holding the figure, surf is using the x,y,-f having the 2 dimensional surface,shading interp command is use to clear the shade for Ppopulation,plotting the xopt,yopt,-fopt is the optiomum function havhing the 'marker is use the figure and markersize is show the size of the population size.title command is use the name of given code 'population size',then using the subplot for (2,1,2),then we have use the label command for xaxis and y axis xlabel command show the Iteration and ylabel command show the function maximum.
RESULT FOR CASE 3:-
CONCLUSION:-
hence with this we have completed genetic algorithm for the using diff case.
THANK YOU.