Project 1 - Parsing NASA thermodynamic data
OBJECTIVE :- PARSING NASA THERMODYNAMIC DATA.
clear all
close all
clc

%filereading
f1 = fopen('THERMO.dat','r');

for i = 1:5
    fgetl(f1)
end

for j = 1:53
a = fgetl(f1);
b = strsplit(a,' ');
speciesname = b{1};

%localtempreature
low_temp = str2double(b{end-3});
high_temp = str2double(b{end-2});
mid_temp = str2double(b{end-1});

%extraxting the condition
line_1 = fgetl(f1)
a = strfind(line_1,'E');
a1 = str2double(line_1(1:a(1)+3));
a2 = str2double(line_1(a(1)+4:a(2)+3));
a3 = str2double(line_1(a(2)+4:a(3)+3));
a4 = str2double(line_1(a(3)+4:a(4)+3));
a5 = str2double(line_1(a(4)+4:a(5)+3));

%getting second line coefficient(a6-a10)
line_2 = fgetl(f1);
a_1 = strfind(line_2,'E');
a6 = str2double(line_2(1:a_1(1)+3));
a7 = str2double(line_2(a_1(1)+4:a_1(2)+3));
a8 = str2double(line_2(a_1(2)+4:a_1(3)+3));
a9 = str2double(line_2(a_1(3)+4:a_1(4)+3));
a10= str2double(line_2(a_1(4)+4:a_1(5)+3));

%getting third line coefficient(a10-a14)
line_3 = fgetl(f1);
a_2 = strfind(line_1,'E');
a11 = str2double(line_3(1:a_2(1)+3));
a12 = str2double(line_3(a_2(1)+4:a_1(2)+3));
a13 = str2double(line_3(a_2(2)+4:a_1(3)+3));
a14 = str2double(line_3(a_2(3)+4:a_1(4)+3));

%calculation of cp,H,S
T = linspace(low_temp,high_temp,500)

for i = 1:length(T)
    if(T(i)<=mid_temp)
        T1(i)=T(i);
    elseif(T(i)>mid_temp)
        T2(i)=T(i)
    end
end

ltr = T1;
d = length(ltr)
htr = T2((d+1):500);
R = 8.314;

CP1 = (a1+a2*ltr+a3*ltr.^2+a4*ltr.^3+a5*ltr.^4)*R;
H1 = (a1+(a2*ltr)/2+(a3*ltr.^2)/3+(a4*ltr.^3)/4+(a5*ltr.^4)/5+(a6./ltr))*R.*ltr;
S1 = a1*log(ltr)+a2.*ltr+(a3*ltr.^2)/2+(a4*ltr.^3)/3+(a5*ltr.^4)/4+a7;

CP2 = (a8+a9*htr+a10*htr.^2+a11*htr.^3+a12*htr.^4)*R;
H2 = (a8+(a9*htr)/2+(a10*htr.^2)/3+(a11*htr.^3)/4+(a12*htr.^4)/5+(a13./htr))*R.*htr;
S2 = a8*log(htr)+a9*htr+(a10*htr.^2)/2+(a11*htr.^3)/3+(a12*htr.^4)/4+a14;

CP = [CP1,CP2];
H = [H1,H2];
S = [S1,S2];

%creating folder
mkdir(['C:\Users\vinay\OneDrive\Desktop\filrparasing\',speciesname]);

figure(1)
plot(T,CP,'linewidth',3);
xlabel('Tempreature')
ylabel('specific heat')
title('tempreature vs specifice heat');

figure(2)
plot(T,H,'linewidth',3);
xlabel('Tempreature')
ylabel('enthalpy')
title('tempreature vs enthalpy');


figure(3)
plot(T,S,'linewidth',3);
xlabel('Tempreature')
ylabel('entropy')
title('tempreature vs entropy');

cd(['C:\Users\vinay\OneDrive\Desktop\filrparasing\',speciesname]);

saveas(1,'cpvst','jpg')
saveas(2,'hvst','jpg')
saveas(3,'svst','jpg')

molecular_Weight = molecular_weight(speciesname);
fprintf('Molecular weight of %s is %f',speciesname,molecular_Weight);


end
EXPLINATION:-
we start the code with the clear all , close all , and clc to clear out the workspace ,previous graphs,and command window.
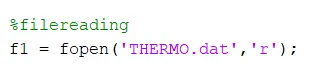
EXPLINATION:- the file reading command is to get f1 and the is downlading the thermo.data sheet. fopen command show the given data sheet is open.
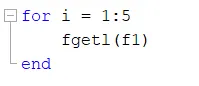
EXPLINATION:- we have using the for loop i = 1 to 5 and the line is necessary for the calculation should be get from the file using 'fgetl'.and then the loop is end.
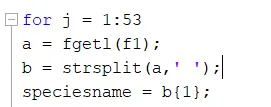
EXPLINATION:-we have using the for loop i = 1 to 53 and the line is necessary for the calculation should be get from the file a using 'fgetl'. and b using the strsplit, for splitting the file 'a'.then the speciesname command is using the for name for given speciesname for b.
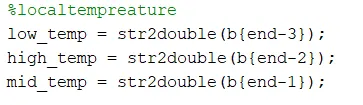
EXPLINATION:- we have to call the local tempreature the low_temp is to use the command for str2double is convert the text in str to double precision vale for b (end-3).local tempreature the high_temp is to use the command for str2double is convert the text in str to double precision vale for b (end-2).local tempreature the mid_temp is to use the command for str2double is convert the text in str to double precision vale for b (end-1).
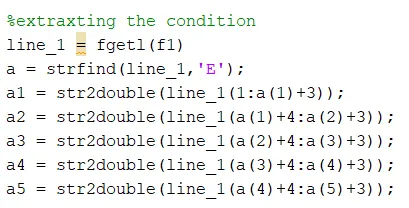
EXPLINATION:-we have the show the thermo data sheet having the extracting command for line 1 to 5,line_1 is to get the line is necessary for the calculation should be get from the file using 'fget1 for (f1).a show the execute a case sensitive search for line _1 of 'E'.line a1=str2double(line_1(1:a(1)+3)); the command for str2double is convert the text in str to double precision vale line_1 1 as to a of 1 +3. same for a2=str2double(line_1(a(1)+4:a(2)+3));the command for str2double is convert the text in str to double precision vale line_1 1 as to a of 1 +4 as to a(2)+3.same for all line for up to a5.
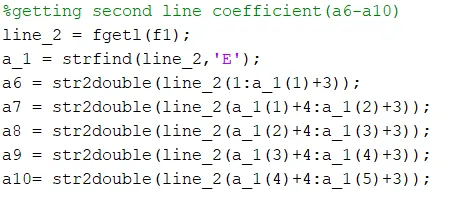
EXPLINATION:- we have the show the thermo data sheet having the extracting command for line a6 to a10,line_2 is to get the line is necessary for the calculation should be get from the file using 'fget1 for (f1)a_1 having the command for strfind.a show the execute a case sensitive search for line _2 of 'E'.a6=str2double(line_2(1:a_1(1)+3));for using the command for str2double having the line_2 1 as to a_1(1)+3, same uing for the line ('a7,a8,a9,10).but the some samll value change for the line no.
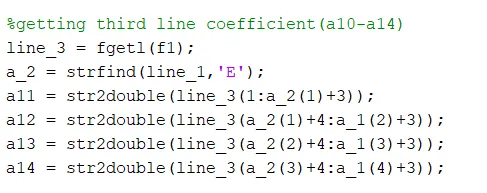
EXPLINATION:-we have the show the thermo data sheet having the extracting command for line a10 to a14,line_3 is to get the line is necessary for the calculation should be get from the file using 'fget1 for (f1)a_2 having the command for strfind.a show the execute a case sensitive search for line _1 of 'E. a11=str2double(line_2(1:a_1(1)+3));for using the command for str2double having the line_2 1 as to a_1(1)+3, same uing for the line ('a12,13,14).but the some samll value change for the line no.

EXPLINATION:- we have to calculate the specific heat, enthalpy and entropy for T=linspace loe_temp,high_tepm,500. the linspace command using the return a row vetcor evenly spaced point between low _temp and high_temp.
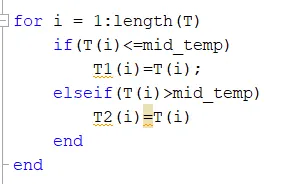
EXPLINATION:- for using the for loop having the for i = 1 as to length go T,then using if else if(T(i)<=mid_temp) T of i is lessthen or equal to the mid tempreatur then we have the T1(i)=T(i) , else T(i) is greater than the mid_temp for T2(i)=T(i). then loop is end .
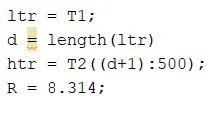
EXPLINATION:- ltr is loop transfer recovery for T1 , d for the length of (ltr), htr is the T2(d+1 as to 500 and R is constant the value is 8.314.

EXPLINATION:-we have to calculate the value for CP1,H1,S1 . the value for CP,H,S calculte with the reference to the tempreatureand the coefficient, the coefficent set should be the determine base on the local middle tempreatureof the species.CP1 calculate the having the formula is (a1+a2*ltr+a3*ltr.^2+a4*ltr.^3+a5*ltr.^4)*R; then 'H1' is calculating the formula is (a1+(a2*ltr)/2+(a3*ltr.^2)/3+(a4*ltr.^3)/4+(a5*ltr.^4)/5+(a6./ltr))*R.*ltr;, then S1 calculte for using the formula is a1*log(ltr)+a2.*ltr+(a3*ltr.^2)/2+(a4*ltr.^3)/3+(a5*ltr.^4)/4+a7;.

EXPLINATION:-we have to calculate the value for CP2,H2,S2 . the value for CP,H,S calculte with the reference to the tempreatureand the coefficient, the coefficent set should be the determine base on the local middle tempreatureof the species,CP2 calculate having the formula is (a8+a9*htr+a10*htr.^2+a11*htr.^3+a12*htr.^4)*R;,H2 is having the formula is(a8+(a9*htr)/2+(a10*htr.^2)/3+(a11*htr.^3)/4+(a12*htr.^4)/5+(a13./htr))*R.*htr; and the S2 for using the formula a8*log(htr)+a9*htr+(a10*htr.^2)/2+(a11*htr.^3)/3+(a12*htr.^4)/4+a14;.
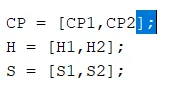
EXPLINATION:- we have the case for Specific heat=[CP1,CP2], enthalpy=[H1,H2] ,entropy=[S1,S2].

EXPLINATION:- creating the folder using the mkdir command, to create the specified folder and reutrns a status of 1 if the operation is successifully or if the folder exist.the fileparasing data sheet having to create the folder in desktop. and the speciesname for given.
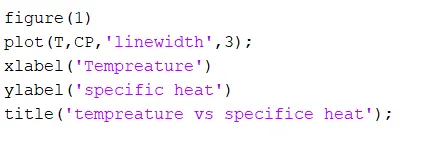
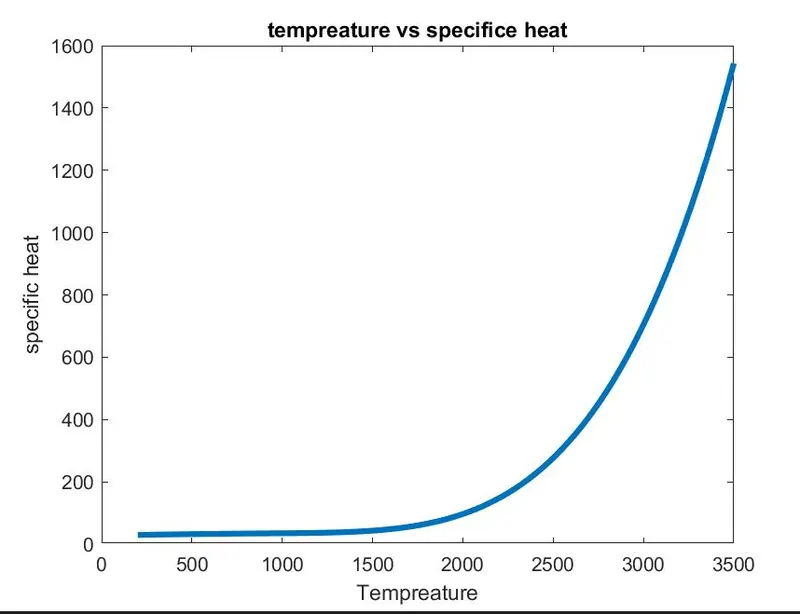
EXPLINATION:- figure(1) is name for the output for the graph.plot command is use the tempreature and specific heat having the linewidth command show the line thickness.xlabel command shoe the name for xasix is Tempreature and ylabel command show the yaxis is specific heat.then title command show the name of given output for tempreature and specific heat.
FIGURE(1) OUTPUT FOR O2,N2,CO2:=
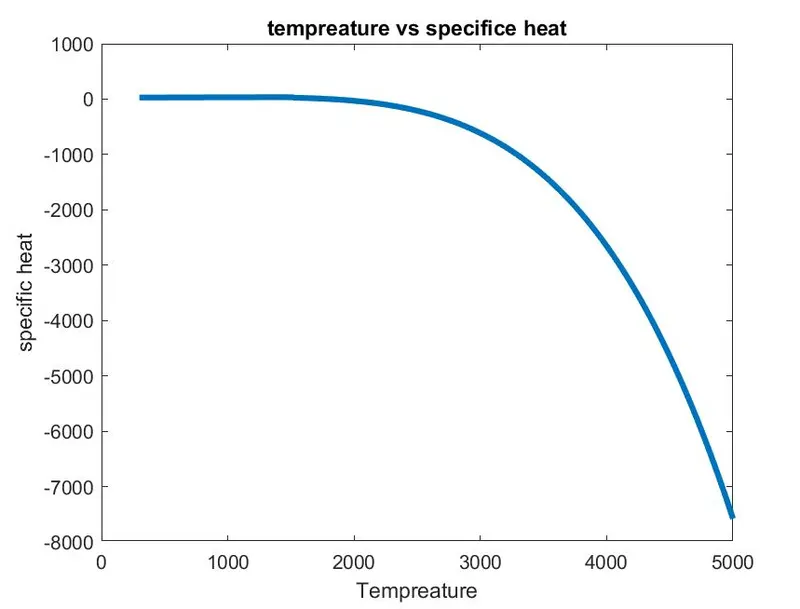
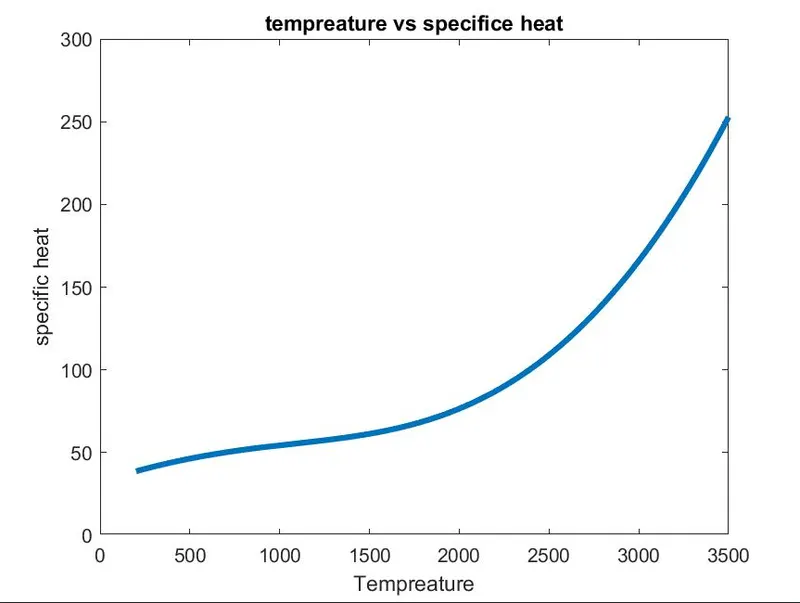
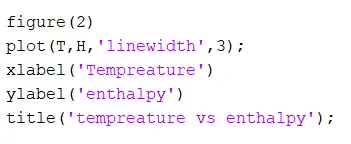
EXPLINATON:-figure(2) is name for the output for the graph.plot command is use the tempreature and specific heat having the linewidth command show the line thickness.xlabel command shoe the name for xasix is Tempreature and ylabel command show the yaxis is enthalpy .then title command show the name of given output for tempreature and specific enthalpy.
FIGURE(2) OUTPUT FOR O2,N2,CO2:=
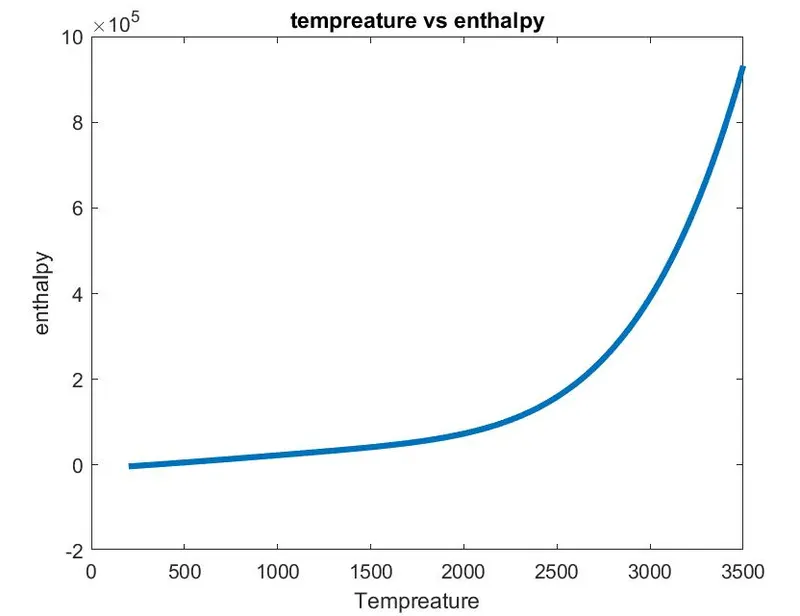
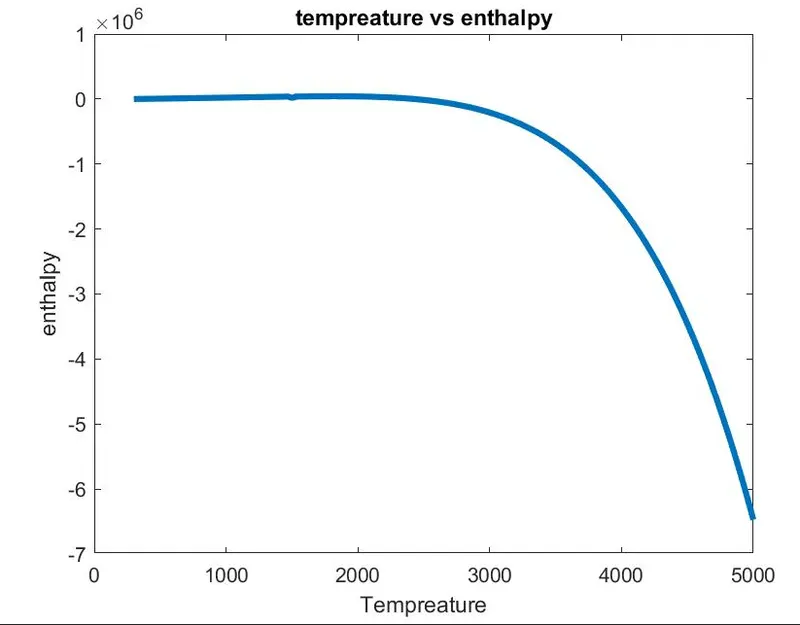
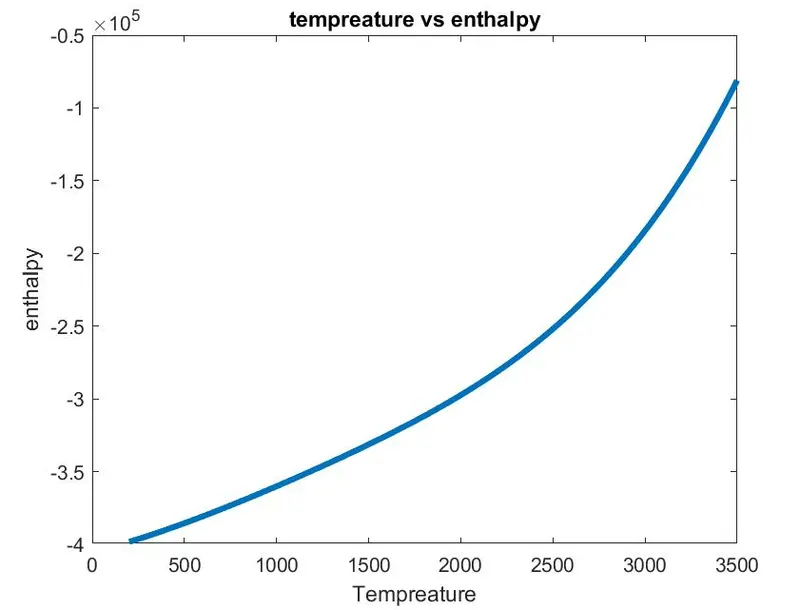
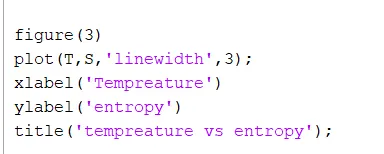
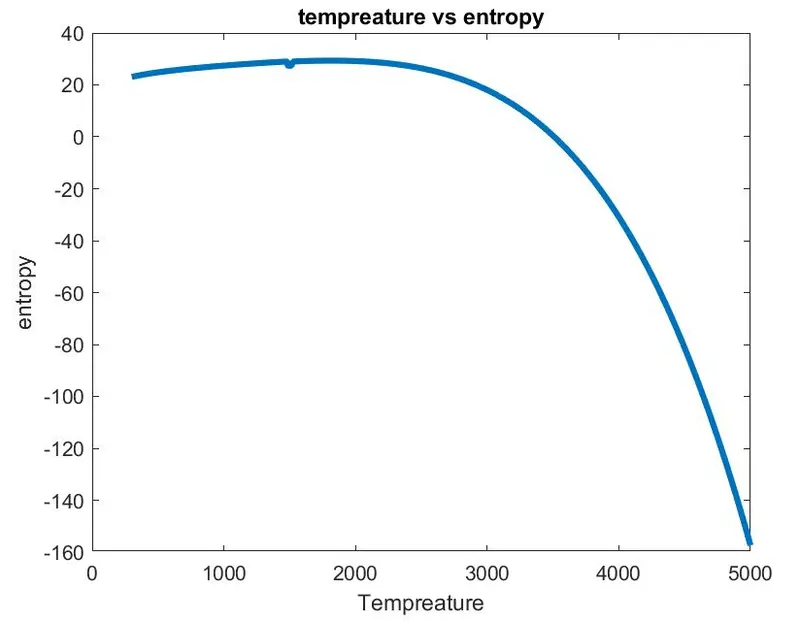
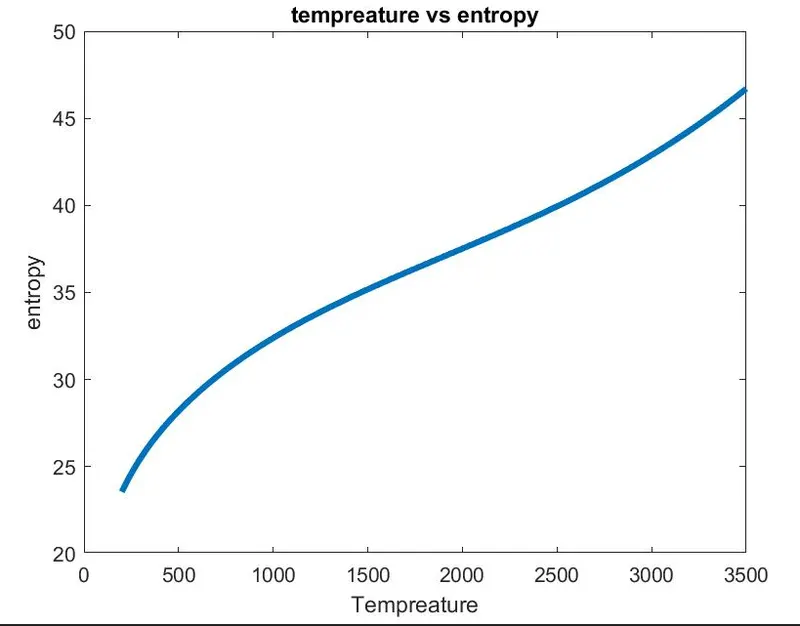
EXPLINATION:-figure(3) is name for the output for the graph.plot command is use the tempreature and specific heat having the linewidth command show the line thickness.xlabel command shoe the name for xasix is Tempreature and ylabel command show the yaxis is entropy .then title command show the name of given output for tempreature and specific entropy.
FIGURE(3) OUTPUT FOR O2,N2,CO2:=
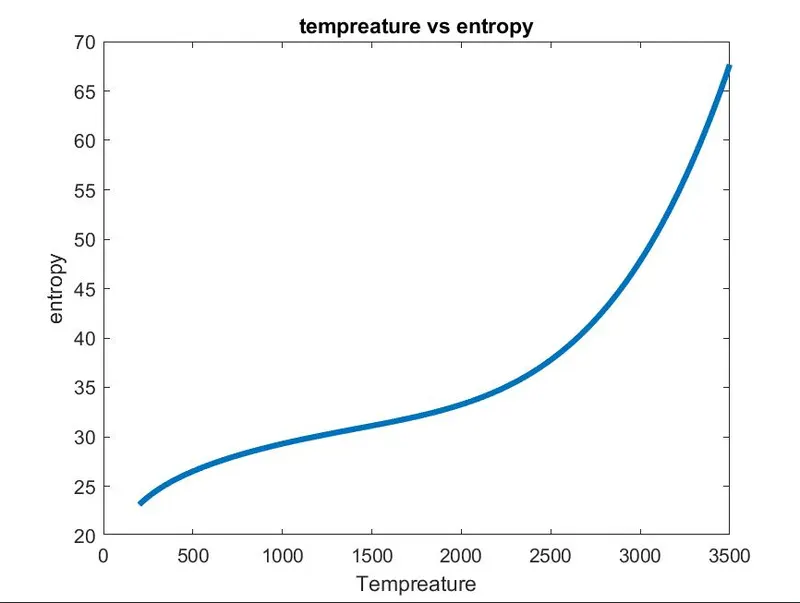

EXPLINATION:-cd is change current folder to new folder folder changes are global if use the cd within a function the folder change.
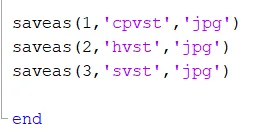
EXPLINATION:-we have use the save as command for saving the figure(1),(2),(3) for specific heat vs tempreature, enthalpy vs tempreature and entropy vs tempreature ,and having the file save type is 'jpg' form and then the loop is end.
RESULT:- Screenshot of the all window where all the folder save.

TO FIND THE MOLECULAR WEIGHT:-
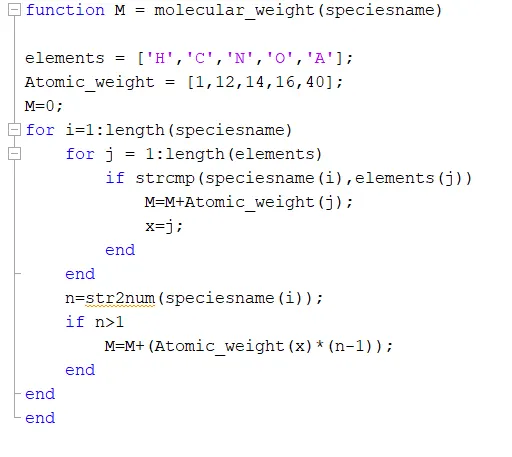
EXPLINATION:-
Under this function our aim is to calculate the molecular weight of the atoms.We will match the elements with our function which is "['H','C','N','O','A']" we have given atomic molecular weight of the corresponding elements in the variable called "Atomic_weight" which is [1,12,14,16,40].., with the help of "strcmp" (which refers to string comparison) we will compare element names.Then we take Atomic_weight and add with the corresponding atom.Then we compare the species name.We have used a "if condition" because the molecular weight will add up and we will get incorrect element which is not even present, i.e { M=M+Atomic_weight(j);} to overome this issue we have used "if condition" and provided the condition as { M=M+(Atomic_weight(x)*(n-1)); }. For example, CO3 here n=3, after the condition executes this will become CO2 with the help of (n-1).
RESULT:-

CONCLUSION:-
Hence with this we have completed file Parsing NASA thermodynamic data.
THANK YOU.