Week 3 Verification of Weld Joints
Stress Concentration on Welded Joints
OBJECTIVES:
To carry out a Static Structural Analysis on the given model for three cases which uses different material for the plates, ribs, and weldments and determine the stress, deformation and strain.
CASE-1:
For Case-1, Static Structural Analysis was carried out with the given model. The material used for this analysis was STAINLESS STEEL and the analysis was carried out using ANSYS Mechanical Enterprise. The model for the case-1 was imported to ANSYS Workbench software and is shown in the figure below.
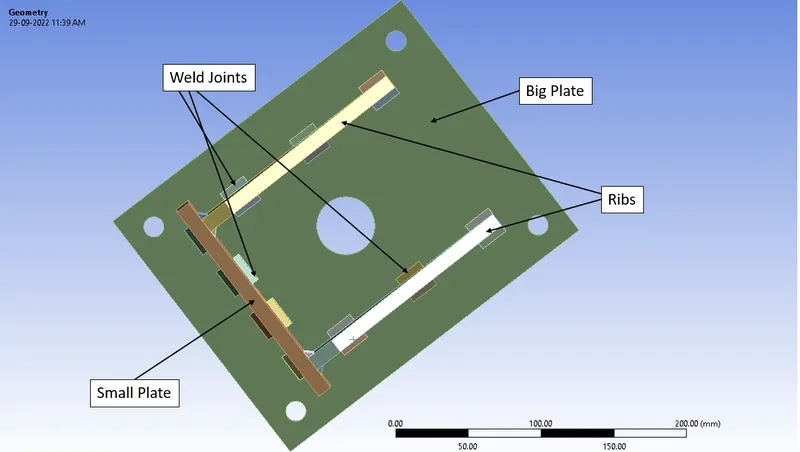
Fig.1 Model
Later the material was assigned and the material and its properties used for this analysis are specified below for both gears.
|
Material |
Stainless Steel |
|
Density |
7.75e-6 kg/mm3 |
|
Young’s Modulus |
1.93e+5 MPa |
|
Thermal Conductivity |
0.0151 W/mm°C |
|
Specific Heat |
4.8e+5 J/kg°C |
|
Tensile Yield Strength |
207 MPa |
|
Tensile Ultimate Strength |
586 MPa |
|
Components |
Plates, Ribs, and Weldments |
Then the model was meshed in ANSYS Mechanical Enterprise with an element size of 7.0mm for Small and Big Plates, whereas others were meshed with default mesh size using Hexahedrons was employed. This was done to get better mesh.
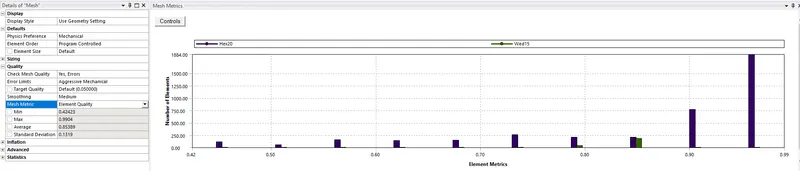
Fig.2 Element Quality
A mesh metric that identifies elements according to their quality was employed and it can be seen that the elements of lowest quality are minimal. Most of the elements are of very high quality in the range of 0.8 to 1. Hence, the mesh is of acceptable quality. The meshed model is shown below.
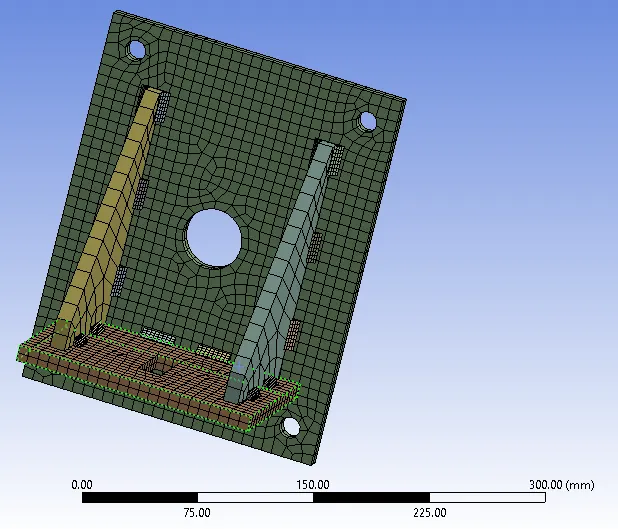
Fig.3 Meshed Model
Then Contacts were provided with FRICTIONAL type having 0.2 COEFFICIENT of FRICTION, with a SINGLE step setting. Then FIXED SUPPORTS were provided to the Big Plate and a FORCE of 15000N was provided to the small plate. The simulation was carried out and results were obtained for Equivalent Stress, Directional Deformation and Strain for ribs and as well as entire setup was obtained.
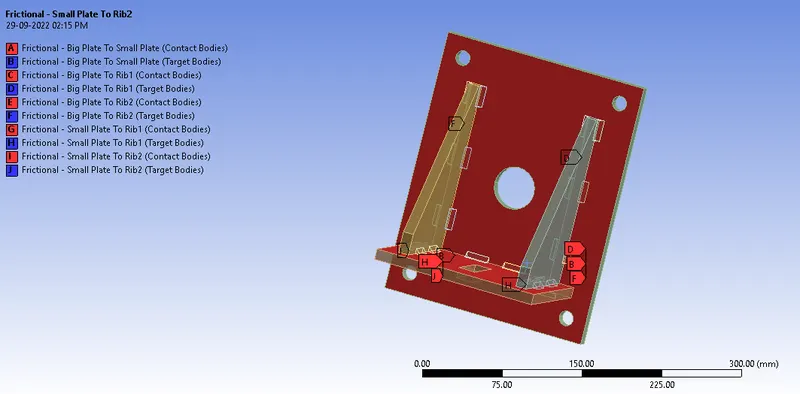
Fig.4 Frictional Contact
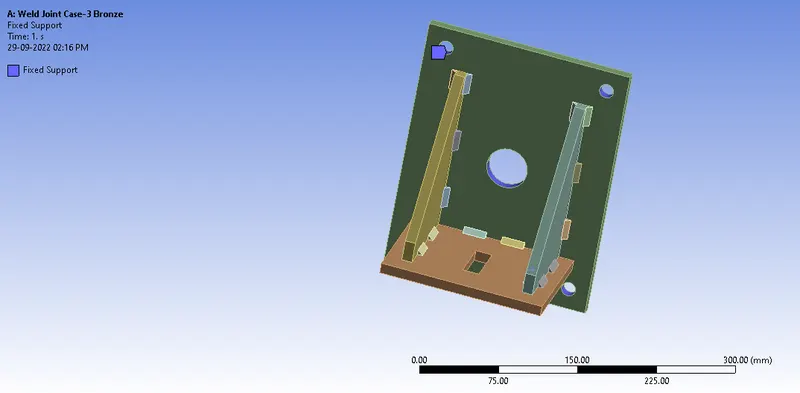
Fig.5 Fixed Support
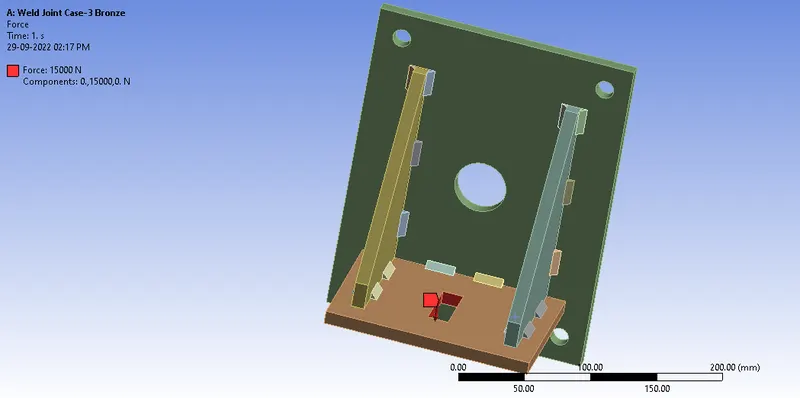
Fig.6 Load Applied
CASE-2:
For Case-2, Static Structural Analysis was carried out with the given model. The material used for this analysis was ALUMINUM ALLOY, STAINLESS STEEL and the analysis was carried out using ANSYS Mechanical Enterprise. Later the material was assigned and the material and its properties used for this analysis are specified below for both gears.
|
Material |
Aluminum Alloy |
Stainless Steel |
|
Density |
2.77e-6 kg/mm3 |
7.75e-6 kg/mm3 |
|
Young’s Modulus |
7.38e+04 MPa |
1.93e+5 MPa |
|
Thermal Conductivity |
0.06 W/mm°C |
0.0151 W/mm°C |
|
Specific Heat |
4.996e+5 J/kg°C |
4.8e+5 J/kg°C |
|
Tensile Yield Strength |
363 MPa |
207 MPa |
|
Tensile Ultimate Strength |
449 MPa |
586 MPa |
|
Components |
Weldments |
Plates and Ribs |
The same contacts and load used in Case-1 was used in Case-2 also with only change in Material of the weldments. Then the analysis was run and results were obtained.
CASE-3:
For Case-3, Static Structural Analysis was carried out with the given spur gear model. The material used for this analysis was BRONZE, STAINLESS STEEL, COPPER and the analysis was carried out using ANSYS Mechanical Enterprise. Later the material was assigned and the material and its properties used for this analysis are specified below for both gears.
|
Material |
Bronze |
Stainless Steel |
Copper |
|
Density |
8.810e-6 kg/mm3 |
7.75e-6 kg/mm3 |
8.3e-6 kg/mm3 |
|
Young’s Modulus |
8e+05 MPa |
1.93e+5 MPa |
1.1e+5 MPa |
|
Thermal Conductivity |
0.06 W/mm°C |
0.0151 W/mm°C |
0.401 W/mm°C |
|
Specific Heat |
4.996e+5 J/kg°C |
4.8e+5 J/kg°C |
3.85e+5 J/kg°C |
|
Tensile Yield Strength |
144 MPa |
207 MPa |
280 MPa |
|
Tensile Ultimate Strength |
267 MPa |
586 MPa |
430 MPa |
|
Components |
Weldments |
Plates |
Ribs |
The same contacts and load used in Case-1 was used in Case-3 also with only change in Material of the plates, welds and ribs. Then the analysis was run and results were obtained.
RESULTS:
The Directional Deformation in Y-axis for the setup was obtained from the analysis and compared below.
|
Case |
Minimum [mm] |
Maximum [mm] |
Average [mm] |
|
1 |
-3.3079e-2 |
0.35134 |
2.7883e-2 |
|
2 |
-2.2095e-2 |
0.36894 |
3.2293e-2 |
|
3 |
-2.3653e-2 |
0.41084 |
3.6646e-2 |
The Equivalent (Von-Mises) Stress for the setup was obtained from the analysis and compared below.
|
Case |
Minimum [MPa] |
Maximum [MPa] |
Average [MPa] |
|
1 |
0.12293 |
337.68 |
26.58 |
|
2 |
7.5653e-2 |
345.44 |
26.086 |
|
3 |
8.9098e-2 |
351.94 |
26.552 |
The Equivalent Elastic Strain for the setup was obtained from the analysis and compared below.
|
Case |
Minimum [mm/mm] |
Maximum [mm/mm] |
Average [mm/mm] |
|
1 |
8.289e-7 |
1.8118e-3 |
1.4505e-4 |
|
2 |
3.9189e-7 |
3.1725e-3 |
2.1749e-4 |
|
3 |
4.6167e-7 |
3.2046e-3 |
2.1933e-4 |
The Equivalent Stress for the welded joints were obtained from the analysis and compared below.
|
Case |
Minimum [MPa] |
Maximum [MPa] |
Average [MPa] |
|
1 |
1.2157 |
302.47 |
37.99 |
|
2 |
0.70494 |
248.17 |
32.028 |
|
3 |
1.2448 |
255.97 |
31.885 |
The Equivalent Elastic Strain for the ribs was obtained from the analysis and compared below.
|
Case |
Minimum [mm/mm] |
Maximum [mm/mm] |
Average [mm/mm] |
|
1 |
2.1149e-5 |
5.0916e-4 |
1.1421e-4 |
|
2 |
2.0721e-5 |
3.9584e-4 |
1.1682e-4 |
|
3 |
2.0783e-5 |
5.5602e-4 |
1.6659e-4 |
The Max. Equivalent Stress (Safety Factor) for the setup was obtained and compared below.
|
Case |
Minimum |
Maximum |
Average |
|
1 |
0.61301 |
15 |
11.083 |
|
2 |
0.59924 |
15 |
11.869 |
|
3 |
0.56256 |
15 |
10.667 |
The Total Deformation for all the three cases obtained from the analysis is shown below.
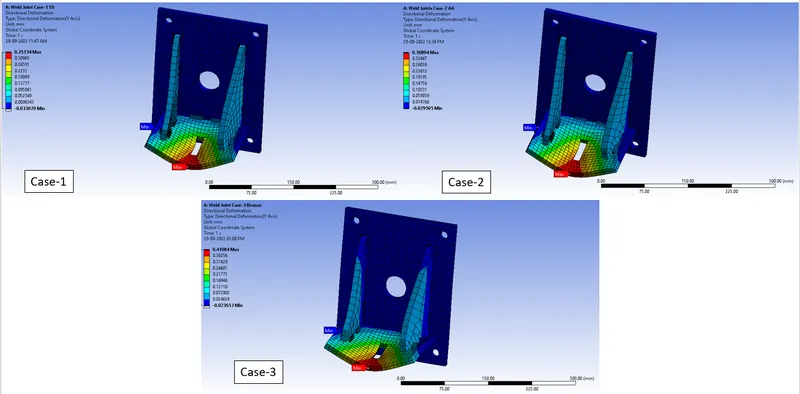
Fig.7 Total Deformation Contour Plot
The Equivalent (Von-Mises) Stress for all the three cases obtained from the analysis is shown below.
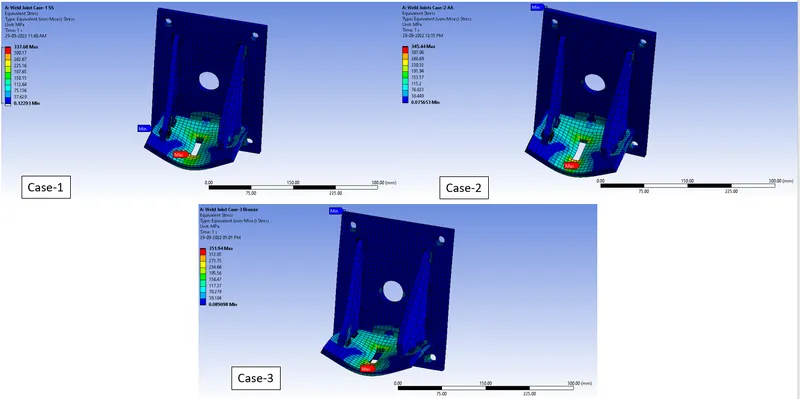
Fig.8 Equivalent Stress Contour Plot
The Equivalent Elastic Strain for all the three cases obtained from the analysis is shown below
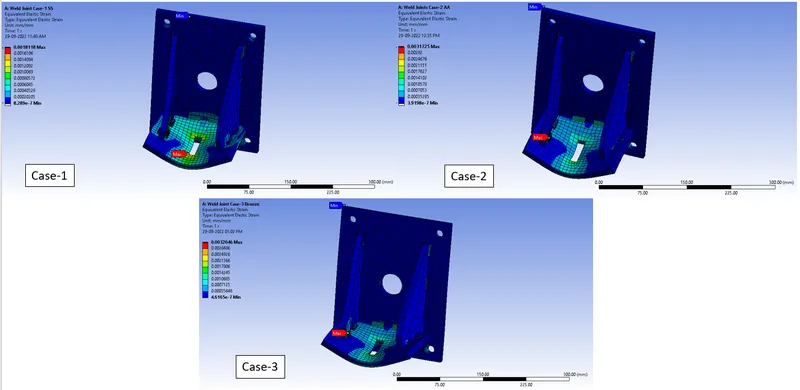
Fig. 9 Equivalent Elastic Strain Contour Plot
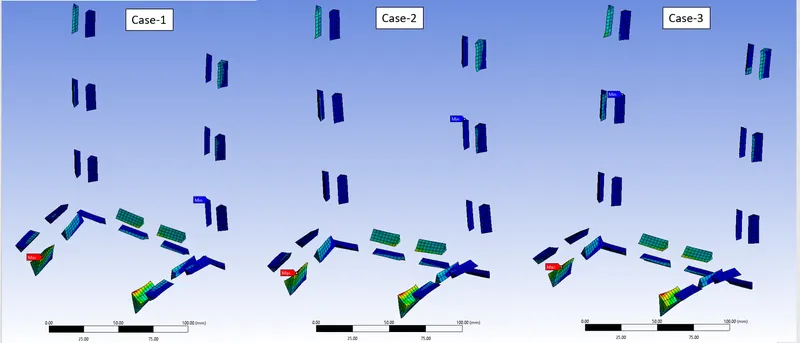
Fig.10 Equivalent Stress for the welded joints Contour Plot
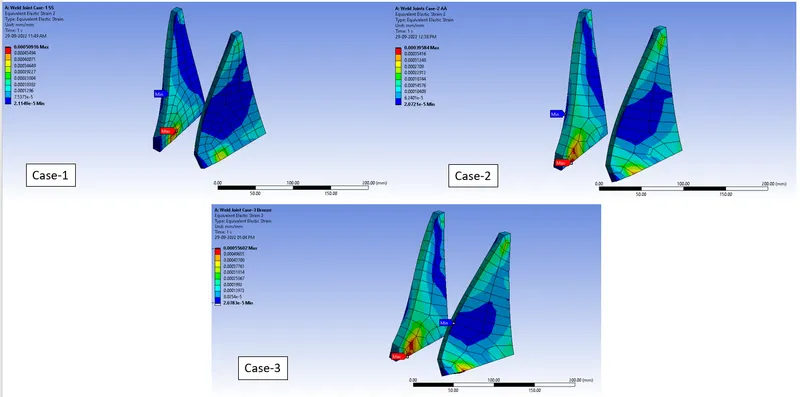
Fig.11 Equivalent Elastic Strain for the ribs Contour Plot
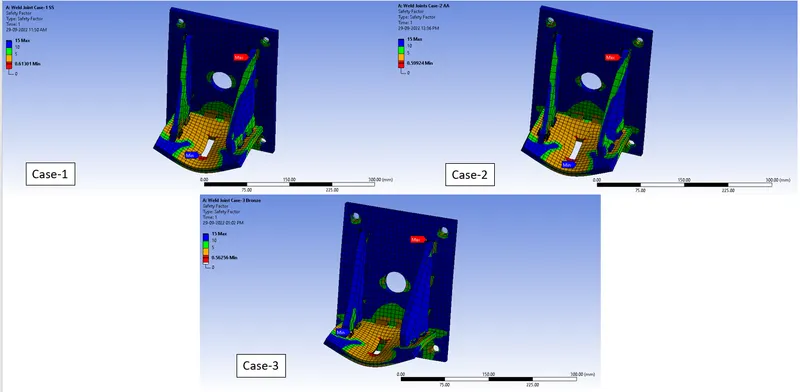
Fig.12 Max. Equivalent Stress (Safety Factor) Contour Plot
LOCATION OF HIGHER STRESS IN WELDMENTS:
The Weld Joints, for the given load may facture or start to fail at the location of High Stress Regions which is as shown in the figure below. The weld joints near to the force application have higher stress.
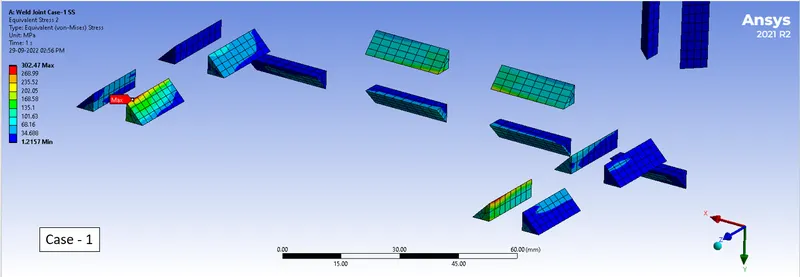
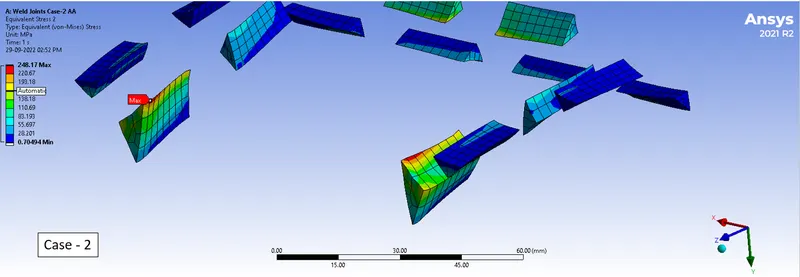
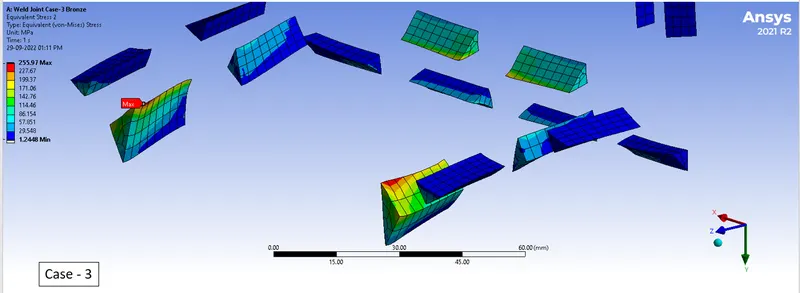
Fig. 13 Higher stress weld joints
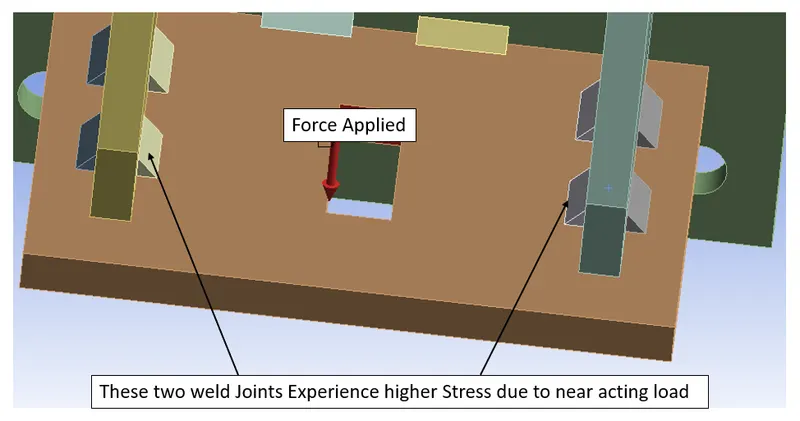
Fig.14 Higher Stress Weld Joint Location.
This is the region where the stress is higher and it tends to fail or crack easily.
CONCLUSION:
The analysis was run successfully for all three cases and results were obtained and tabulated.
While comparing the Total Deformation sustained by the models, there is a slight variation in the maximum deformation for all three cases. Case-1 (STAINLESS STEEL) has lesser deformation.
While comparing the Equivalent Stress obtained by all the models, there is a least noticeable variation in the average, minimum and maximum stress. Case-1 (STAINLESS STEEL) has less stress.
While comparing the Equivalent Strain on the ribs obtained by all the models, there is a least noticeable variation in the average, minimum and maximum stress. Case-2 (ALUMINUM ALLOY) has lesser Strain on the ribs.
Finally on comparing the Equivalent Stress on the weld joints, Case-2 (ALUMINUM ALLOY) has lesser stress on the weld joints.
Recommended Weld Material: ALUMINUM ALLOY
Since Aluminum Alloy weld joint has less stress and Safety Factor is also as close as to the Stainless-Steel Weld joints. The order of weld joint material (Based on Stresses on weld joint) is as follows:
Aluminum Alloy>> Stainless-Steel (or) Bronze