Week 3 - Solving second order ODEs
Aim :- To Write a program in Matlab that will simulate the pendulum motion
Objectives :-
> program to solve second order ODE
> making animation of pendulum motion
Theory :-
ODE-ordinary differential equations
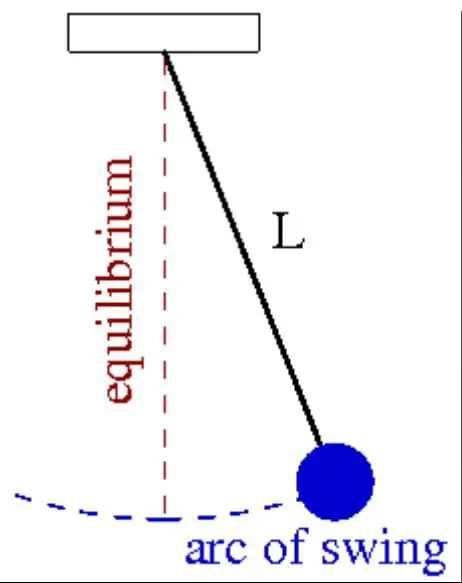
second order ODE of pendulum motion
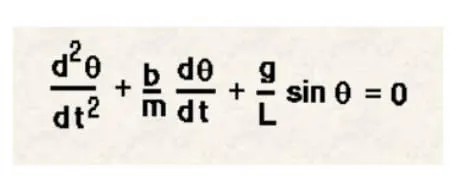
b=damping coefficient
m=mass of ball in kg
g=gravity m/s2
L=length of pendulum in m
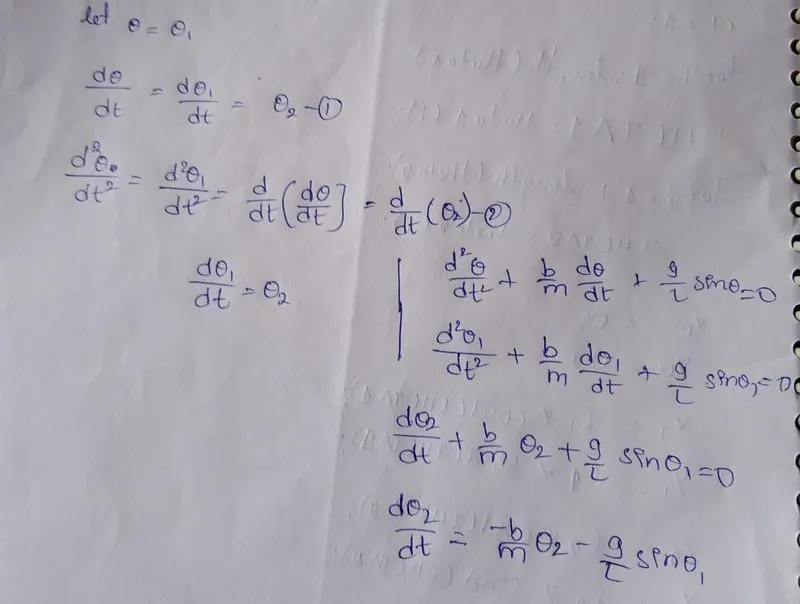
conversion :-
Input prameters:-
length(L)=1 m
mass(m)=1kg
Damping coiefficient (b)=0.05
Acceleration due to gravity(g)=9.81m/s2
velocity=3 rad/sec at time t=0
SAMPLE CODE :-
function code
function[dtheta_dt]=ode_func(t,theta,b,g,l,m)
theta1=theta(1)
theta2=theta(2)
dtheta1_dt=theta2;
dtheta2_dt=-(b/m)*theta2-(g/l)*sin(theta1);
dtheta_dt=[dtheta1_dt;dtheta2_dt];
end
Explanation2 :-
> second order ODE is simplified to first order ODE by intorducing the term theta1&theta2
> theta1&theta2 is differentiated and the dtheta gives column matrix
Main code :-
clear all
close all
clc
b=0.05;
g=9.81;
l=1;
m=1;
%initial condition
theta_0=[0;3];
%timepoints
t_span=linspace(0,20,500);
%solve ODE
[t,results]=ode45(@(t,theta)ode_func(t,theta,b,g,l,m),t_span,theta_0);
plot(t,results(:,1))
hold on
plot(t,results(:,2))
ylabel('amplitude')
xlabel('time')
grid on

legend({'Displacement(rad)','Velocity(rad/sec)'})
ct=1;

for i=1:length(t_span)

    theta =results(:,1)

        x0=0;
        y0=0;
        x1=l*sin(theta(i));
        y1=-l*cos(theta(i));

        %ploting
        figure(2)
        plot([-1 1],[0 0],'linewidth',20,'color','b');
        hold on
        plot([x0 x1],[y0 y1],'linewidth',2);
        hold on
        plot(x1,y1,'.','markersize', 100)
        hold off
        grid on
        %limits of axis
        axis([-1 1 -1 1]);
        pause(0.1)
        %collecting frames of figures to creat animation
        M(ct)=getframe(gcf);
        ct=ct+1;
end


movie(M)
videofile=VideoWriter('Simple_pedulum.avi','uncompressed AVI');
open(videofile)
writeVideo(videofile,M)
close(videofile)
Explanation:-
>Initially giving inputs
length,mass,damping coefficient,and acceleration due to gravity
>theta_0=[0;3]
angular displacement=0
angular velocity=3
>t_span
simulating motion betweem 0-20sec with 500 value
> by using ode45 command ODE function is intorduced
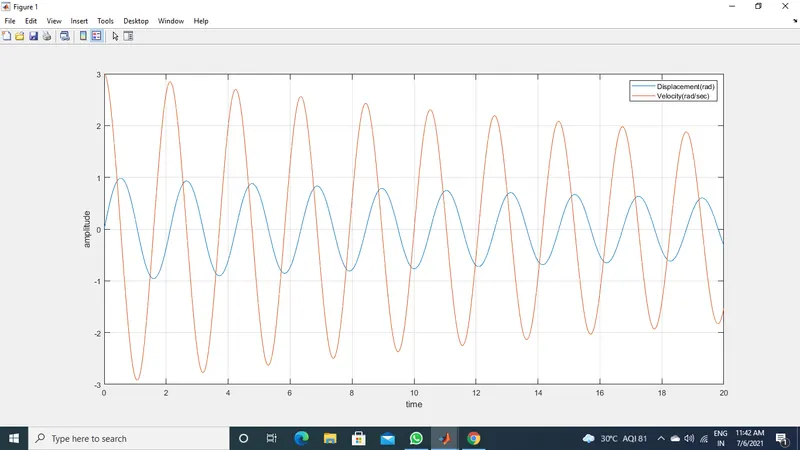
>ploting velocity and displacement in y-axis and time in x-axis
> using legend command to identify the both curves
>using the for loop command to create animation
by ploting occilating line ,fixed line and bob
> to save animation vedio use movie command
OUT PUT:-
graph
Errors :-
I get in correct out put
oscillation in up direction
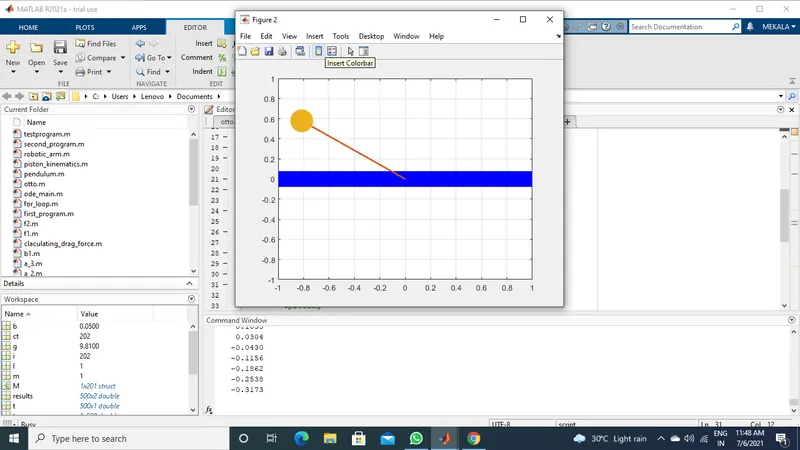
i corrected by (-) at x1&y1