Week 3 - Solving second order ODEs
OBJECTIVE:-
1.0) write a program that solves the following ODE
. 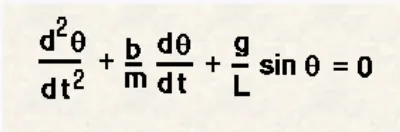
This ODE represents the equation of motion of a simple pendulum with damping
in the above equation,
g = gravity in m/s2,
L = length of the pendulum in m,
m = mass of the ball in kg,
b=damping coefficient.
2.0) Write a program in Matlab that will simulate the pendulum motion.
use,
L=1 metre,
m=1 kg,
b=0.05.
g=9.81 m/s2.
Simulate the motion between 0-20 sec, for angular displacement=0,angular ve is locity=3 rad/sec at time t=0.
THEORY:-
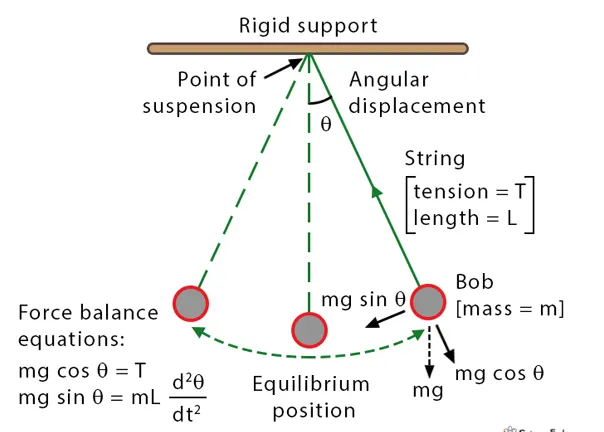
A simple pendulum is a mechanical system of mass attached to a long massless inextensible string that performs oscillatory motion( a motion repeating itself it means an object oscillates about an equilibrium position).
now a day pendulum keep track of time. it is also used for identifying the musical beats.
the time period of the real simple pendulum remains constant but amplitude is changed( if acceleration due to gravity is change then only time period is changed). the time period is also depends on the length of the string for which the Bob is attached.
Damped system ( example-vehicle suspenssion system)
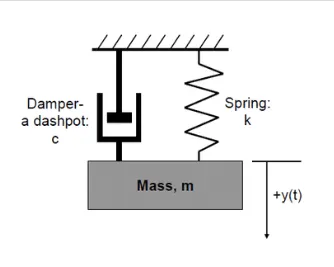
THE EQUATION OF DAMPED SYSTEM IS
Solution program or animation program for given second order ODE in MATLAB:
clear all

close all

clc

% input data

b = 0.05;                      % damping coefficient

g = 9.81;                      % acceleration due to gravity(m/s^2)

l = 1;                         % length of the pendulum (meter)

m = 0.1;                       % mass of the ball in (kg)

% initial condition

theta_0 = [0,3];           % angular displacement is 0, angular velocity is 3rad/sec.

% time points

t_span = linspace(0,20,500);   % time span zero to 20 sec and 500 values in between.

% solve ODE

[t, result] = ode45(@(t,theta)ode_function(t, theta, b, g, l, m),t_span,theta_0);

plot(t,result(:,1))

hold on

plot(t,result(:,2))

ylabel('plot')
xlabel('time')
grid on

theta2 = result(:,1);


ct = 1

for i = 1:length(theta2);
    theta_x = theta2(i);

    x0=0;
    y0=0;

    x1 = l*sin(theta_x);

    y1 = -l*cos(theta_x);

    % plotting the pendulum

    figure(2)
    plot([-0.25 0.25],[0,0],'color','b','linewidth',7);

    hold on

    plot([x0 x1],[y0 y1],'color','r','linewidth',3)

    hold on
     plot(x1,y1,'o','MarkerSize',10,'markerfacecolor','y')

     hold off
     grid on
     axis([-1.5 1.5 -1.5 0.5]);

     pause(0.0003)

     M(ct) = getframe(gcf);
     ct = ct+1;

end

movie(M)
videofile = VideoWriter('pendulum_motion.avi','Uncompressed AVI');
open(videofile)
writeVideo(videofile,M)
close(videofile)
PROCEDURE:
- first we convert this 2nd order ODE into first order then we make a function.
- Defining the input data, such as angular displacement, angular velocity, time, length, g, mass,damping coefficient(b).
- define initial condition there are two first order ODE one for displacement and another for velocity. initial displacement of the the pendulum is zero and initial velocity is 3red/sec.
- t_span is time array start from t=0 to t=20sec and 500value taken in between.
- called our ODE function by using syntax ode45. t and theta are main inputs but theta and t are dependent and independent variable of ODE.
- now we defining our ode function (t,theta,b,g,l,m) input parameter we will be passing after that.
program for function:
function[dtheta_dt] = ode_function(t, theta, b, g, l, m)

theta1 = theta(1)
theta2 = theta(2)
dtheta1_dt = theta(2)
dtheta2_dt = -(b/m)*theta2-(g/l)*sin(theta1);
dtheta_dt = [dtheta1_dt;dtheta2_dt];

end
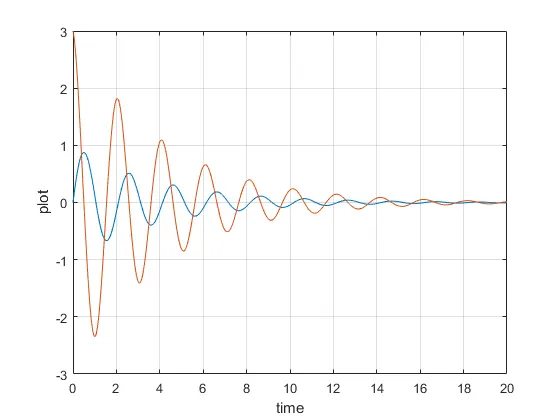
- then we geting result which having two column one has displacement and other have angular velocity.
- plot both with the help of plot command.
WORKSPACE
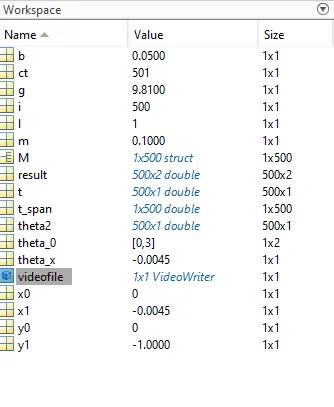
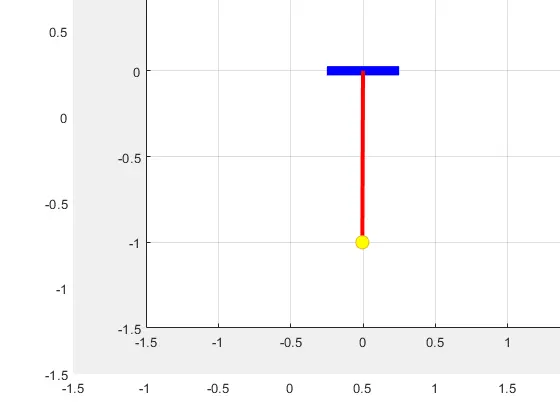
now we are interested to create animation
- use for loop
- set the initial condition of x = 0 and y = 0
- vary x and y with respect to theta_x.
- set the range of x and y.
- use marker command to create a spherical Bob.
- create a movie with different frame.
- play the movie in matrix M
- assign file name and file format.
- open the video file.
- write the video with the plot frame.
- close the video.
ERRORS:-
1.0) we miss the comma(,)
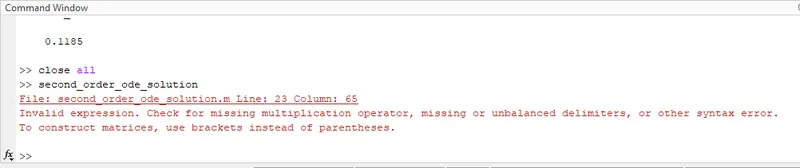 solution:- miss the comma(,) check and fix it.
2.0) we take wrong value of ct.
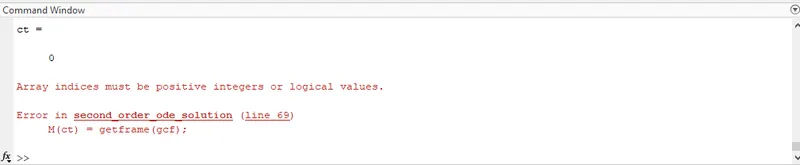 solution:- we fix this error by taking ct=1.
3.0) miss to write theta2=result(:,1); before starting the for loop
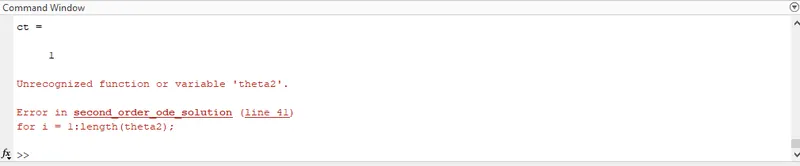 solution:- check and fix it.
4.0) variable assigning mistake
 solution:- we fix videowriter to VideoWriter.
YOUTUBE LINK:- https://www.youtube.com/watch?v=rfWBuvbhAs0