Week 3 - Solving second order ODEs
Aim :
To write a program to simulate the transient behaviour of a simple pendulam and to creat an animation.
In the above equation,
g = gravity in m/s2,
L = length of the pendulum in m,
m = mass of the ball in kg,
b=damping coefficient.
Write a program in Python that will simulate the pendulum motion, just like the one shown in the start of this challenge.
use,
L=1 metre,
m=1 kg,
b=0.05.
g=9.81 m/s2.
Simulate the motion between 0-20 sec, for angular displacement=0,angular velocity=3 rad/sec at time t=0.
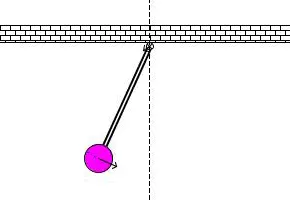
When you do this you will get the position of the pendulum as a function of time. Use this information to animate the motion of the pendulum, as shown in the below figure.
Code:
import numpy as np
from scipy.integrate import odeint
import matplotlib.pyplot as plt
import math
def model(theta,t,b,l,g,m):
theta1 = theta[0]
theta2 = theta[1]
dtheta1_dt = theta2
dtheta2_dt = -(b/m)*theta2 -(g/l)*math.sin(theta1)
dtheta_dt = [dtheta1_dt,dtheta2_dt]
return dtheta_dt
#function that returns dz/dt
b = 0.02
g = 9.81
l = 1
m = 0.1
# initial condition
theta_0 = [0,5]
# time points
t = np.linspace(0,20,200)
theta = odeint(model,theta_0,t,args=(b,l,g,m))
plt.plot(t,theta[:,0],'b-',label = 'Angular dispacement')
plt.plot(t,theta[:,1],'--',label = 'Angular velocity')
plt.legend(loc='best')
plt.xlabel('plot')
plt.ylabel('time')
plt.show()
# Animation step
ct = 1
x0 = 0
y0 = 0
for i in theta[:,0]:
x1 = +l*math.sin(i)
y1 = -l*math.cos(i)
filename = 'pendulam'+str(ct)+'.png'
ct = ct+1
plt.figure()
plt.plot([-3,3],[0,0],'r')
plt.plot([x0,x1],[y0,y1],'g')
plt.plot(x1,y1,marker ='o',markersize ='10')
plt.savefig(filename)
Code Explanation:
- Initially we are importing required modules using 'import' command
- Function model is created with required arguments, inside which the term which are broken to solve second order ODE are calculated
- Inputs are provided for the function.
- theta_0 ranges between 0 to 3 m/s^2
- odient command is used to solve ode function
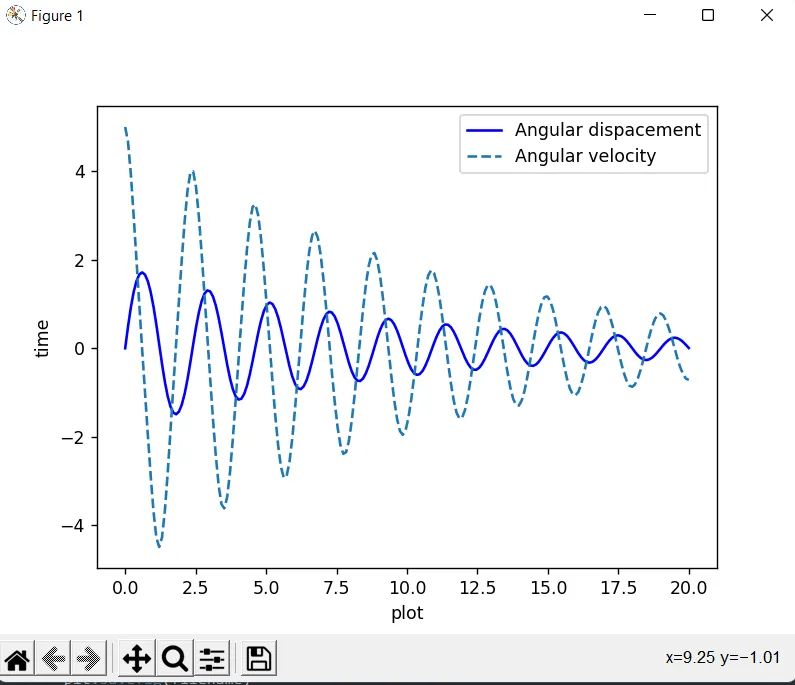
- then result are plotted using plotting command
- for creating animation we open a for loop, ranging from 0 to length of t
- images are saved using savefig command
Output:
Animation :
Animation video ig given below link