Project 1 - Parsing NASA thermodynamic data
Aim :
To parse the NASA thermodynamics data and to calculate the molecular weigth of the species and the plot the cp,enthalpy,entropy for the local temperature range for o2,n2,co2
Theory:
Definition
File Parsing: parsing a file means to split a file or other input into pieces of data that can easily stored or manipulated.so , we are splitting a spring into parts then regconize the part to convert it into something similar than a string
Enthalpy: A thermodynamics quantity equivalent to the total heat content of a system.it is equal to the internal energy of the system plus the product of pressure and volume
Entropy: A thermodynamics quantity representative the unavailability of a system thermal energy for conversion into mechanical work, often interpreted as the degree of disoder of randomness in the system
specific heat: is the amount of heat per unit mass required to raise temperature by one degree celsius
Molecular weigth: Molecular weigth is the weigth of the given molecules
Atomic mass: The mass of an atom of a chemical expressed in atomic mass units. it is approximately equivalent to a number of protons and neutrons in the atom or the average number following for the relative abudance of different isotropes
Equation:
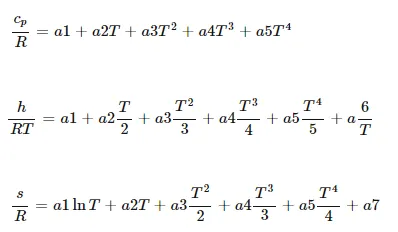
where
cp = specific heat
R = universal gas constant
h = enthalpy
s = entropy
T = temperature
Main program :
clear all
close all
clc
%gas constant
R = 8.314;
%Reading first two lines
f1 = fopen('THERMO.dat','r');
tline1 = fgetl(f1);
tline2 = fgetl(f1);
temp = strsplit(tline2,' ');
global_low=str2num(temp{2});
global_mid=str2num(temp{3});
global_high=str2num(temp{4});
T = linspace(global_low,global_high,500);
%skipping next three lines
for i = 1:3
skippedlines = fgetl(f1);
end
for i=1:53
tline3 = fgetl(f1);
S = strsplit(tline3, ' ');
species_name= S{1};
A = strfind(tline3,'G');
temp_values=tline3(A+4: length(tline3));
B = strsplit(temp_values, ' ');
local_low_temp =str2double(B{1});
local_mid_temp =str2double(B{2});
local_high_temp =str2double(B{3});
tline4 = fgetl(f1);
f = strfind(tline4,'E');
a1=str2double(tline4(1:(f(1)+3)));
a2=str2double(tline4(f(1)+4:(f(2)+3)));
a3=str2double(tline4(f(2)+4:(f(3)+3)));
a4=str2double(tline4(f(3)+4:(f(4)+3)));
a5=str2double(tline4(f(4)+4:(f(5)+3)));
tline5 = fgetl(f1);
a6=str2double(tline5(1:(f(1)+3)));
a7=str2double(tline5(f(1)+4:(f(2)+3)));
a8=str2double(tline5(f(2)+4:(f(3)+3)));
a9=str2double(tline5(f(3)+4:(f(4)+3)));
a10=str2double(tline5(f(4)+4:(f(5)+3)));
tline6 = fgetl(f1);
a11=str2double(tline6(1:(f(1)+3)));
a12=str2double(tline6(f(1)+4:(f(2)+3)));
a13=str2double(tline6(f(2)+4:(f(3)+3)));
a14=str2double(tline6(f(3)+4:(f(4)+3)));
C_P =specific_heat_calc_func(a1,a2,a3,a4,a5,a8,a9,a10,a11,a12,local_mid_temp,T);
S=entropy_calc_func(a1,a2,a3,a4,a5,a7,a8,a9,a10,a11,a12,a14,local_mid_temp,T);
H= enthalpy_calc_func(a1,a2,a3,a4,a5,a6,a8,a9,a10,a11,a12,a13,local_mid_temp,T);
% req_species =["O2","N2","CO2"];
% creating a folder
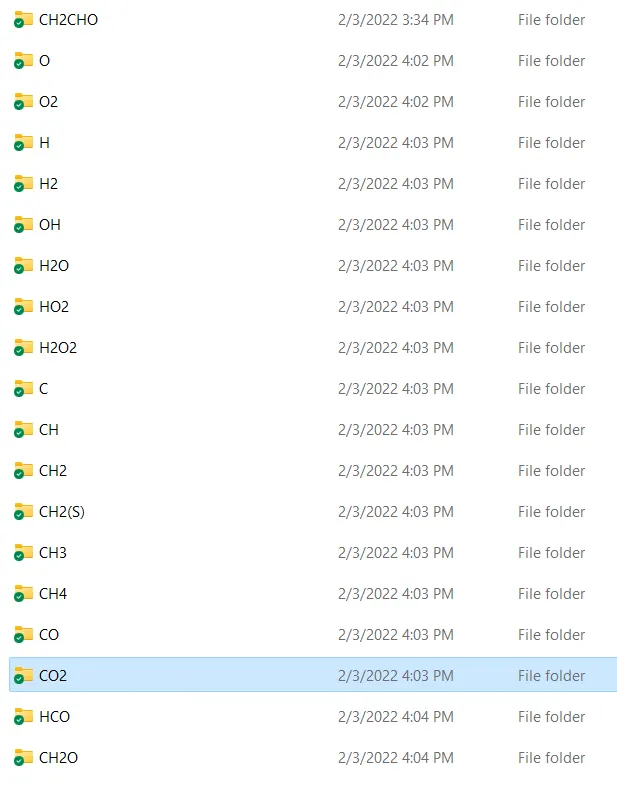
mkdir(['C:\Users\91770\Dropbox\PC\Documents\MATLAB\',species_name])
%plotting for temperature Vs specific heat
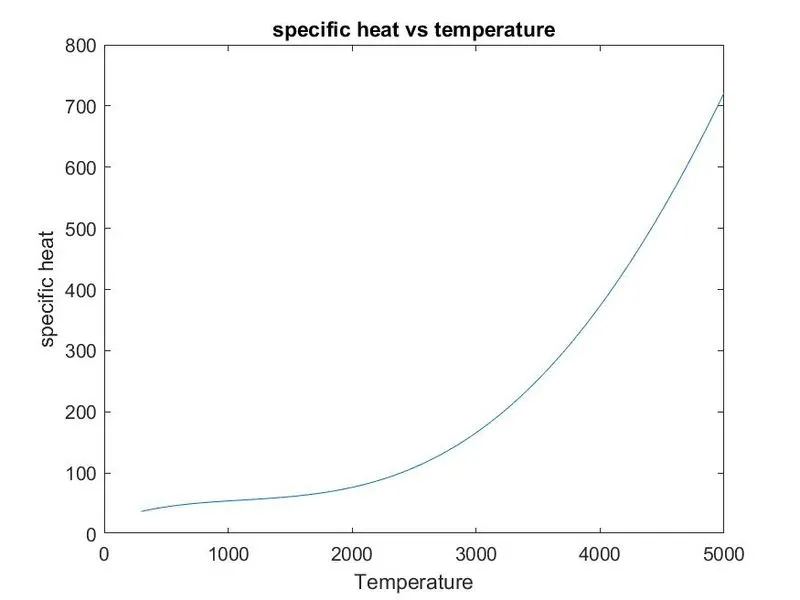
figure(1)
plot(T,C_P)
title('specific heat vs temperature')
xlabel('Temperature')
ylabel('specific heat')
%plotting for temperature Vs enthalphy
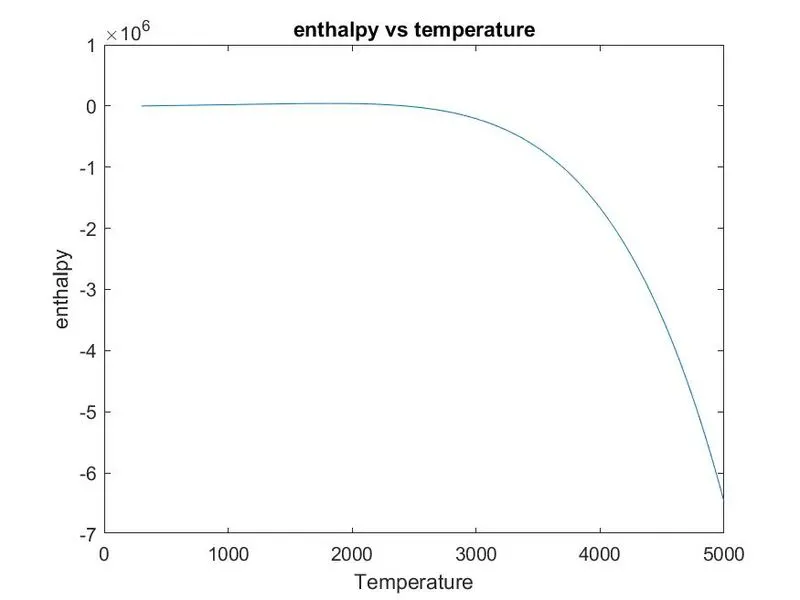
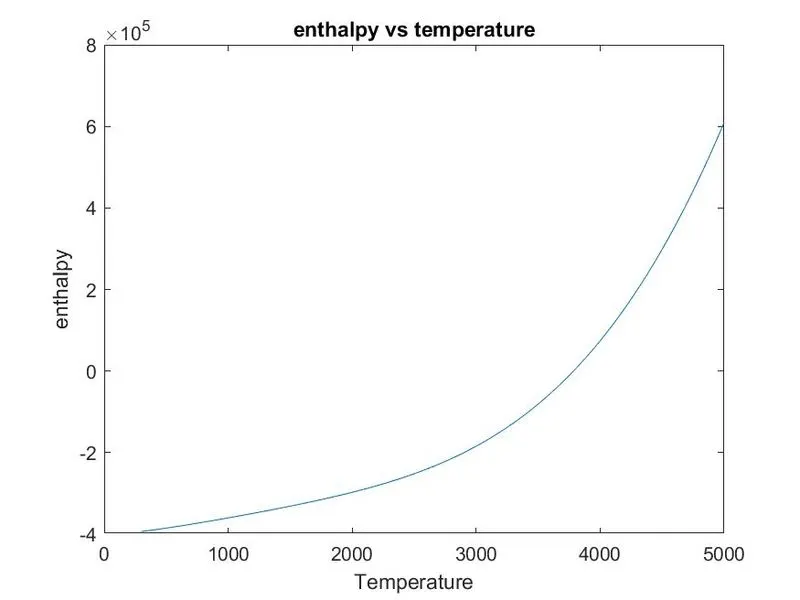
figure(2)
plot(T,H)
title('enthalpy vs temperature')
xlabel('Temperature')
ylabel('enthalpy')
%plotting for temperature Vs entropy
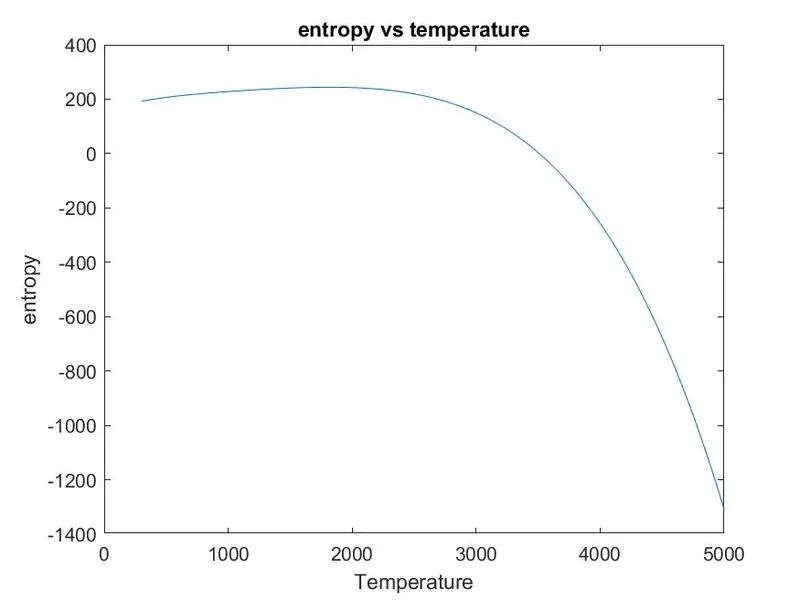
figure(3)
plot(T,S)
title('entropy vs temperature')
xlabel('Temperature')
ylabel('entropy')
cd(['C:\Users\91770\Dropbox\PC\Documents\MATLAB\',species_name])
saveas(1,'specific heat','jpg')
saveas(2,'enthalpy','jpg')
saveas(3,'entropy','jpg')
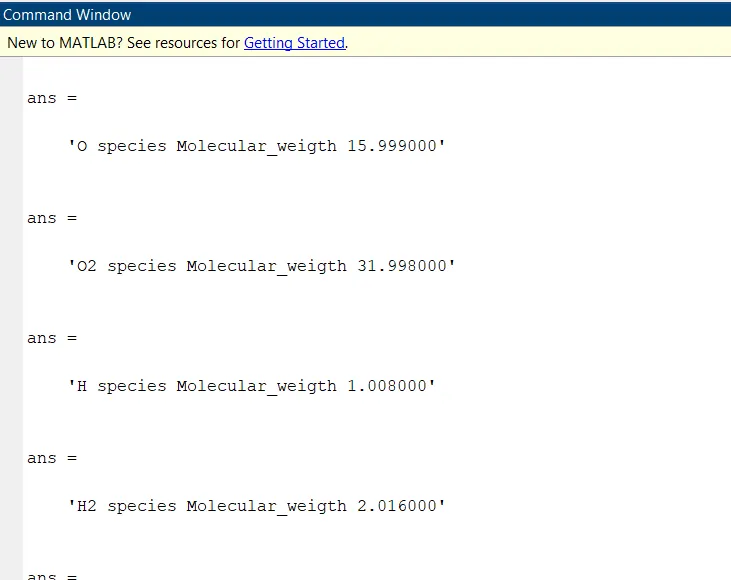
Molecular_weigth = Molecular_weigth_func(species_name);
end
fclose(f1);
Specific Heat Function:
function[C_P] = specific_heat_calc_func(a1,a2,a3,a4,a5,a8,a9,a10,a11,a12,local_mid_temp,T)
R = 8.314;
if (T>local_mid_temp)
C_P = R*(a1+(a2*T)+(a3*(T.^2))+(a4*(T.^3))+(a5*(T.^4)));
else
C_P = R*(a8+(a9*T)+(a10*(T.^2))+(a11*(T.^3))+(a12*(T.^4)));
end
Enthalpy Function:
function[H] = enthalpy_calc_func(a1,a2,a3,a4,a5,a6,a8,a9,a10,a11,a12,a13,local_mid_temp,T)
R = 8.314;
if (T>local_mid_temp)
H = ((a1+((a2*T)/2)+(a3*(T.^2))/3)+((a4*(T.^3))/4)+((a5*(T.^4))/5)+(a6./T)).*T*R;
else
H = ((a8+((a9*T)/2)+((a10*T.^2))/3)+((a11*(T.^3))/4)+((a12*(T.^4))/5)+(a13./T)).*T*R;
end
Entropy Function:
function[S] = entropy_calc_func(a1,a2,a3,a4,a5,a7,a8,a9,a10,a11,a12,a14,local_mid_temp,T)
R = 8.314;
if (T>local_mid_temp)
S = R*(a1*logT)+(a2*T)+((a3*(T.^2))/2)+((a4*(T.^3)/3)+(a5*(T.^4)/4)+a7);
else
S = R*((a8*log(T)+(a9*T)+(a10*(T.^2)/2)+(a11*(T.^3))/3)+(a12*(T.^4)/4)+a14);
end
Molecular Function:
function[M]= Molecular_weigth_func(species_name)
Atomic_mass= [15.999,1.008,12.011,14.007,39.948];
Elements = ['O','H','C','N','A'];
Mol_wt = 0;
for i = 1:length(species_name)
for j = 1:length(Elements)
if strcmpi(species_name(i),Elements(j))
Mol_wt = Mol_wt+Atomic_mass(j);
z=j;
end
end
T = str2double(species_name(i));
if(T>1)
Mol_wt=Mol_wt+(Atomic_mass(z)*(T-1));
end
end
M= Mol_wt;
sprintf('%s species %s %f',species_name,'Molecular_weigth',M)
end
Output:
For O2
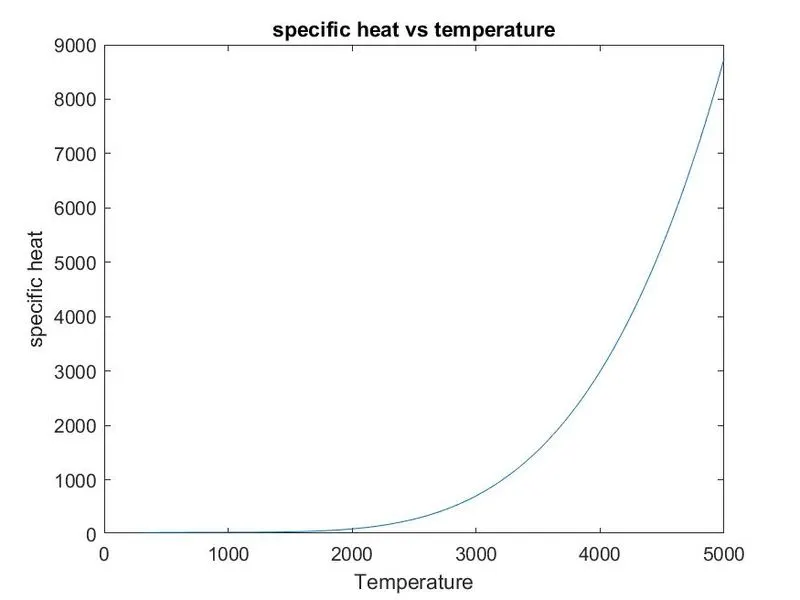
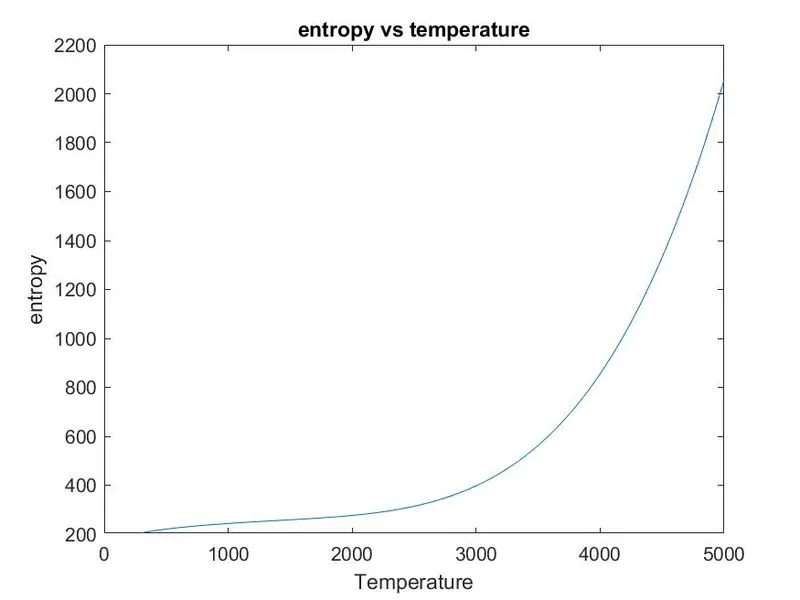
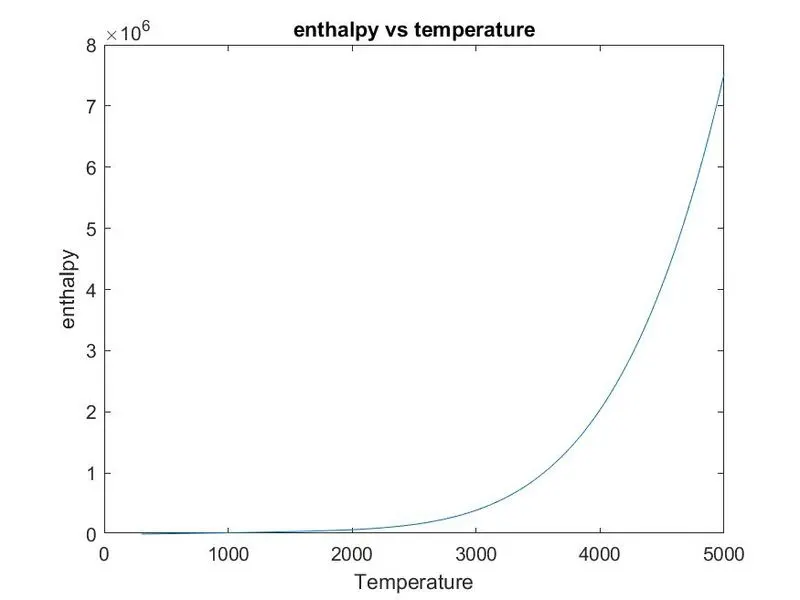
For N2
For CO2
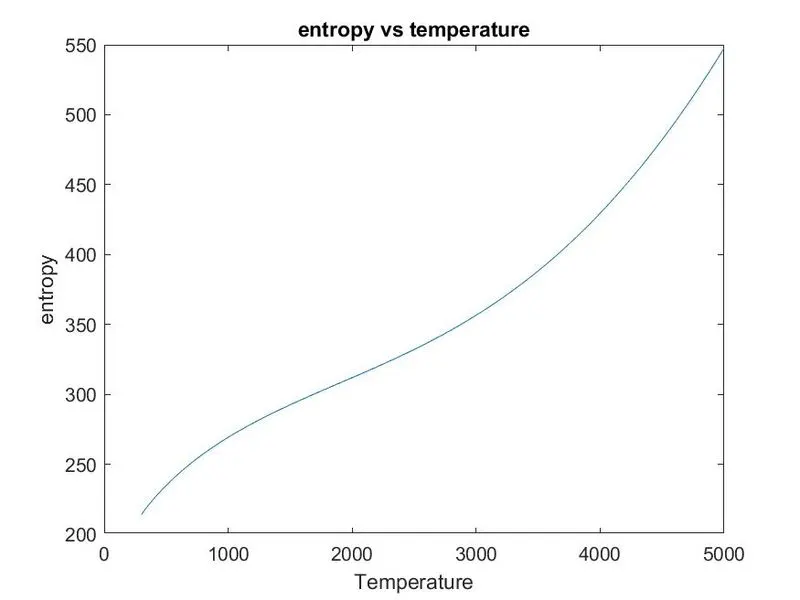
For 53 species
Molecular weigth
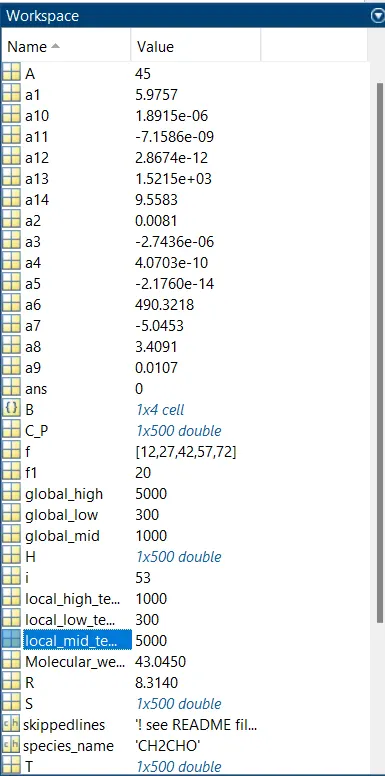
workspace
Result:
- The code for the species is done
- N2,O2,Co2 graph is plotted
- Molecular weigth of every element is found
- files are created