Week 3 - Solving second order ODEs
AIM:
To write a MATLAB program to solve an ODE.
GIVEN:
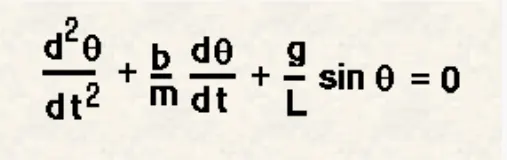
The equation of motion of a simple pendulum with damping.
1. A MATLAB program to create a Function.
% ode45 is the inbuilt solver for ODE in MATLAB.
function [dtheta_dt]= ode_func(b,g,L,m,t,theta)
theta1 = theta (1);
theta2 = theta(2);
dtheta1_dt = theta2;
dtheta2_dt = -(b/m)*theta2-(g/L)*sin(theta1);
dtheta_dt = [dtheta1_dt;dtheta2_dt]
end
2. A MATLAB program to solve an ODE that represents the equation of motion of a simple pendulum with damping.
% A MATLAB program to solve an ODE.
clear all
close all
clc
% Required Inputs.
% Gravity in m/s^2.
g = 9.81;
% Length of pendulum in m.
L = 1;
% Damping coefficient.
b = 0.05;
% Mass of the Pendulum bob in kg.
m = 1;
% Angular displacement.
ad = 0;
% Angular velocity in rad/sec at time t=0.
av = 3;
% Initial conditions.
theta_0 = [0;3];
% Time points.
t_span = linspace(0,20,100);
% To solve an ODE.
[t,result] = ode45 (@(t,theta) ode_func(b,g,L,m,t,theta),t_span,theta_0);
% Plotting pendulum motions.
figure (1)
hold on
plot (t,result(:,1),'color','r');
plot (t,result(:,2),'color','y');
ylabel ('Displacement/velocity')
xlabel ('Time')
legend ('Displacement','Velocity')
% To create animation Video using ct command.
ct = 1;
for i = 1:length(t)
x0 = 0;
y0 = 0;
x1 = L*sin(result(i,1));
y1 = -L*cos(result(i,1));
figure (2)
plot([-2 2],[0 0],'LineWidth',3,'Color','r');
line ([x0 x1],[y0 y1],'LineWidth',3);
axis ([-1.5 1.5 -1.5 1.5])
hold on
plot (x1,y1,'o');
hold off
grid on
% Giving pause to the bob motions.
pause (0.05);
% Storing Plot.
M(ct) = getframe(gcf)
% Increment in ct will help to create plot with multiple time points
% which will store in M.
ct = ct+1;
end
% Making movie combining simulated results.
movie (M)
% Making a video file of movie created in .avi format.
videofile = VideoWriter ('SECOND_ORDER_ODE.avi','Uncompressed AVI');
open (videofile)
% Adding video to the video file created above.
writeVideo (videofile,M)
close (videofile)
RESULTS
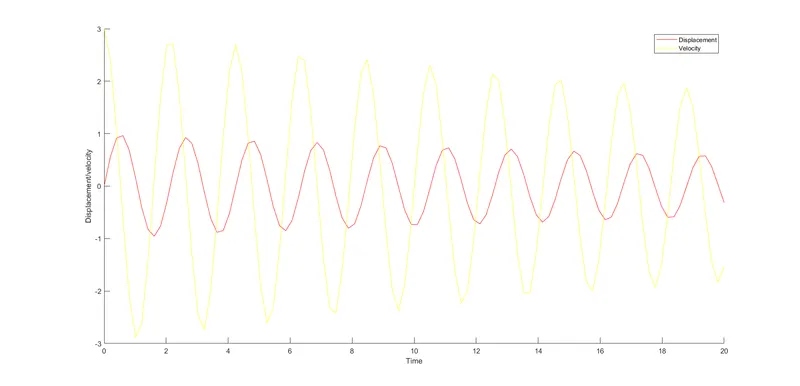
And, The video link is:
https://drive.google.com/file/d/1sr_crl4mVira4x0n9JbpNbik1BPitdFb/view?usp=sharing
ERROR FACED AND ITS SOLUTION:
1. Here, In line 64, while drawing, there was a syntax error which was corrected later.

Corrected Syntax.
plot (x1,y1,'o');
2. Five errors occurred while executing the programs.

* Variable 'L' was mistyped as 'l' and was edited later.
* There was an error in the assigned function syntax which was emitted later.