Project 1 - Parsing NASA thermodynamic data
AIM:
- To write a function in MATLAB to extract the 14 coefficients and to calculate the enthalpy, entropy, and specific heat for all the species in the data file.
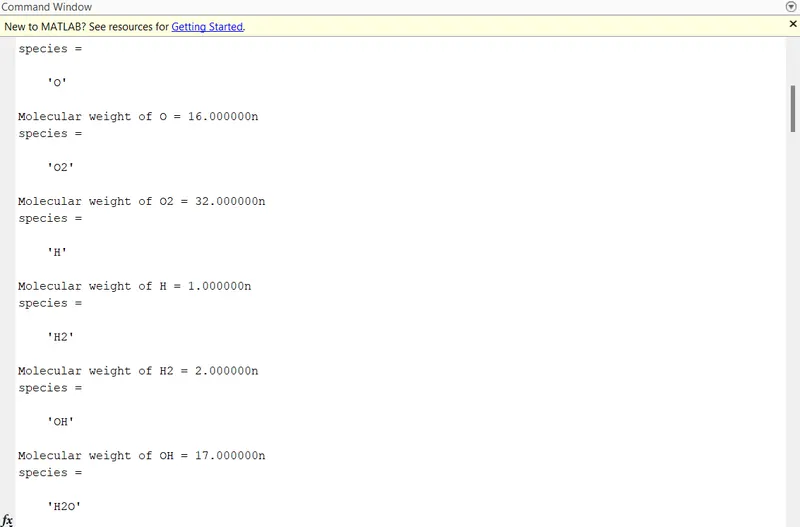
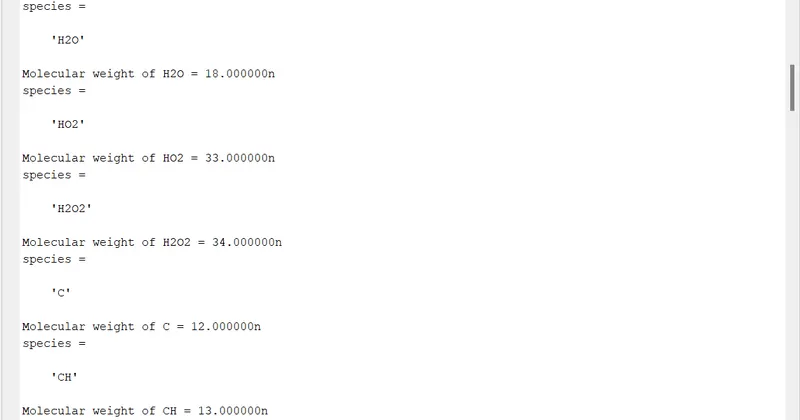
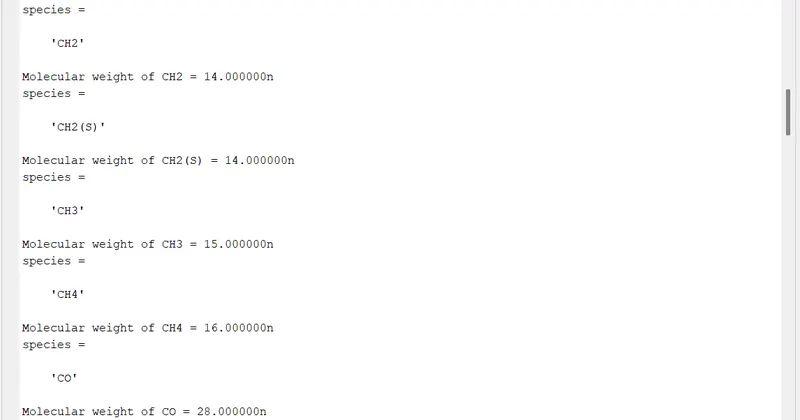
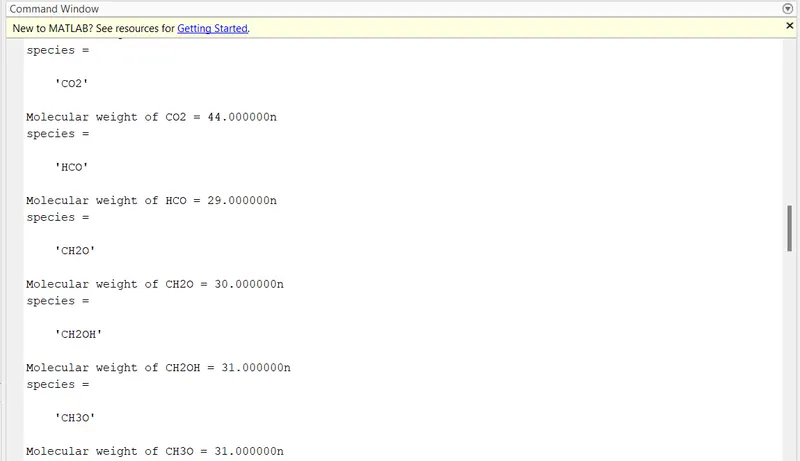
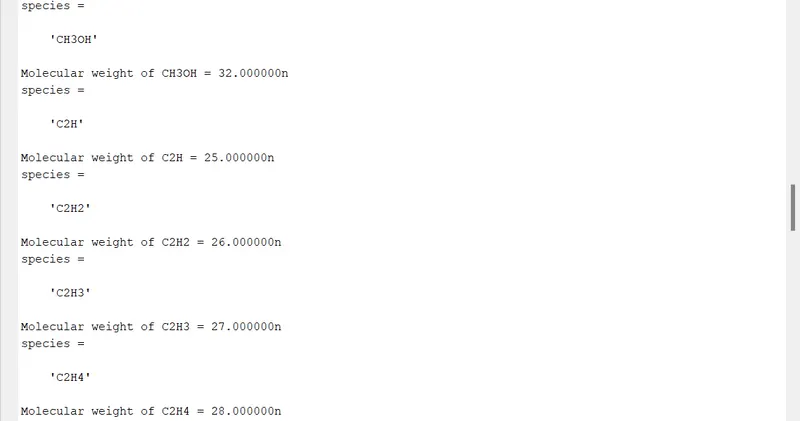
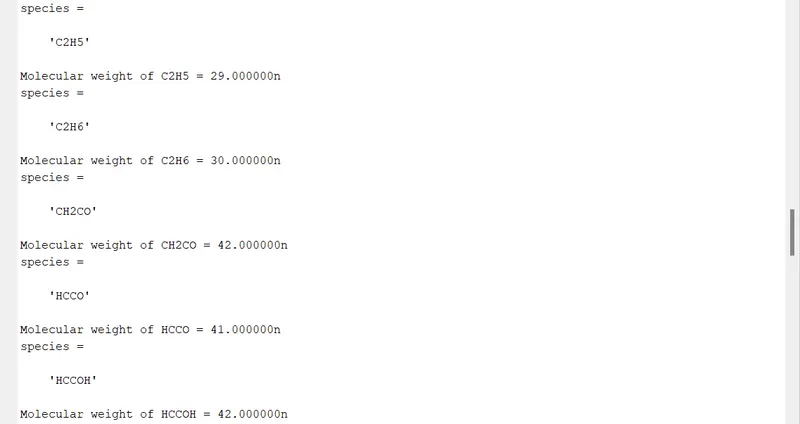
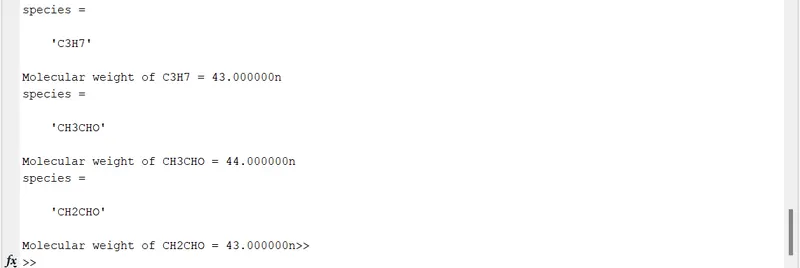
- To calculate the molecular weight of each species and display it in the command window.
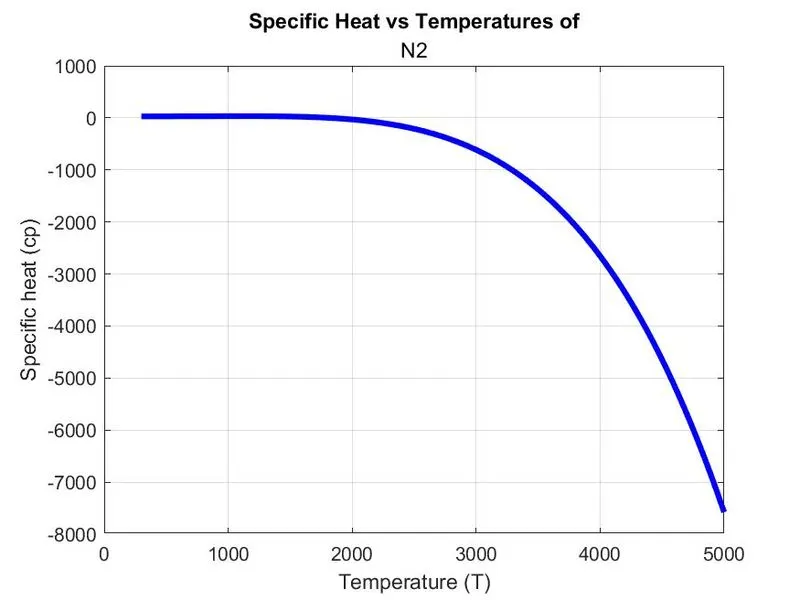
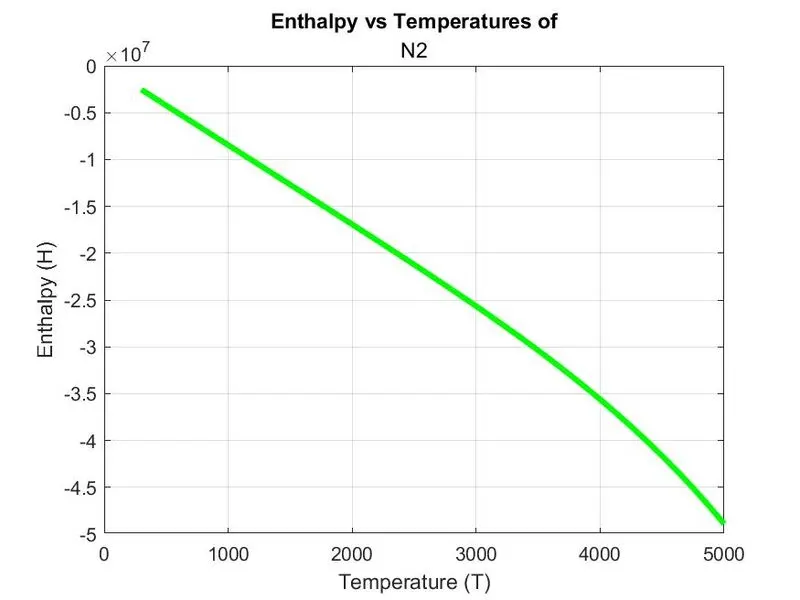
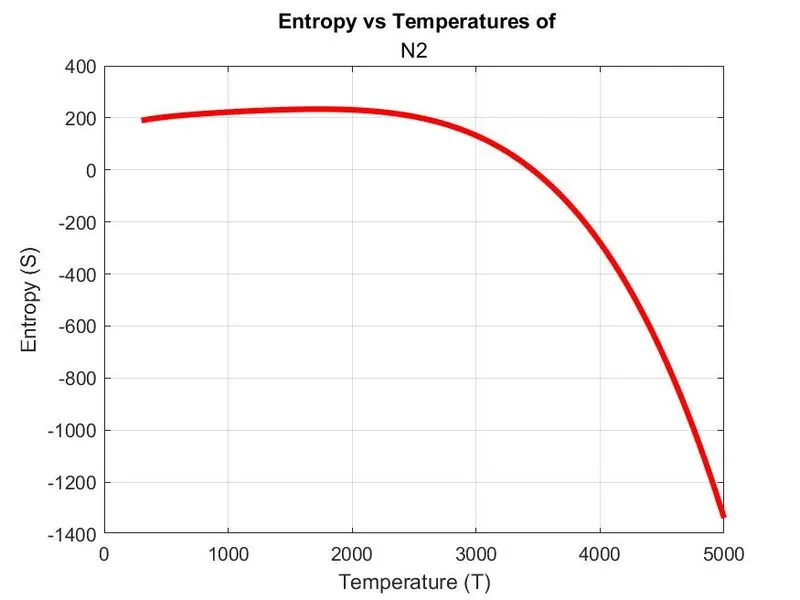
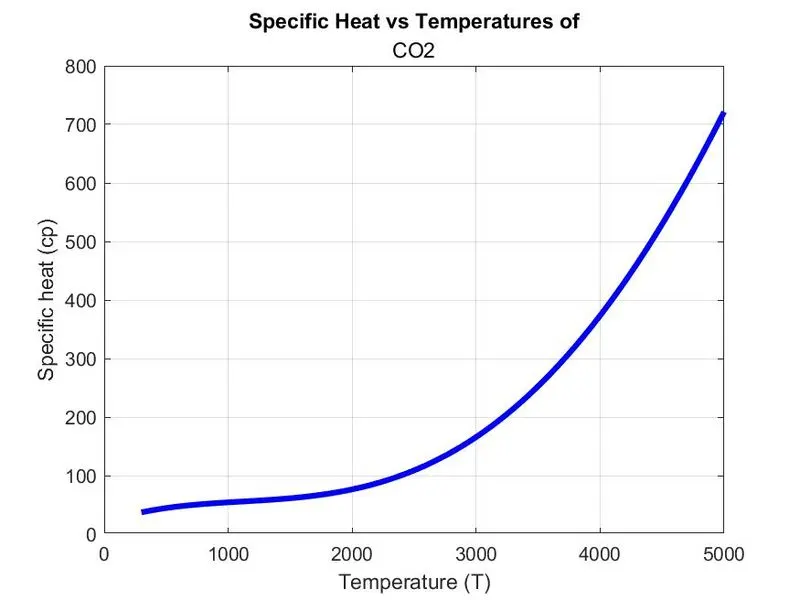
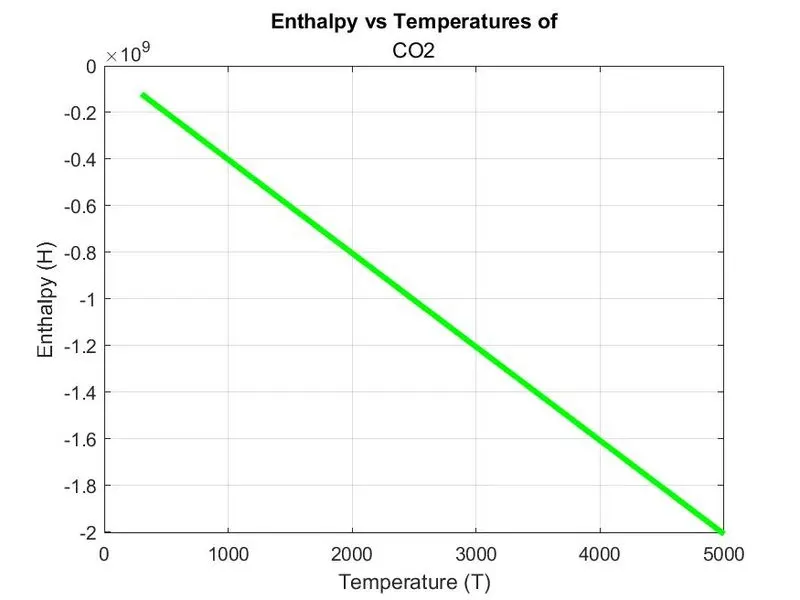
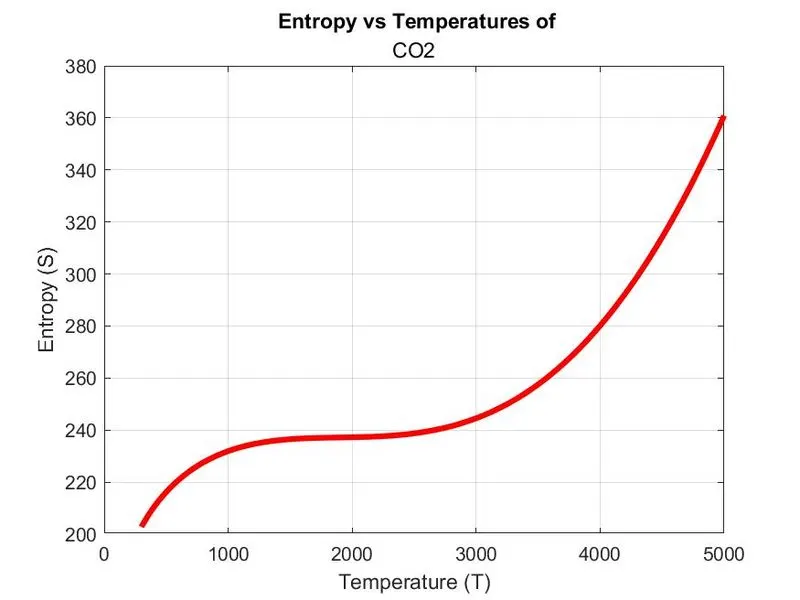
- To plot the specific heat, enthalpy, and entropy for the local temperature range specified for each species.
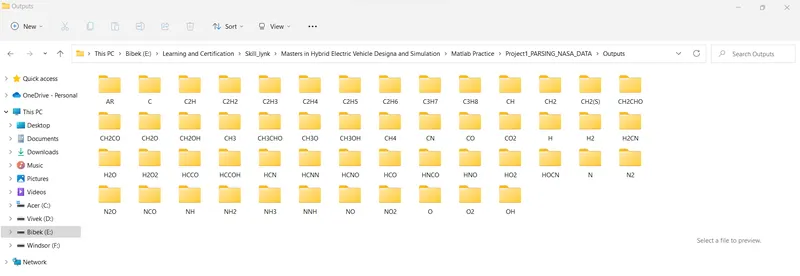
- To save the plot as images with a specific name and store them in a separate folder for each species using MATLAB code.
GIVEN:
- NASA THERMODYNAMICS DATA FILE: " THERMO.dat "
- The equations that we are going to use to create functions for Specific heat, Enthalpy, and Entropy are as follows.

where; R is the Universal gas constant and T is the Temperature.
THEORY:
Data Parsing: Data parsing basically refers to taking the data stored in a file in one format and transforming it into another format as desired and can manipulate as required.
Thermodynamic Properties:
- Specific Heat (cp): The specific heat is the amount of heat per unit mass required to raise the temperature by one degree Celsius. The SI unit of specific heat capacity is joule per kelvin per kilogram, J⋅kg−1⋅K−1.
- Enthalpy (H): Enthalpy is the sum of the system's internal energy and the product of its pressure and volume. The SI unit of measurement for enthalpy is the joule (J).
- Entropy (S): A measure of the unavailable energy in a closed thermodynamic system that is also usually considered to be a measure of the system's disorder, that is a property of the system's state, and that varies directly with any reversible change in heat in the system and inversely with the temperature of the system. The SI unit of measurement for entropy is joules per kelvin (J⋅K−1)
1. WRITING MATLAB CODES TO CREATE FUNCTIONS.
- A MATLAB code to create a function: Specific Heat (cp).
% A MATLAB program to call Function - Specific Heat.
function cp = specific_heat(a1,a2,a3,a4,a5,a8,a9,a10,a11,a12,T,R,G_midtemp)
% Calculating Specific heat using the formula given.
% For temperature greater than or equals to G_midtemp.
if (T>= G_midtemp)
cp = R*(a1+(a2*T)+(a3*(T).^2)+(a4*(T).^3)+(a5*(T).^4));
% For temperature Smaller than G_midtemp.
else
cp = R*(a8+(a9*T)+(a10*(T).^2)+(a11*(T).^3)+(a12*(T).^4));
end
end
Explanation:
- A function named, cp was called.
- Specific heat was defined for lower and higher temperatures.
- A MATLAB code to create a function: Enthalpy (H).
% A MATLAB program to call Function - Enthalphy.
function H = Enthalpy(a1,a2,a3,a4,a5,a6,a8,a9,a10,a11,a12,a13,T,R,G_midtemp)
% Calculating Enthalpy using the formula given.
% For temperature greater than or equals to G_midtemp.
if (T>= G_midtemp)
H = R*T.*((a1+(a2*T)/2)+((a3*(T).^2)/3)+((a4*(T).^3)/4)+((a5*(T).^4)/5)+ a6);
% For temperature Smaller than G_midtemp.
else
H = R*T.*((a8+(a9*T)/2)+((a10*(T).^2)/3)+((a11*(T).^3)/4)+((a12*(T).^4)/5)+ a13);
end
end
Explanation:
- A function named, H was called.
- Enthalpy was defined for lower and higher temperatures using the formula given.
- A MATLAB code to create a function: Entropy (S).
% A MATLAB program to call Function - Entropy.
function S = Entropy(a1,a2,a3,a4,a5,a7,a8,a9,a10,a11,a12,a14,T,R,G_midtemp)
% Calculating Entropy using the formula given.
% For temperature greater than or equals to G_midtemp.
if (T>= G_midtemp)
S = R*((a1.*log(T)+(a2*T)/2)+((a3*(T).^2)/2)+((a4*(T).^3)/3)+((a5*(T).^4)/4)+ a7);
% For temperature Smaller than G_midtemp.
else
S = R*((a8.*log(T)+(a9*T)/2)+((a10*(T).^2)/2)+((a11*(T).^3)/3)+((a12*(T).^4)/4)+ a14);
end
end
Explanation:
- A function named, S was called.
- Entropy was defined for lower and higher temperatures using the formula given.
- A MATLAB code to calculate Molecular weight by creating a function: Molecular Weight (M_W).
% A MATLAB program to call Function - Molecular weight.
function M_W = Molecular_weight(species_name)
% Calculating Molecular weight.
% Elements: Hydrogen, Carbon, Nitrogen, Oxygen, Sulphur, and Argon.Elements = ['H', 'C', 'N', 'O', 'A'];
Atomic_weight = [1 12 14 16 40];
species = upper(species_name)
% Starting range of molecular weight.
M_W= 0;for i = 1:length(species)
for j=1:length(Elements)
if strcmp (species (i), Elements(j))
M_W = M_W+Atomic_weight(j);
k = j;
else
n = str2double (species(i));
if (n>1)
M_W = M_W + Atomic_weight (k)*(n-1);
break
end
end
end
end
end
Explanation:
- A function named, M_W was called.
- Elements and their respective atomic weight were defined.
- 'upper' command was used to convert strings to uppercase.
- Initial molecular weight was taken as 0.
- For loop was used to read the molecular weight of all the species.
- 'str2double' command was used to convert strings to double-precision values.
2. WRITING A MATLAB CODE TO PARSE THE NASA THERMODYNAMIC DATA.
% A MATLAB program to execute the funcions created, to plot the cp, H, & S and to print the Molecular weight of each species in the command window.
clear all
close all
clc
% Molar Gas Constant (R).
R = 8.314;
% Opening the data file from local computer.
data = fopen ('THERMO.dat','r')
% Reading the data from data file
l1 = fgetl(data);
l2 = fgetl(data);
value = strsplit(l2,' ');
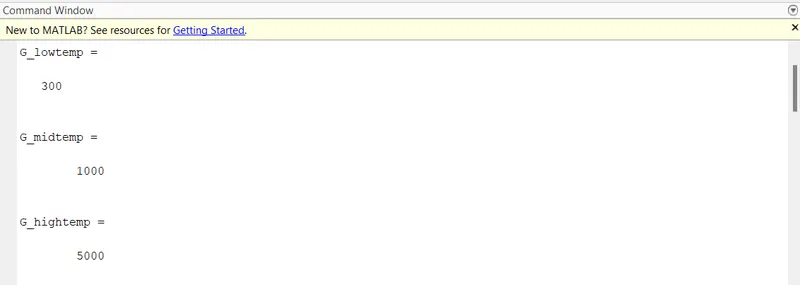
% To read the global temperatures range from the data file.
G_lowtemp = str2num(value{2})
G_midtemp = str2num(value{3})
G_hightemp = str2num(value{4})
% Defining the ranges of temperature
T = linspace (G_lowtemp, G_hightemp, 1000);
% We dont need line 3, 4, and 5. so skipping them.
l3 = fgetl(data);
l4 = fgetl(data);
l5 = fgetl(data);
% To read species using command 'fgetl' and to calculate cp, h, s.
for i = 1:53
tline = fgetl(data);
A = strsplit(tline,' ');
species_name = (A{1});
lowtemp = str2num (A{end-3});
midtemp = str2num (A{end-2});
hightemp = str2num (A{end-1});
% To figure out 7 higher coefficients.
tline1 = fgetl(data);
a = findstr(tline1,'E');
a1 = tline1(1:a(1)+3);
a1 = str2num (a1);
a2 = tline1(a(1)+4:a(2)+3);
a2 = str2num (a2);
a3 = tline1(a(2)+4:a(3)+3);
a3 = str2num (a3);
a4 = tline1(a(3)+4:a(4)+3);
a4 = str2num (a4);
a5 = tline1(a(4)+4:a(5)+3);
a5 = str2num (a5);
tline2 = fgetl(data);
a = findstr (tline2,'E');
a6 = tline2(1:a(1)+3);
a6 = str2num (a6);
a7 = tline2(a(1)+4:a(2)+3);
a7 = str2num (a7);
% To figure out 7 lower coefficients.
a8 = tline2(a(2)+4:a(3)+3);
a8 = str2num (a8);
a9 = tline2(a(3)+4:a(4)+3);
a9 = str2num (a9);
a10 = tline2(a(4)+4:a(5)+3);
a10 = str2num (a10);
tline3 = fgetl(data);
a = findstr (tline3,'E');
a11 = tline3(1:a(1)+3);
a11 = str2num (a11);
a12 = tline3(a(1)+4:a(2)+3);
a12 = str2num (a12);
a13 = tline3(a(2)+4:a(3)+3);
a13 = str2num (a13);
a14 = tline3(a(3)+4:a(4)+3);
a14 = str2num (a14);
% Calculating Specific heat (sp)
cp = specific_heat(a1,a2,a3,a4,a5,a8,a9,a10,a11,a12,T,R,G_midtemp);
% Calculating Enthalpy (H).
H = Enthalpy(a1,a2,a3,a4,a5,a6,a8,a9,a10,a11,a12,a13,T,R,G_midtemp);
% Calculating Entropy (S)
S = Entropy(a1,a2,a3,a4,a5,a7,a8,a9,a10,a11,a12,a14,T,R,G_midtemp);
% Calculating and printing Molecular weight.
M_W = Molecular_weight (species_name);
fprintf('Molecular weight of %s = %fn',species_name,M_W);
% Plotting the graph for cp, H, T.
% Making directory to store the files created
cd('E:\Learning and Certification\Skill_lynk\Masters in Hybrid Electric Vehicle Designa and Simulation\Matlab Practice\Project1_PARSING_NASA_DATA\Outputs')
% To create the new folder for each species.
mkdir(species_name);
cd(species_name);
%plotting T vs cp
figure(1)
plot(T,cp,'linewidth',3,'color','b')
xlabel ('Temperature (T)')
ylabel ('Specific heat (cp)');
grid on
title (species_name)
saveas (figure(1),'Specific_heat_vs_Temperature.jpg');
%plotting T vs H
figure(2)
plot(T,H,'linewidth',3,'color','g')
xlabel ('Temperature (T)')
ylabel ('Enthalpy (H)');
grid on
title (species_name)
saveas (figure(1),'Specific_heat_vs_Enthalpy.jpg');
%plotting T vs S
figure(3)
plot(T,S,'linewidth',3,'color','b')
xlabel ('Temperature (T)')
ylabel ('Entropy (S)');
grid on
title (species_name)
saveas (figure(1),'Specific_heat_vs_Entropy.jpg');
% Providing directory again so that loop continues until all 53 species get stored.
cd('E:\Learning and Certification\Skill_lynk\Masters in Hybrid Electric Vehicle Designa and Simulation\Matlab Practice\Project1_PARSING_NASA_DATA\Outputs')
end
Explanation:
- Molar Gas Constant (R) was defined
- "fopen" command used to open the data file from the local device.
- "fgetl" was used to read the desired data from the data file.
- Using the "str2num" command, the temperature range was read and the temperature range was defined using the "linspace" command.
- Using "for" and "fget1" commands to read all the species from the data file.
- All 14 coefficients were figured out using "line", "fgetl", and "findstr" commands.
- Using the called function, Specific heat, Enthalpy, and Entropy were calculated.
- Using the M_W function, Molecular weight was calculated for the given species.
- Further, the "mkdir" and "cd" command was used to give a directory and create a new folder.
- Plots of Temperatures with cp, H, and S were plotted.
- The "saveas" command is used to save the plots as image format in the directory assigned before.
- The current folder is again defined as the parent folder so that data of all the species get stored in the same directory with individual folders.
RESULTS:
Plots of Species (O2, N2 & Co2).
- Plot of O2
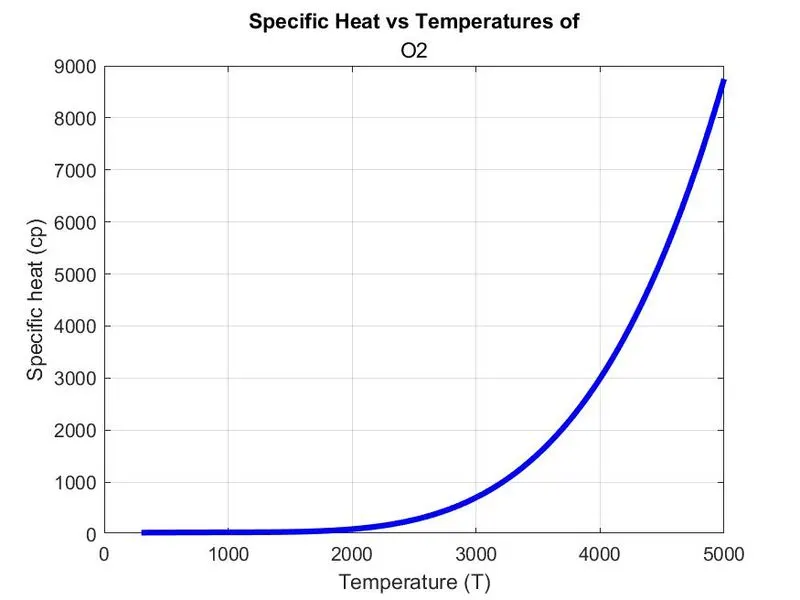
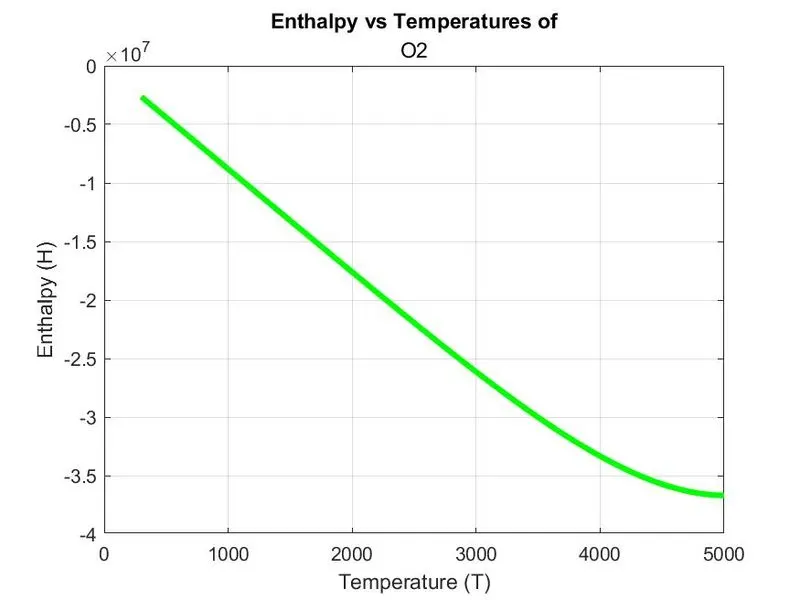
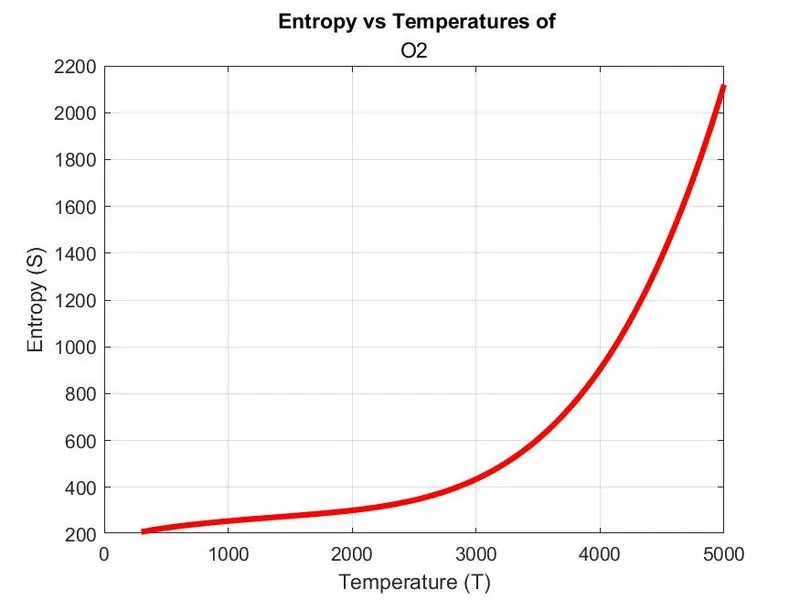
- Plot of N2
- Plot of Co2
TEMPERATURE RANGES:
SCREENSHOTS OF COMMAND WINDOW DISPLAYING MOLECULAR WEIGHT OF EACH SPECIES.
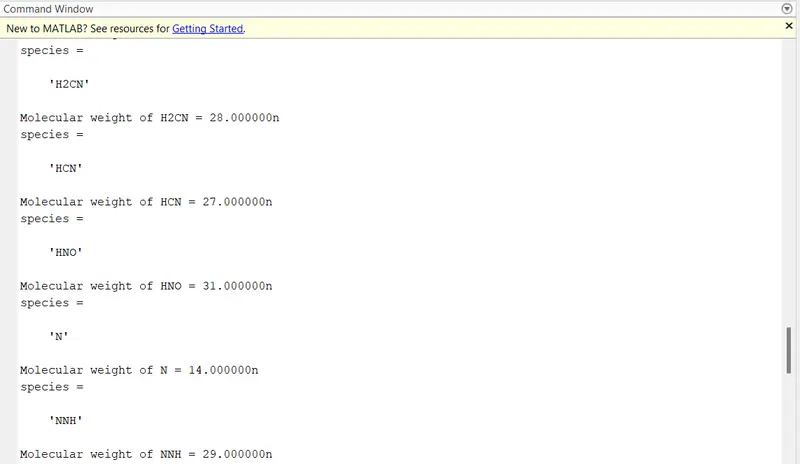
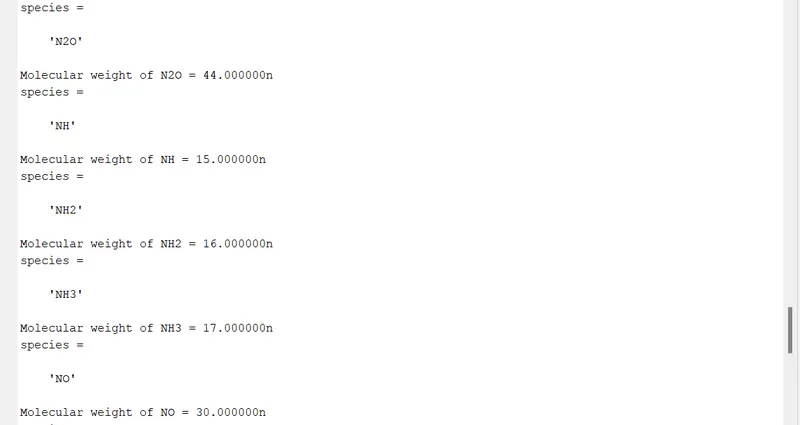
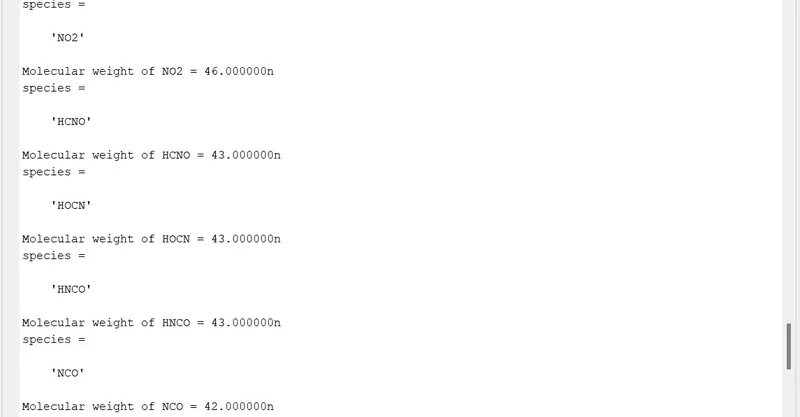
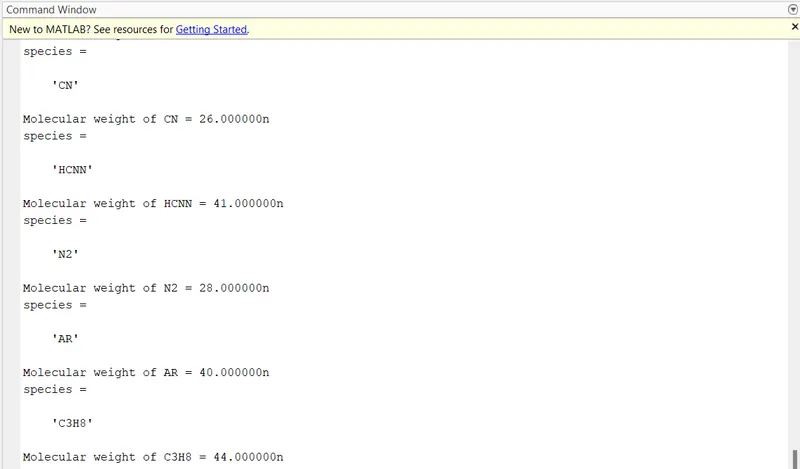
SCREENSHOT OF WINDOW SHOWING FOLDERS OF EACH SPECIES STORED AUTOMATICALLY USING MATLAB CODE.
ERROR FACED:
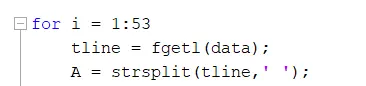
1. While writing the syntax using the command "fgetl', Error, as shown below, was displayed in the command window.

Instead of fgetl, it was typed as fget1. Later it was corrected and the error was removed.
The corrected code is shown below:

2. There was a typing error in the syntax. Instead of fgetl, it was typed as fget only.

It was corrected using syntax shown below:
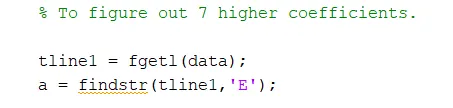
3. Typo error in Command cause the fault in the program as shown below.

Instead of "findstr", it was typed as "findsts" and later it was corrected.
The corrected syntax:
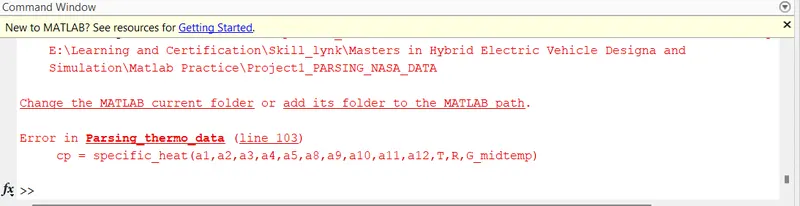
4. when the program was run, an error, as shown below, was displayed in the command window stating that the function cp is not in the same location where the main code is located. later the "specific_heat.m" file was transferred to the same location and the program was executed without any error.
CONCLUSION:
The data parsing was successfully completed from NASA's Thermodynamic data file. The plots between temperature ranges and thermodynamic properties were studied for 53 species along with the molecular properties of each species.
REFERENCES: