Week 3 - Solving second order ODEs
%main program
clear all
close all
clc

l=1;
m=1;
b=0.05;
g=9.81;

%intial condition
theta_0=[0;3];
%time points
t_span=linspace(0,20,200);
%solve ODE
[t,results]=ode45(@(t,theta)ode_func(t,theta,b,g,l,m),t_span,theta_0);
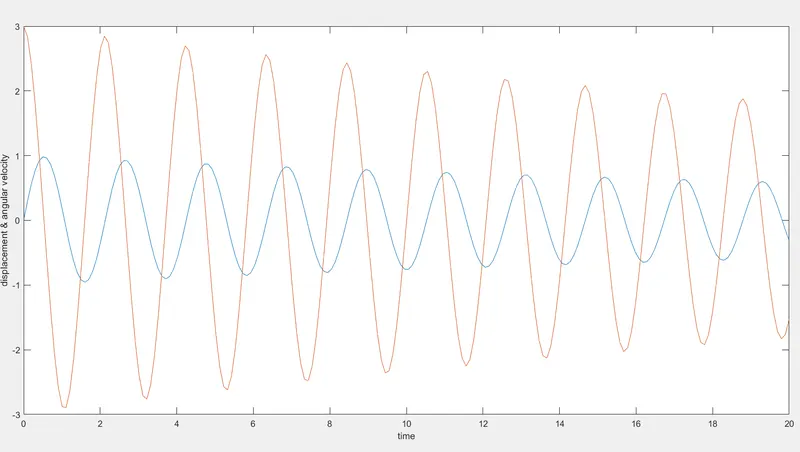
plot(t,results(:,1))
hold on
plot(t,results(:,2))
ylabel('displacement & angular velocity')
xlabel('time')

ct=1;
for i=1:length(t_span)
x1=l*sin(results(i,1));
y1=-l*cos(results(i,1));
x0=0;
y0=0;
figure(2)

plot([-1 1],[0 0],'linewidth',10,'color','g')
hold on
axis([-2 2 -2 2]);
plot([x0 x1],[y0 y1],'linewidth',2,'color','b')

plot(x0,y0,'o','markersize',3,'markerfacecolor','y')
plot(x1,y1,'o','markersize',20,'markerfacecolor','r')
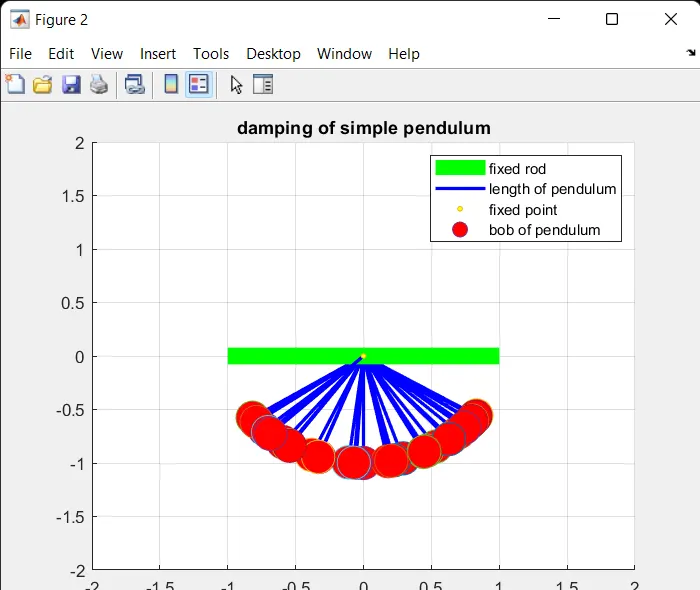
title('damping of simple pendulum');
legend('fixed rod','length of pendulum','fixed point','bob of pendulum');
grid on
hold off
M(ct)=getframe(gcf);
ct=ct+1;
end
movie(M)
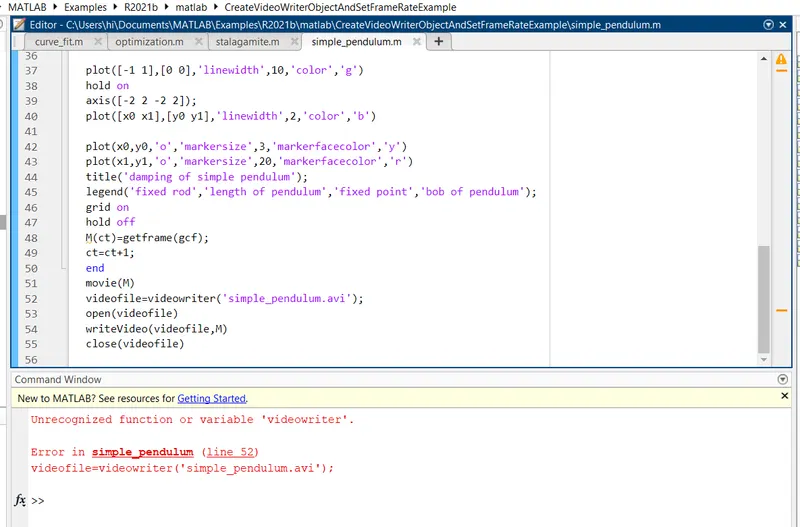
videofile=VideoWriter('simple_pendulum.avi');
open(videofile)
writeVideo(videofile,M)
close(videofile)
%sub program
function [dtheta_dt]=ode_func(t,theta,b,g,l,m)
theta1=theta(1);
theta2=theta(2);
dtheta1_dt=theta2;
dtheta2_dt=-(b/m)*theta2-(g/l)*sin(theta1);
dtheta_dt=[dtheta1_dt;dtheta2_dt];
endOUTPUT:
Animation link:https://drive.google.com/file/d/1gaxoGDB3TEHZL5KVq6ASzZOZPgzX-igI/view?usp=sharing
plot:
EXPLANATION OF CODE:
- Our aim is to solve the second-order differential equation to get angular velocity and angular displacement.
- To observe the variation of angular velocity and displacement of the simple pendulum under damping conditions with respect to time.
- To animate the movement of the pendulum.
- First, we will split the given differential equation into 1st order differential equations.
- Input the parameters like length of the pendulum, the mass of the bob, gravity, damping coefficient.
- intialize time(t)=0, angular displacement(theta1)=0, angular velocity(theta2)=3.
- By using the ode45 function we calculate the angular velocity and angular displacement.
- we iterate the function for a span of 20 seconds.
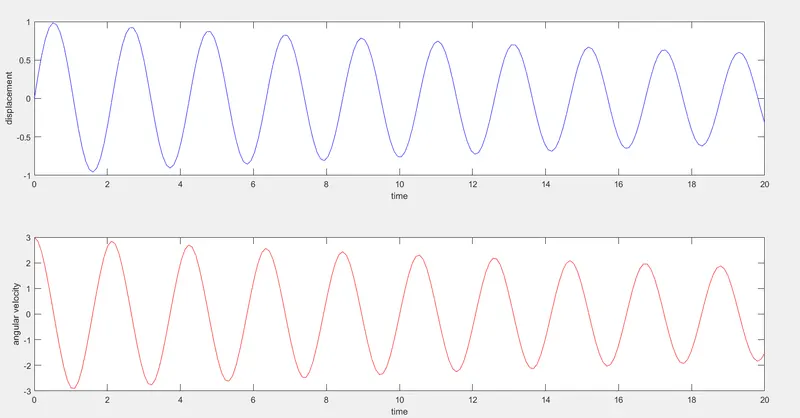
- Then we plot the graphs using the values obtained after iteration.
(angular displacement vs time),(angular velocity vs time).
- We calculated the coordinates and fixed the space to be presented.
- Then we created the support, pendulum string, bob by using the plot command.
- We use the count and getframe function to capture each and every frame.
- Then we stitch the frame using the movie command and save the animation in a file.
ERRORS:
- I used the hold off and hold on command simultaneously which resulted in undesired animation.
- Used the small letters while writing command videowriter.(capital v and capital w should be used)
CORRECTIONS:
- Placed the commands in such a way that they are not executed simultaneously.
- By using the search box in Matlab, corrected the commands.