Project 1 - Parsing NASA thermodynamic data
clear all
close all
clc
% file parsing main progam
% reading data from the file
f1=fopen('THERMO.dat','r')
for i=1:5
    x=fgetl(f1)
end

% getting coefficient of spieces
for i=1:53
    %extracting the name of spieces and line one
    Temp_data=fgetl(f1);
D=strsplit(Temp_data,' ');
low_lt=str2num(D{end-3});
mid_lt=str2num(D{end-1});
hig_lt=str2num(D{end-2});

T=linspace(low_lt,hig_lt,400)
R=8.314;
   name=D{1};


    %extracting higher and lower temperature coefficients
line2=fgetl(f1);
line3=fgetl(f1);
line4=fgetl(f1);
A=strfind(line2,'E');
B=strfind(line3,'E');
C=strfind(line4,'E');
%higher temp coefficients
a1=str2num(line2(1:A(1)+3));
a2=str2num(line2(A(1)+4:A(2)+3));
a3=str2num(line2(A(2)+4:A(3)+3));
a4=str2num(line2(A(3)+4:A(4)+3));
a5=str2num(line2(A(4)+4:A(5)+3));
a6=str2num(line3(1:B(1)+3));
a7=str2num(line3(B(1)+4:B(2)+3));
%extracting low temp coefficients
a8=str2num(line3(B(2)+4:B(3)+3));
a9=str2num(line3(B(3)+4:B(4)+3));
a10=str2num(line3(B(4)+4:B(5)+3));
a11=str2num(line4(1:C(1)+3));
a12=str2num(line4(C(1)+4:C(2)+3));
a13=str2num(line4(C(2)+4:C(3)+3));
a14=str2num(line4(C(3)+4:C(4)+3));

%specific heat calculation
 cp=specific_heat(a1,a2,a3,a4,a5,a8,a9,a10,a11,a12,T,R,mid_lt);
%enthalpy calculation
 h=enthalpy(a1,a2,a3,a4,a5,a6,a8,a9,a10,a11,a12,a13,T,R,mid_lt);
%entropy calculation
s=entropy(a1,a2,a3,a4,a5,a7,a8,a9,a10,a11,a12,a14,T,R,mid_lt);
%calculating molecular weight
Molecular_wt=molecular_weight(name)
%plotting
plotting(cp,h,s,T,name)
end
% To calculate specific heat
function cp=specific_heat(a1,a2,a3,a4,a5,a8,a9,a10,a11,a12,T,R,mid_lt)
if T<=mid_lt
cp= (a8+(a9*T)+(a10*(T.^2))+(a11*(T.^3))+(a12*(T.^4))).*R;
else
cp= (a1+(a2*T)+(a3*(T.^2))+(a4*(T.^3))+(a5*(T.^4))).*R;
end
end% To calculate enthalpy
function h=enthalpy(a1,a2,a3,a4,a5,a6,a8,a9,a10,a11,a12,a13,T,R,mid_lt);
if T<= mid_lt;
h=R*T.*(a8+a9*(T/.2)+a10*(T.^2/.3)+a11*(T.^3/.4)+a12*(T.^4/.5)+a13./T);
else
h=R*T.*(a1+a2.*(T/.2)+a3*(T.^2/.3)+a4*(T.^3/.4)+a5*(T.^4/.5)+a6./T);
end
end
% To calculate entropy
function s=entropy(a1,a2,a3,a4,a5,a7,a8,a9,a10,a11,a12,a14,T,R,mid_lt);
if T<= mid_lt
    s=R*(a8*log(T)+a9*T+a10*(T.^2/.2)+a11*(T.^3/.3)+a12*(T.^4/.4)+a14);
else
    s=R*(a1*log(T)+a2*T+a3*(T.^2/.2)+a4*(T.^3/.3)+a5*(T.^4/.4)+a7);

end
end
% To calculate molecular weight
function W=molecular_weight(name)
atoms=['H','C','O','N','A'];
atomic_wt=[1,12,16,14,40];
W=0;
for i=1:length(name)
    for j=1:length(atoms)
        if name(i)==atoms(j)
            W=W+atomic_wt(j);
            position=j;
        end
    end
    n=str2num(name(i));
    if n>=1
        W=W+atomic_wt(position)*(n-1);
    end
end
fprintf('molecular weight of %s=%f',name,W)
disp(' ')
end
% To plot specific heat, enthalpy, the entropy of the species
function plotting(cp,h,s,T,name);
cd (pwd)
dir_name=name;
mkdir(dir_name);

figure(1)
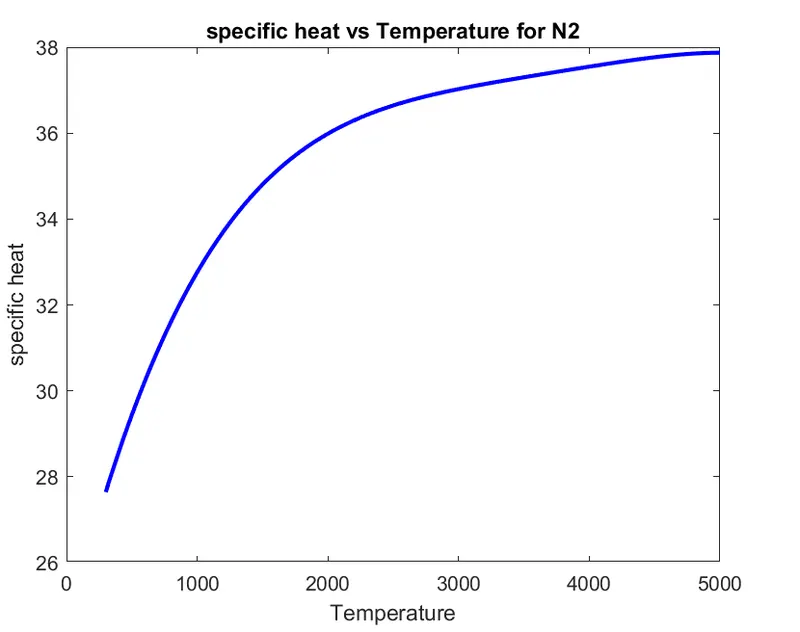
plot(T,cp,'LineWidth',2,'Color','b')
title(sprintf('specific heat vs Temperature for %s',name))
xlabel('Temperature')
ylabel('specific heat')

figure(2)
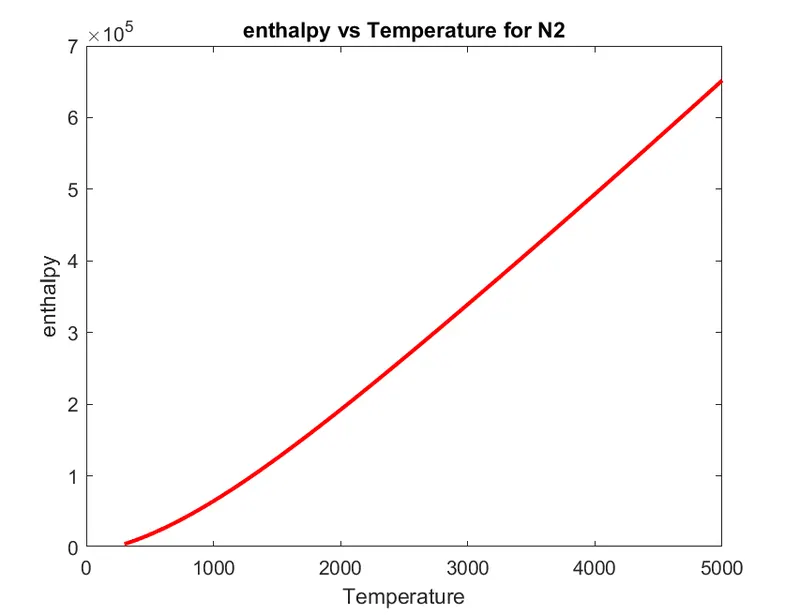
plot(T,h,'LineWidth',2,'Color','r')
title(sprintf('enthalpy vs Temperature for %s',name))
xlabel('Temperature')
ylabel('enthalpy')

figure(3)
plot(T,s,'LineWidth',2,'Color','g')
title(sprintf('entropy vs Temperature for %s',name))
xlabel('Temperature')
ylabel('entropy')

cd(dir_name)
saveas(figure(1),'cp vs T .png')
saveas(figure(2),'h vs T .png')
saveas(figure(3),'s vs T .png')
cd ..
end
OUTPUT:
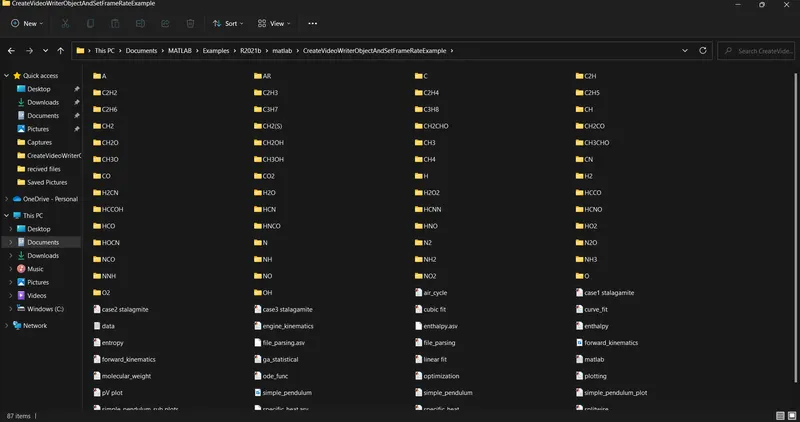
plots for O2
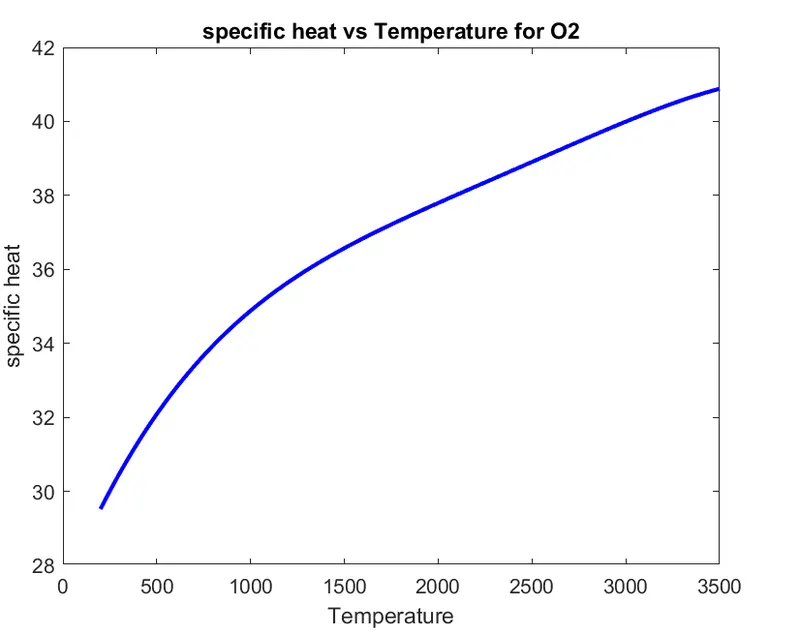
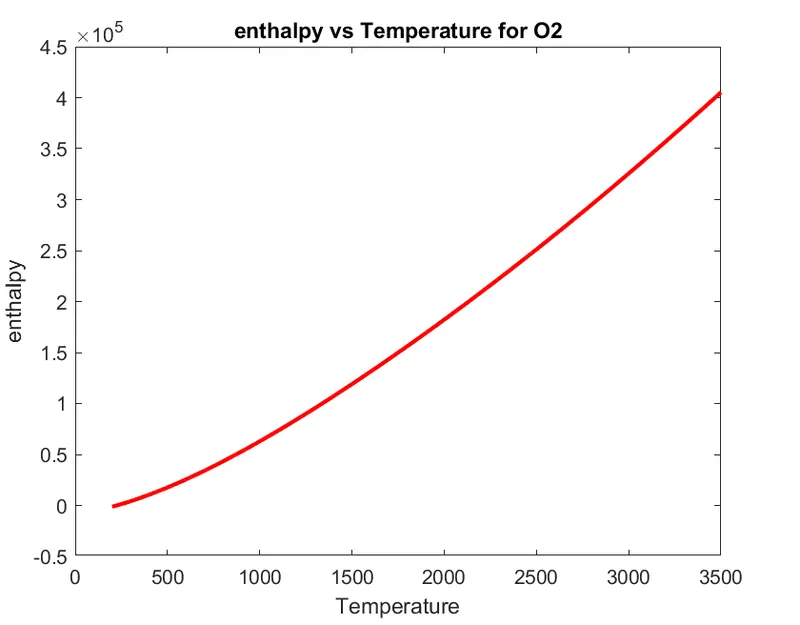
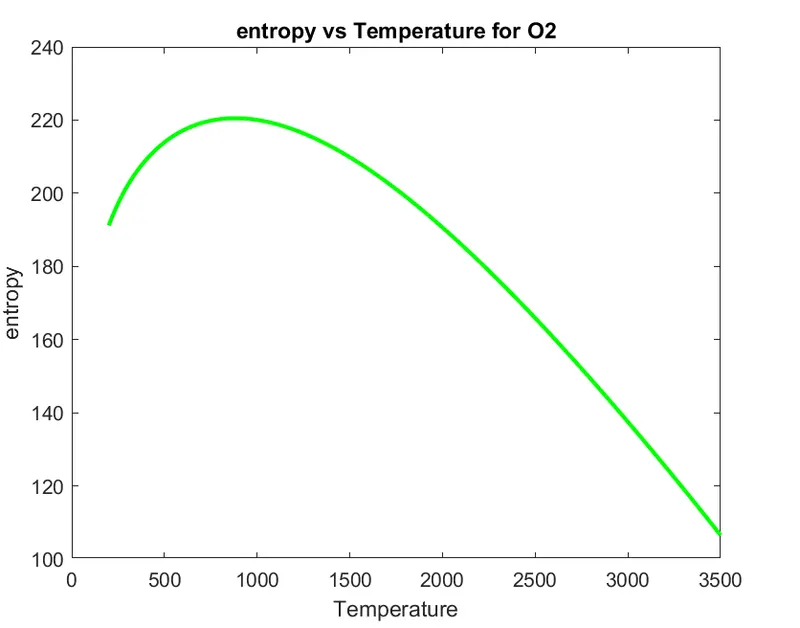
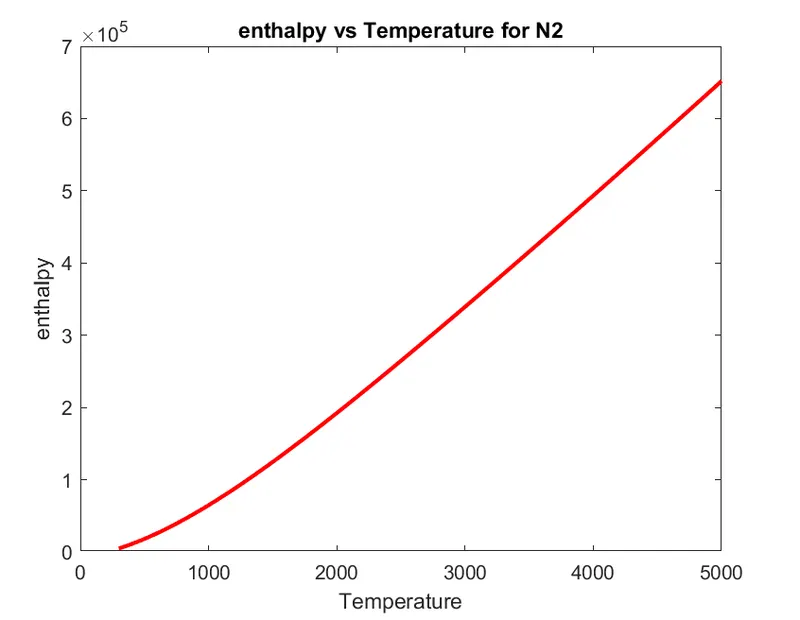
plots for N2
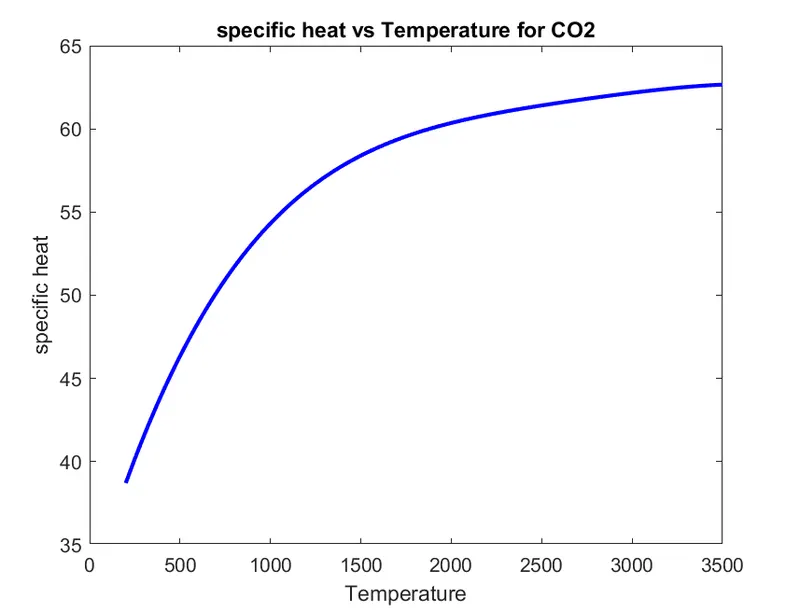
plots for CO2
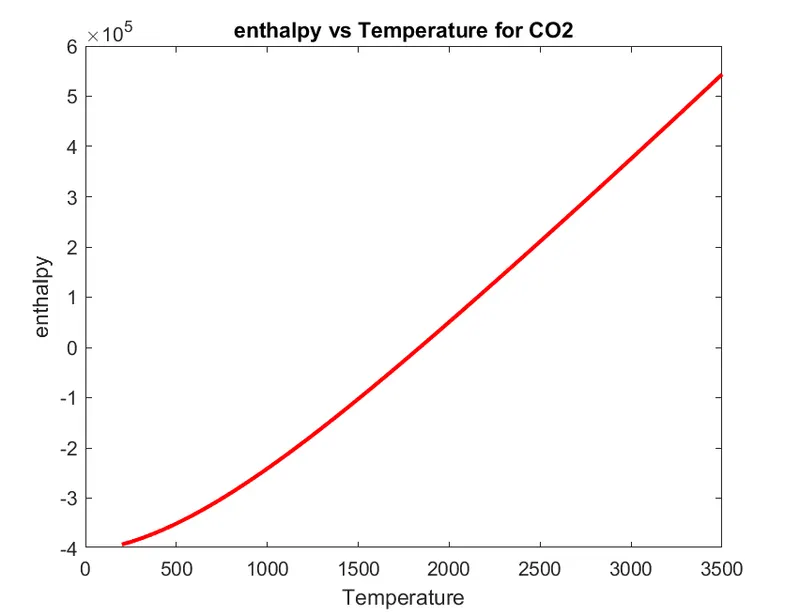
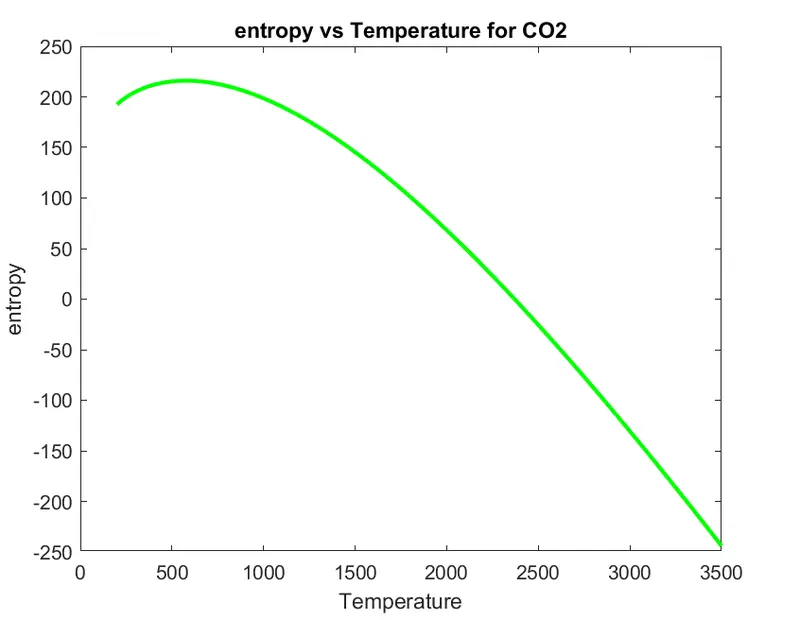
EXPLANATION OF CODE:
- First, we load the data using the command 'fopen'.
- Then we read the data line by line using command fgetl and store the required data by assigning them to certain variables.
- Used variables a1,a2,a3,a4,a5,a6,a7 to represent higher temperature coeffecients and a8,a9,a10,a11,a12,a13,a14 to represent lower temperature coeffecients.
- By using the formulas given in the challenge we calculate the values of cp,h, s and plot them against the temperatures for all the species.
- We also calculated the molecular weight of each and every species given in the data.
- Then we stored the plots for each species under the folder of the name of the species.
- Every time we run the program the plots are stored in their respective folder directly.
- We kept the entire program in a for loop to calculate the same for the remaining species.
- We created separate part-programs to calculate specific heat, entropy, enthalpy, molecular weight and to plot the curves.
- So our main program will be short and clearly understood.
Errors:
- Many typos while writing the code.
- Got the wrong plots by misplacing the equations in if condition in sub-programs.
Corrections:
- Checked each and every line before running the code and removed typos.
- placed the equations according to the condition.
File parsing:
- We use file parsing to read data line by line and use the data to get the required results.
- We can share the data to others without any difficulty as it is in the text form.
- It helps us to perform the operations in different computers.