Week 3 - Solving second order ODEs
Aim:
To write a program in MATLAB to solve second order ODE that represents the motion of a simple pendulum and to animate it's motion.
Given parameters:
gravity, g = 9.81 m/s^2
length of string, l = 1 m
mass of pendulum, m = 1 kg
damping coeff, b = 0.05
Objective:
To Simulate the motion between 0-20 sec, for angular displacement=0, angular velocity=5rad/sec, at time=0
Program:
clear all
close all
clc

b= 0.05;
g = 9.81;
l = 1;
m = 0.1;

%initial condition [initial displacement;initial velocity]
theta_0 = [0;5];

%time points
t_span = linspace(0,20,500);

%solve ODE
[t, results] = ode45(@(t,theta) ode_func(t,theta,b,g,l,m), t_span, theta_0);

figure(1)
plot(t,results(:,1))
hold on
plot(t,results(:,2))
ylabel('Plot')
xlabel('Time')

figure(2)
x0 = 0;
y0 = 0;
y1 = -l*cosd(results(1,1));
x1 = l*sind(results(1,1));
%plotting
plot([x0 x1],[y0 y1],'color','blue')
axis([-1 1 -1.5 0.5])
hold on
plot([-0.5 0.5],[0 0], '--', 'color', 'black')
plot(x1, y1, 'Marker','o','MarkerSize',25,'MarkerFaceColor','red','MarkerEdgeColor','blue')
grid on
title('Pendulum at Rest')
hold off

ct=1;
figure(3)
for i = 1:length(t_span)
    x0 = 0;
    y0 = 0;
    x1 = l*sind(results(i,1));
    y1 = -l*cosd(results(i,1));
    plot([x0 x1],[y0 y1],'color', 'blue')
    axis([-1 1 -1.5 0.5])
    grid on
    hold on
    plot([-0.5 0.5],[0 0], '--', 'color', 'black')
    plot(x1, y1, 'marker', 'o', 'MarkerSize',25,'MarkerFaceColor','red', 'MarkerEdgeColor','blue')
    pause(0.0005)
    hold off
    M(ct) = getframe(gcf)
    ct = ct+1

end

movie(M)
videofile = VideoWriter('Pendulum.avi', 'Uncompressed AVI')
open(videofile)
writeVideo(videofile,M)
close(videofile)
Results:
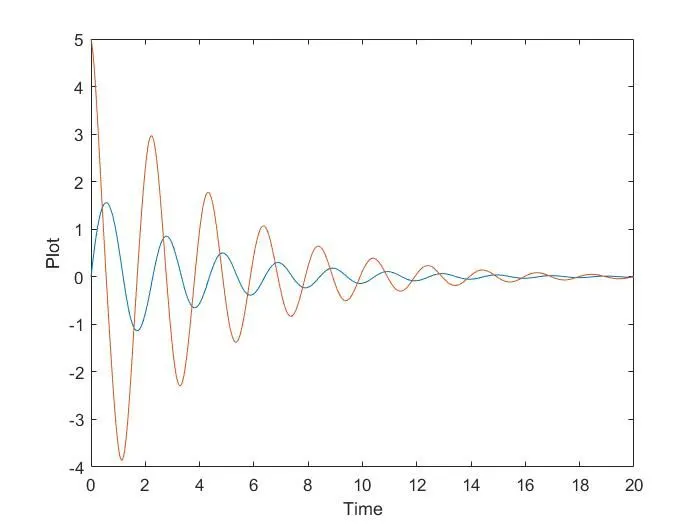
Plot for angular velocity(Red) and angular displacement(blue) vs time
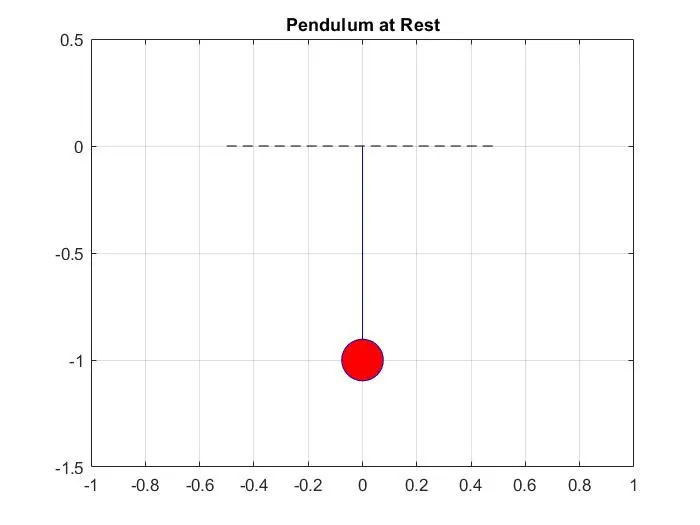
Initial condition of pendulum / Pendulum at rest:
Video / Animation Link: