Week 3 Sheet metal Bending challenge
Stress Concentration on a Sheet Metal Sending
OBJECTIVES:
To carry out a Static Structural Analysis on Sheet Metal Bending for the given three cases which use different materials and mesh sizing and determine the Equivalent stress, deformation, and Equivalent Elastic strain.
CASE-1:
For Case-1, Static Structural Analysis was carried out with the given model. In Case-1, three different materials with case setup were used and compared against the obtained results. The mesh/element size used for this analysis was 4mm for Punch and Die and 1mm for Sheetmetal and Contact regions of Punch and Die, and then the analysis was carried out using ANSYS Mechanical Enterprise. The model for case-1 was imported to ANSYS Workbench software and is shown in the figure below.
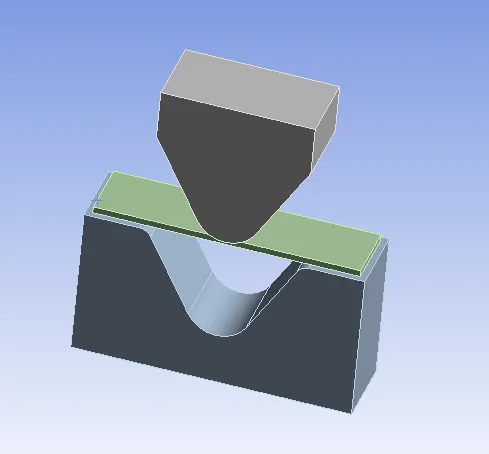
Fig.1 Sheet Metal Bending Model
Later the material (STRUCTURAL STEEL) was assigned to Punch and Die and the material and its properties used for this analysis are specified below for both gears.
|
Material |
Structural Steel |
Aluminum Alloy NL 1199 |
Copper Alloy NL |
Magnesium Alloy NL |
|
Density [kg/mm3] |
7.85e-6 |
2.77e-6 |
8.3e-6 |
1.8e-6 |
|
Young’s Modulus [MPa] |
2e+5 |
62000 |
1.1e+5 |
45000 |
|
Tensile Yield Strength [MPa] |
250 |
140 |
280 |
193 |
|
Tangent Modulus [MPa] |
- |
209.46 |
115 |
920 |
|
Parts |
Punch & Die |
Sheet Metal |
Sheet Metal |
Sheet Metal |
Then the model was meshed in ANSYS Mechanical Enterprise with an element size of 1mm and using Tetrahedrons were employed for Sheetmetal. And Face Sizing of 1mm element size was assigned to the contact regions of Punch (3 faces) and Die (7 faces).
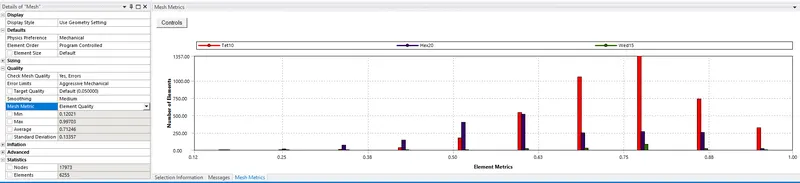
Fig.2 Element Quality
A mesh metric that identifies elements according to their quality was employed and it can be seen that the elements of the lowest quality are minimal. Most of the elements are of very high quality in the range of 0.63 to 0.88. Hence, the mesh is of acceptable quality. The meshed model is shown below.
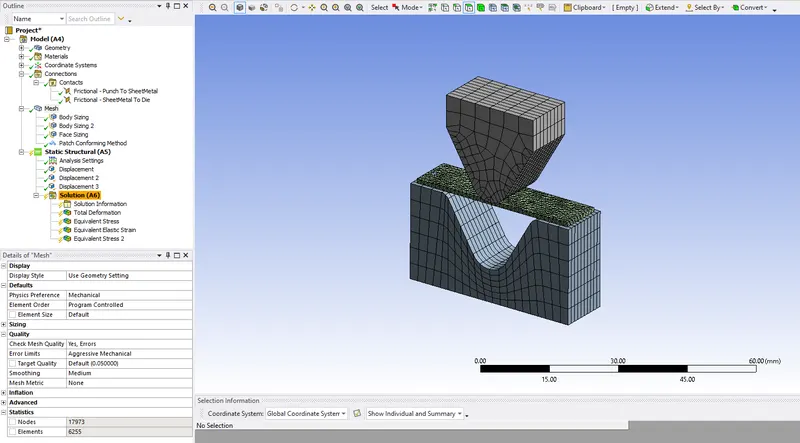
Fig.3 Meshed Model
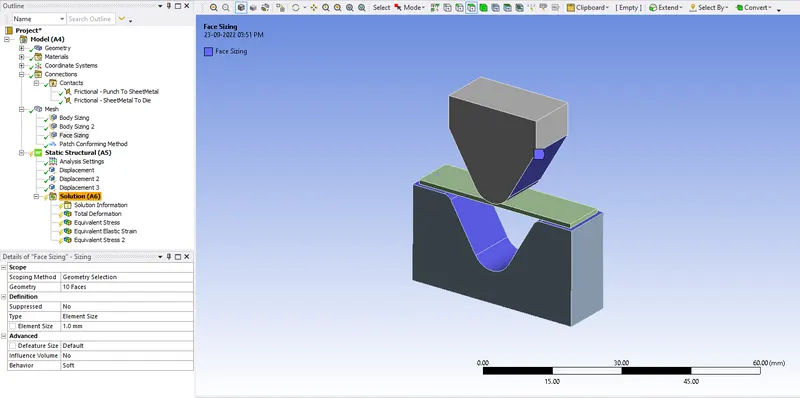
Fig.4 Face Sizing of 1mm
Then Contacts were provided with FRICTIONAL type with 0.1 Coefficient of Friction, AUTO ASSYMMETRIC behavior and using AUGMENTED LAGRNGIAN formulation method and ADD OFFSET, RAMPED EFFORT Interface Treatment. There were two FRICTIONAL contacts used, one for Punch and Sheet and the other for Sheet and Die. In the Analysis setting, 10 no. of steps were provided with DIRECT Solver type, Large Deformation ON, Stabilization - CONSTANT, and Energy Dissipation Ratio of 0.1. Then three DISPLACEMENT loads were assigned to Punch, Sheetmetal, and Die respectively.
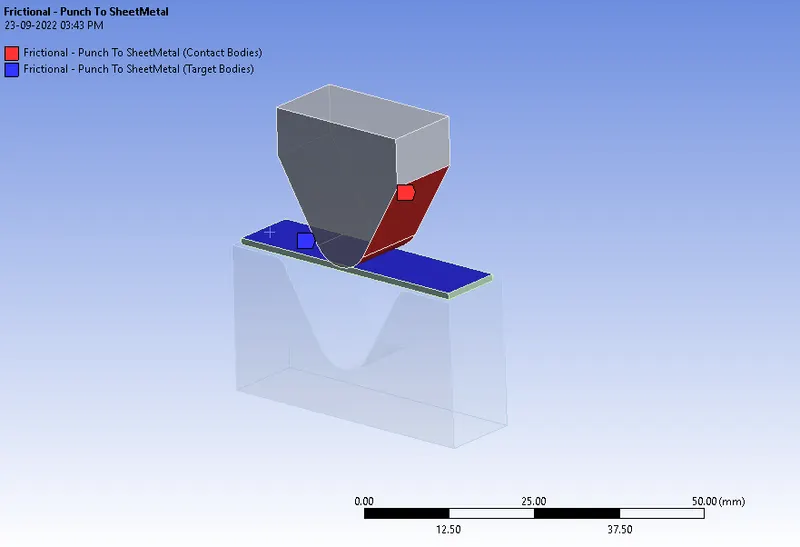
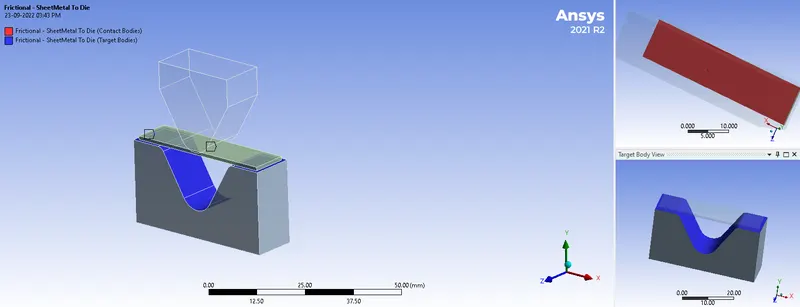
Fig.5 Frictional Contact a) Punch and Sheet b) Sheet and Die
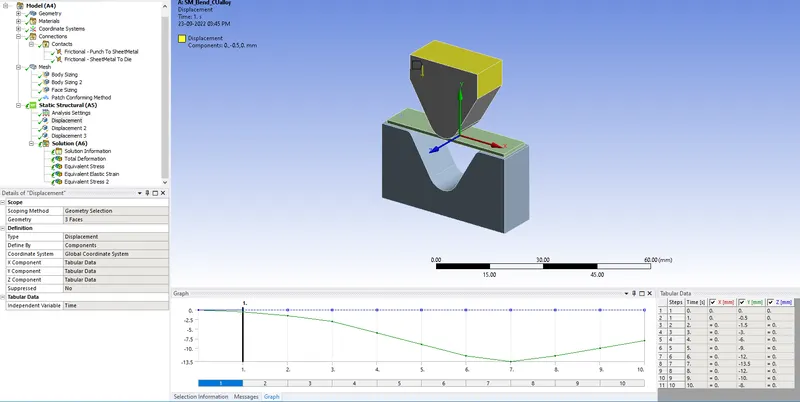
Fig.6a Displacement – Punch
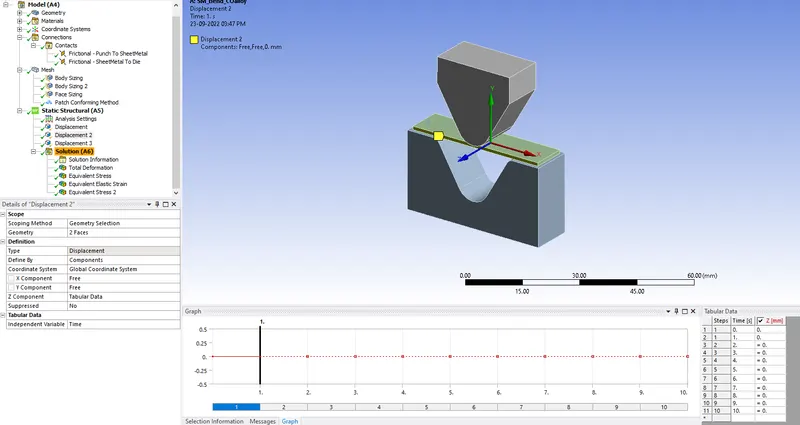
Fig.6b Displacement – Sheetmetal
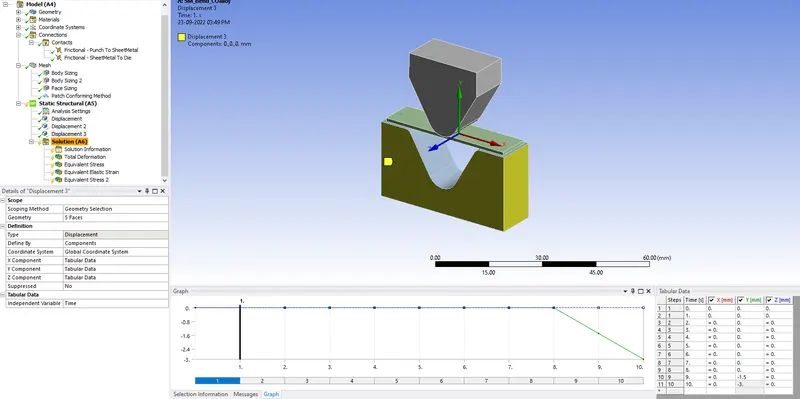
Fig.6c Displacement - Die
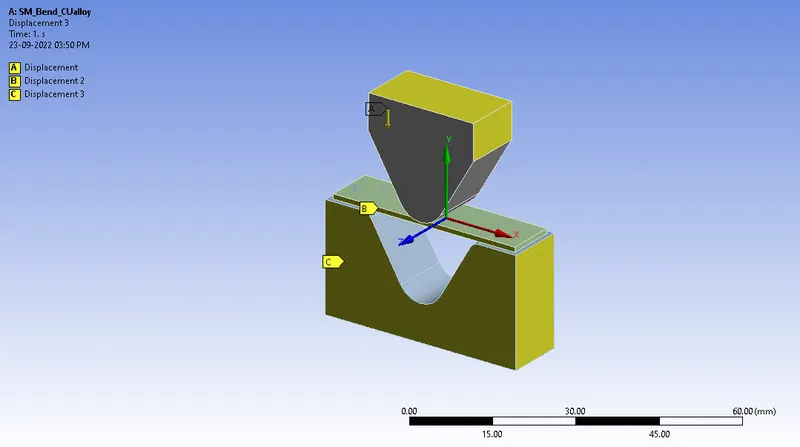
Fig.7 Load Applied
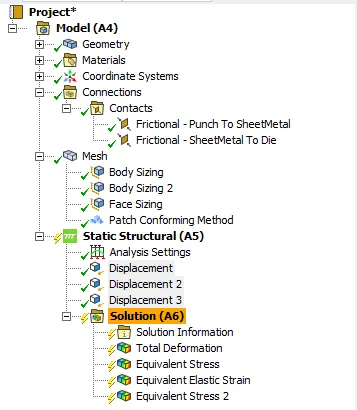
Fig.8 Case Setup.
The Static Structural analysis was run with two other materials namely Copper and Magnesium alloy and results were obtained and tabulated.
CASE-2:
For Case-2, Static Structural Analysis was carried out with the given model. But the Material used for sheet metal is Aluminum Alloy with A COEFFICIENT OF FRICTION of 0.19. The same contacts and load used in Case-1 were used in Case-2 also with only a change in the material’s Coefficient of Friction value. Then the analysis was run and results were obtained.
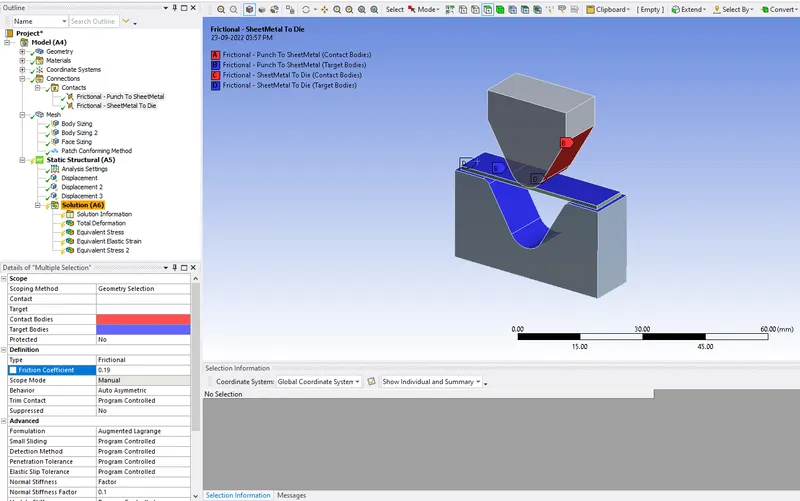
Fig.9 Sheet Metal – COF - 0.19
CASE-3:
For Case-3, Static Structural Analysis was carried out with the given model by refining the mesh of the sheet metal part by 0.8mm. The same contacts and load used in Case-1 were used in Case-3 also with only a change in mesh size. Then the analysis was run and results were obtained. The meshed model for Case-3 is shown below.
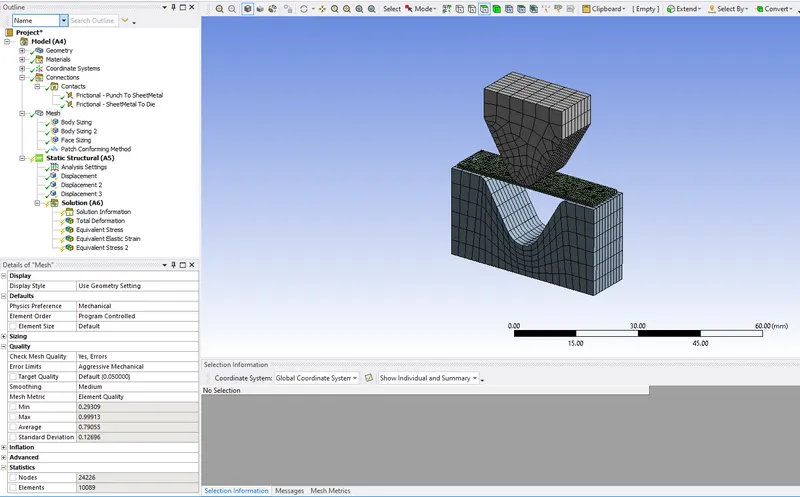
Fig.10 Meshed Model – 0.8mm element size (Sheet metal)
RESULTS CASE-1:
The Total Deformation, Equivalent (Von-Mises) Stress for Sheet metal and entire model, and Equivalent Elastic Strain data were obtained and tabulated below.
|
Material |
COF |
Total Deformation Max. [mm] |
Equivalent (Von-Mises) Stress [MPa] |
Equivalent Elastic Strain [mm/mm] |
Equivalent Stress for Sheet metal {MPA] |
|
Aluminum Alloy 1199 |
0.1 |
12.477 |
2.314e+5 |
1.1582 |
62.303 |
|
Copper Alloy NL |
0.1 |
10.129 |
1.324e+5 |
0.6798 |
135.07 |
|
Magnesium Alloy NL |
0.1 |
12.656 |
1.691e+5 |
0.8468 |
182.87 |
The stress Concentration on Sheet Metal is maximum in magnesium alloy while in the aluminum alloy is minimum. The elastic Strain on Copper Alloy is Minimum compared to all the other materials because Copper Alloy has the highest Young's Modulus. Therefore, the Deformation in Copper Alloy Plate is Lesser because its stiffer than other materials due to the higher Young's Modulus. The Order of Materials based on deformation is as follows:
Copper Alloy>>Aluminum Alloy 1199>>Magnesium Alloy
The Total Deformation for all three materials obtained from the analysis is shown below.
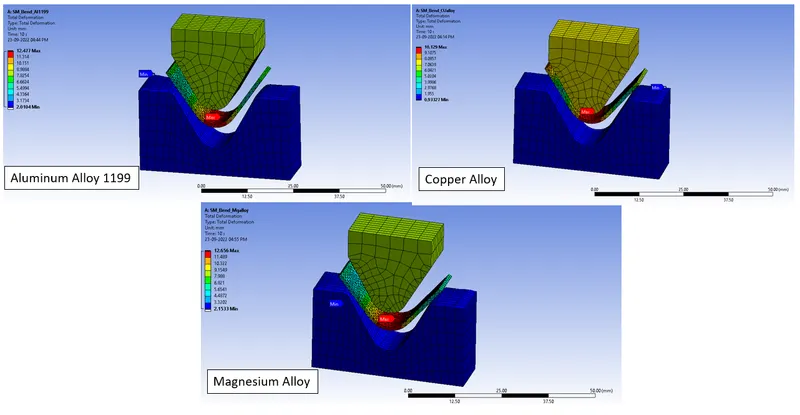
Fig.11 Total Deformation Contour Plot
The Equivalent (Von-Mises) Stress for all three materials obtained from the analysis is shown below.
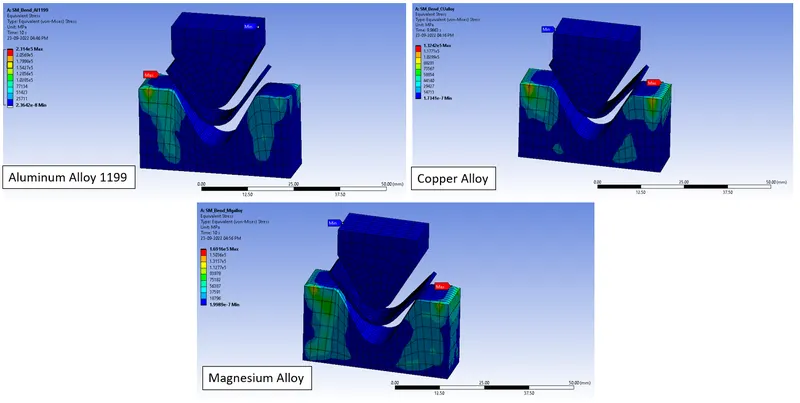
Fig.12 Equivalent Stress Contour Plot
The Equivalent Elastic Strain for all the three materials obtained from the analysis is shown below
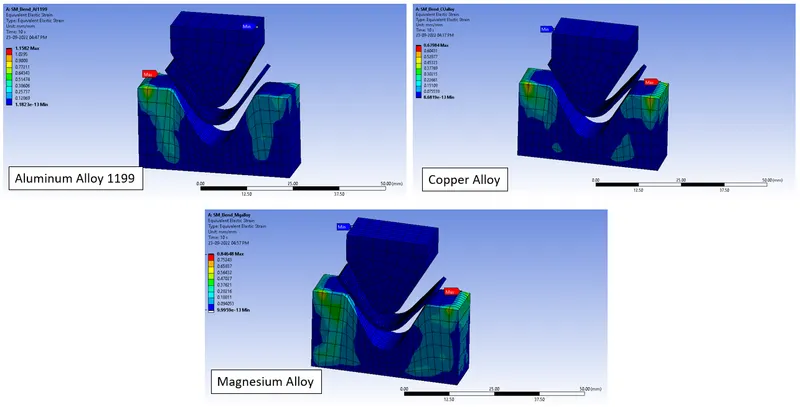
Fig.13 Stress Intensity Contour Plot
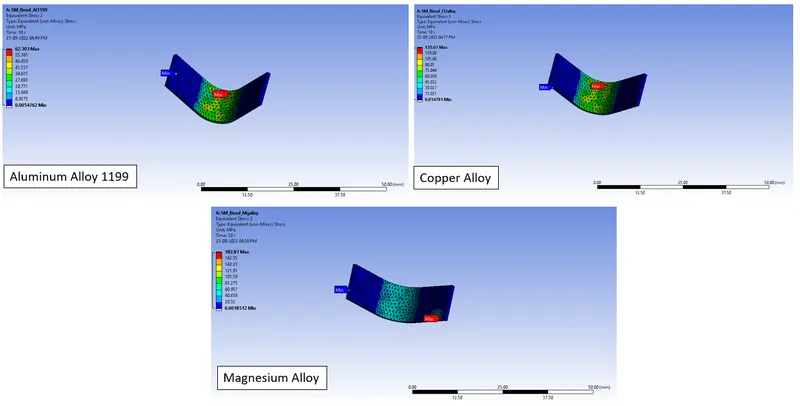
Fig.14 Equivalent Stress Contour Plot of Sheet Metal alone
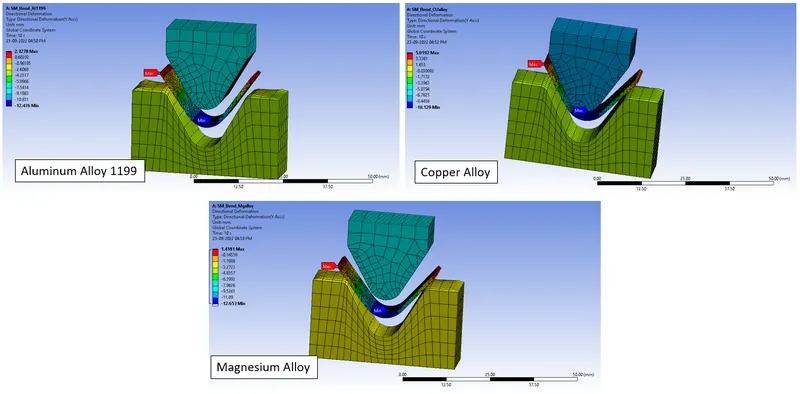
Fig.15 Directional Deformation Y-axis Contour Plot
The Total Deformation graph/table plot is shown below.
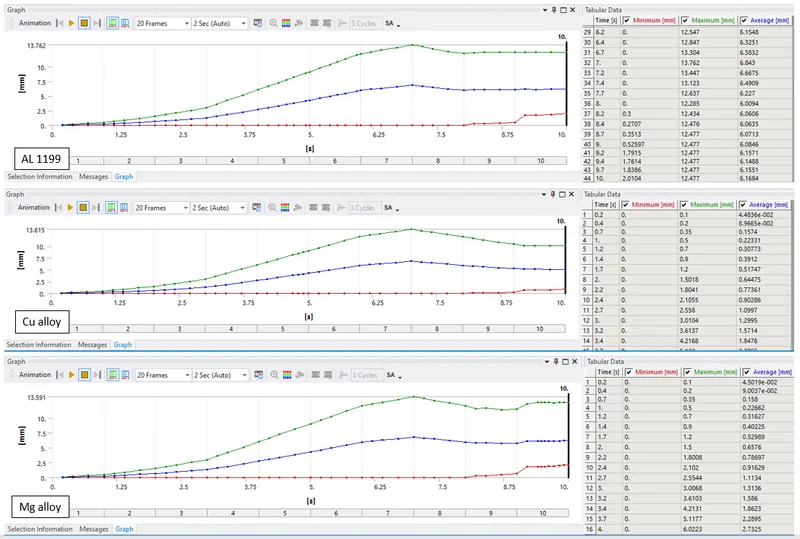
Fig.16 Total Deformation Table Plot
The Equivalent (Von-Mises) Stress graph plot is shown below.
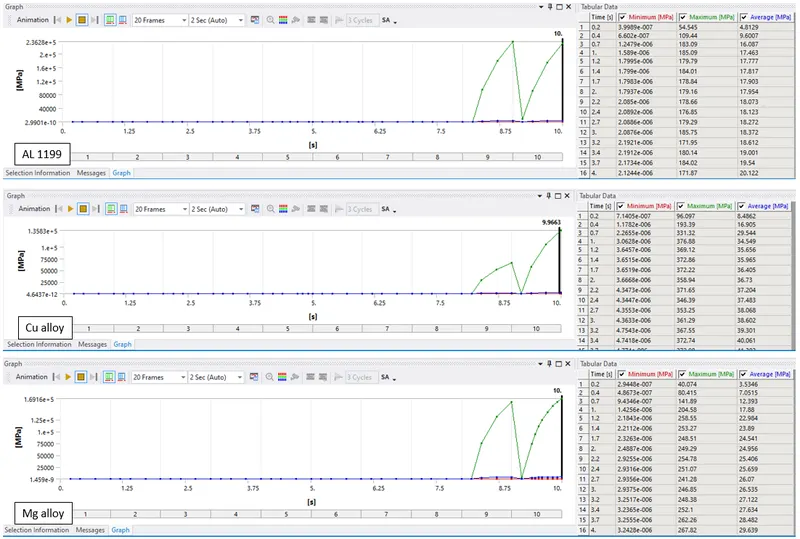
Fig.17 Equivalent Stress Table Plot
The Equivalent Elastic Strain graph plot is shown below
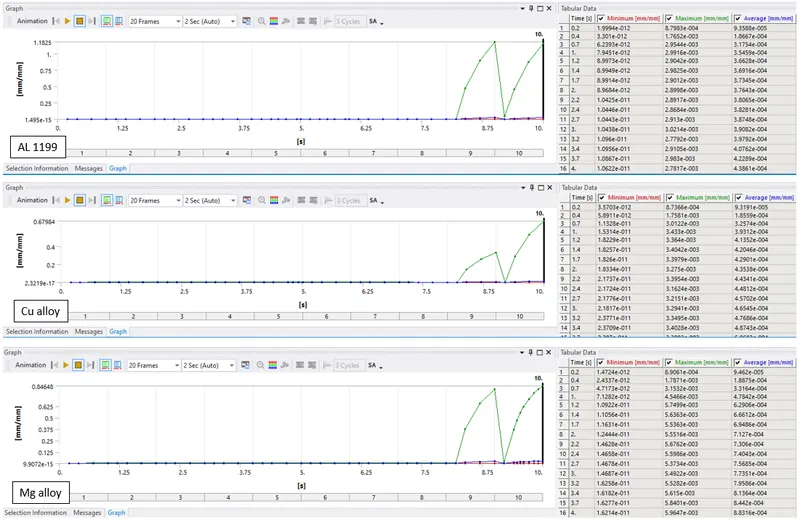
Fig. 18 Stress Intensity Table Plot
RESULT CASE-2:
The Total Deformation, Equivalent (Von-Mises) Stress for Sheet metal and entire model, and Equivalent Elastic Strain data were obtained and tabulated below for Aluminum Alloy with different Frictional Coefficient.
|
Case |
COF |
Total Deformation Max. [mm] |
Equivalent (Von-Mises) Stress [MPa] |
Equivalent Elastic Strain [mm/mm] |
Equivalent Stress for Sheet metal {MPA] |
Directional Deformation Y-axis [mm] |
|
1 |
0.1 |
12.477 |
2.314e+5 |
1.1582 |
62.303 |
12.476 |
|
2 |
0.19 |
11.525 |
99760 |
0.50083 |
121.49 |
11.523 |
As we can see when the coefficient of friction increases, the stress on the plate increases, and the stress and strain on the entire model are decreased by half. The Total Deformation is also less for the plate with a coefficient of friction of 0.19.
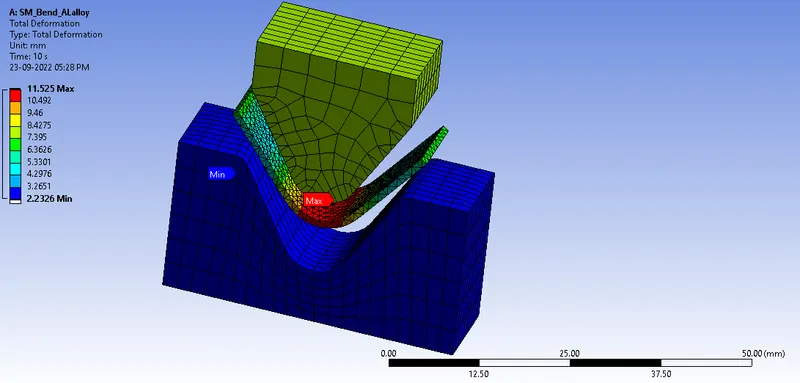
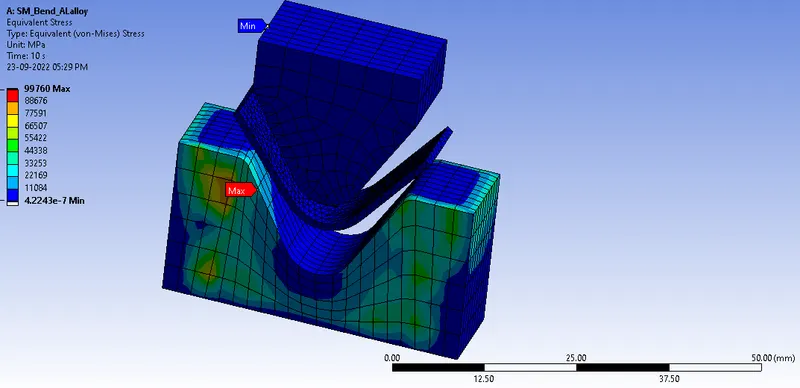
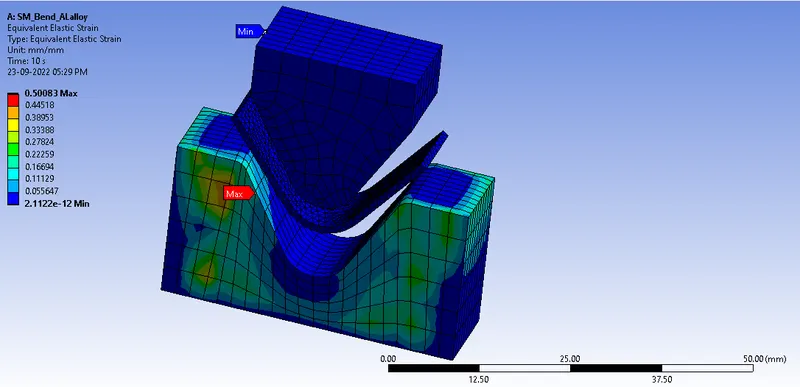
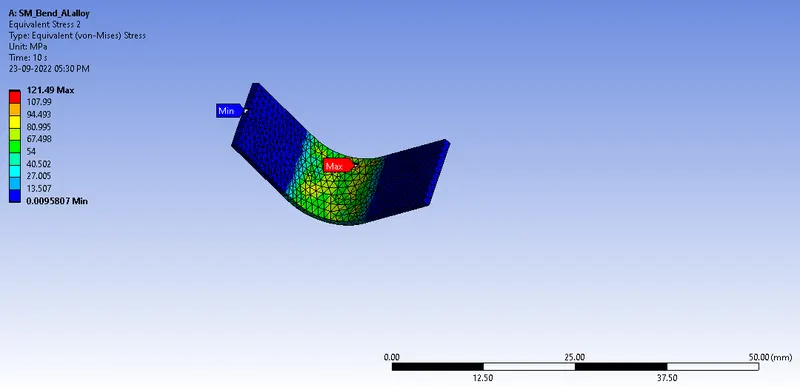
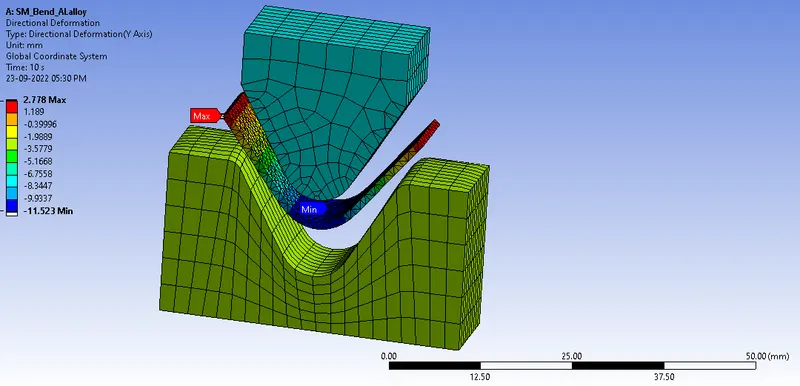
Fig.19 (Top to below) Total Deformation, Von-Mises Stress, Equivalent Strain, Von-Mises Stress for Sheet metal, and Directional Deformation.
RESULT CASE-3:
The Total Deformation, Equivalent (Von-Mises) Stress for Sheet metal and entire model, and Equivalent Elastic Strain data were obtained and tabulated below for Aluminum Alloy with different mesh sizes for Sheet metal.
|
Case |
Mesh Size [mm] |
No. of Elements |
Total Deformation Max. [mm] |
Equivalent (Von-Mises) Stress [MPa] |
Equivalent Elastic Strain [mm/mm] |
Equivalent Stress for Sheet metal {MPA] |
Directional Deformation Y-axis [mm] |
|
1 |
1 |
6255 |
12.477 |
2.314e+5 |
1.1582 |
62.303 |
12.476 |
|
3 |
0.8 |
10089 |
12.657 |
2.598e+5 |
1.3004 |
86.272 |
12.665 |
By decreasing the element size, the value increases and becomes more accurate. Comparing case 1 and case 3, we could see that stress values are dependent on the element size. Refining the mesh even with small element size will help in a better approximation of the result. Therefore, it makes it necessary to use the optimized element for better accuracy.
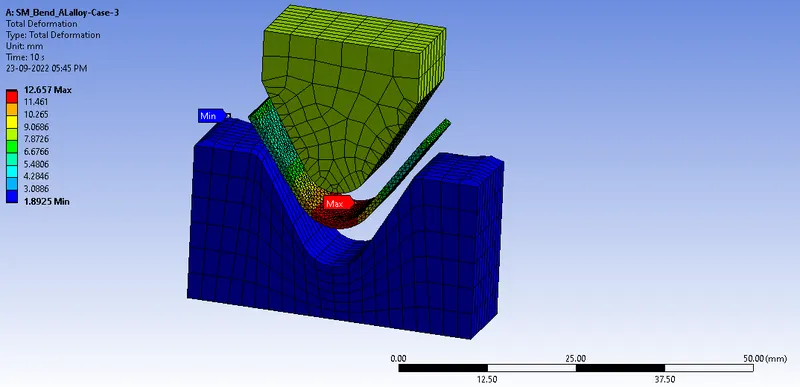
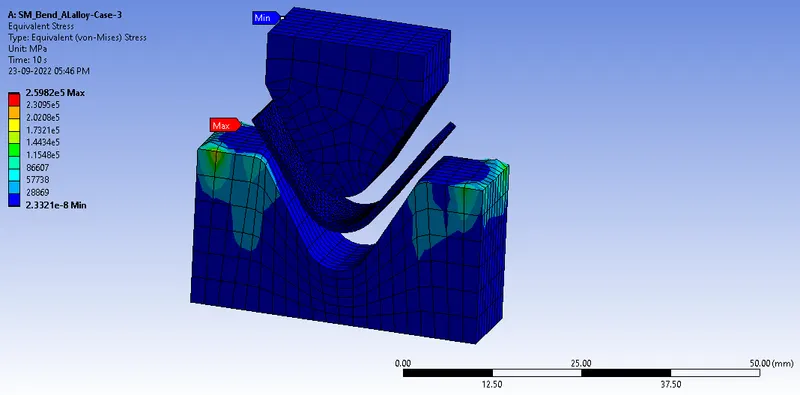
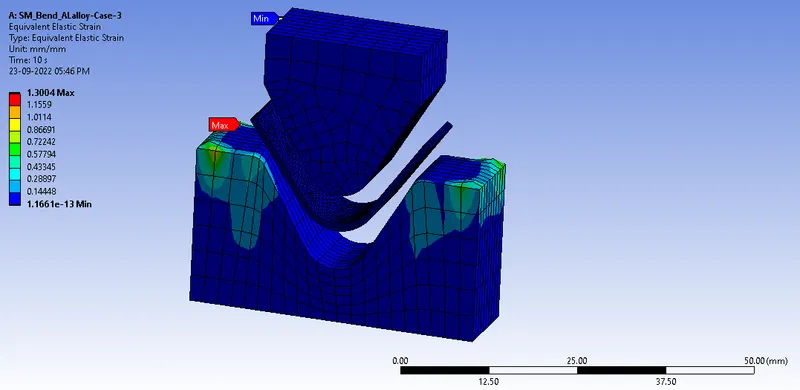
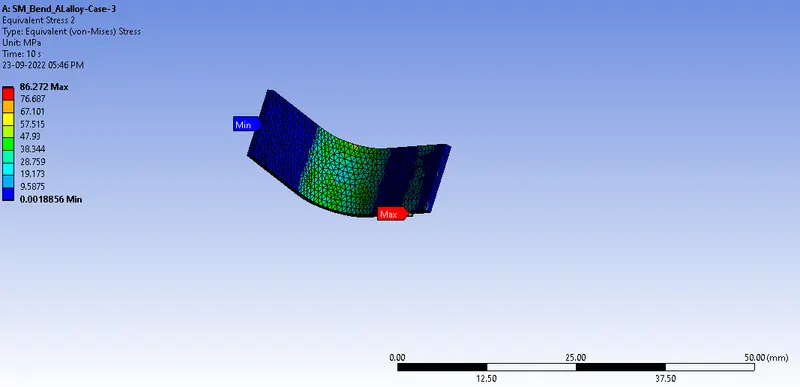
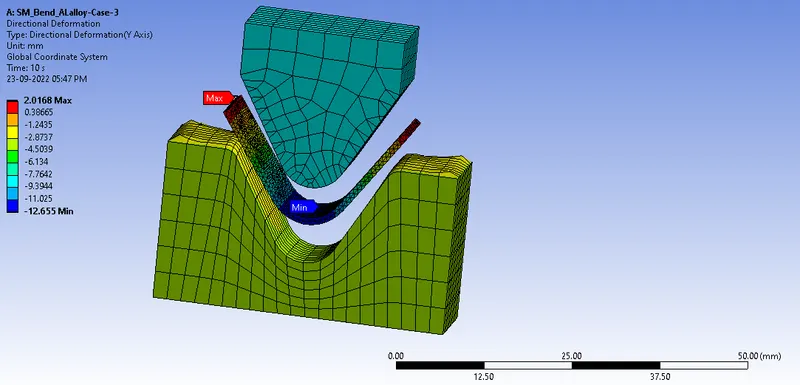
Fig.20 (Top to below) Total Deformation, Von-Mises Stress, Equivalent Strain, Von-Mises Stress for Sheet metal, and Directional Deformation.
CONCLUSION:
The analysis was run successfully for all three cases and results were obtained and tabulated. A Grid Dependency test has been performed in case 3 and it was observed that desired output values are dependent on mesh size. The higher the mesh elements, the higher the accuracy but the time to compute will also become high. So, there should be a balance between mesh elements' size and time for computation.