Week 3 Sheet metal Bending challenge
Aim: The objective of this project is to simulate a sheet metal bending with different properties, friction coefficient and mesh sizes. Then to compare the results and provide conclusions.
Pre Processing:
The 3D CAD model of the sheet metal bending is imported into the Ansys workbench.
Material properties:
The material properties of Aluminium, Copper, and Magnesium are loaded in the materials module of the workbench. All these materials are added from non-linear general material library.
Model Setup:
The appropriate material properties are added to the sheet in the geometry section of the mechanical module.
Contacts:
The default contacts are deleted and two frictional contacts with a frictional coefficient of 0.1 are defined between the die and sheet metal, and between sheet metal and the punch. In case 2 the frictional coefficient was increased to 0.19.
Mesh:
The mesh sizing of 4mm was given to die and punch. The mesh size of 1mm was given to sheet with the tetrahedral method. The surfaces of intersection for die and punch with sheet were set to 1mm using face sizing. In the case of refined mesh, the mesh size of 0.8mm was given to sheet metal.
Nodes:17850
Elements:6224
Analysis settings:
The analysis was given for 10 steps, with large deflections. Solver type was set to Direct method. The stabilization was set to constant energy, with energy dissipation of 0.1.
Boundary Conditions:
The punch was given a displacement for 10steps increasing from 0.5 to 13.5 mm in the negative y-direction. Then decreasing from13.5mm to 8mm. The die was set to increase in the y-direction from step 9 (1.5mm) to step 10 (3mm). The sheet metal was fixed in the z-direction.
Post-processing:
Results:
Case1:
The comparison of results for aluminium alloy, copper alloy, and magnesium alloy are given in table1:
| Aluminium | Copper | Magnesium | |
| Y-axis deformation (mm) | 12.476 | 11.663 | 12.391 |
| Equivalent Stress (MPa) | 2.49e05 | 2.09e05 | 1.74e05 |
| Equivalent Strain | 1.2464 | 1.0463 | 0.86954 |
| Equivalent Stress on the sheet (MPa) | 57.82 | 118.19 | 77.038 |
The images of the results are given below:
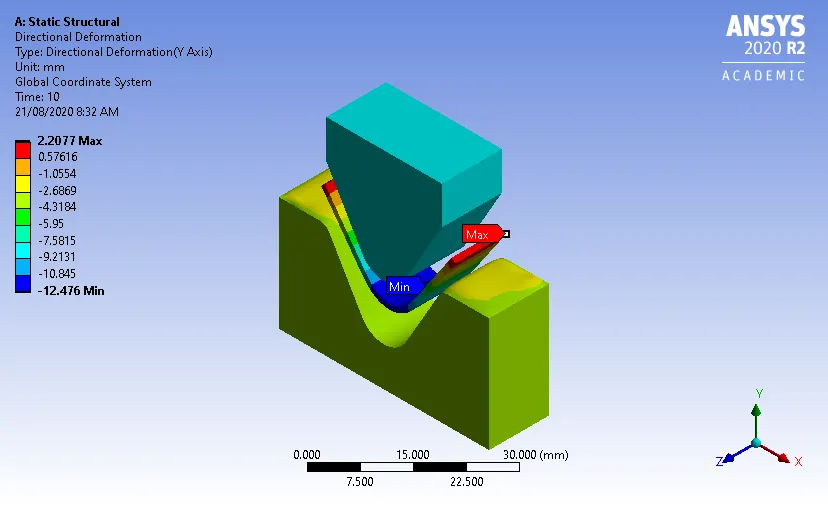
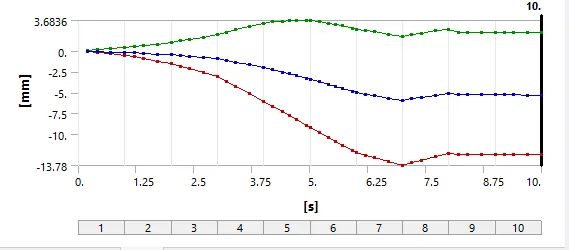
Aluminium: Total deformation in the y-direction and its graph with time.
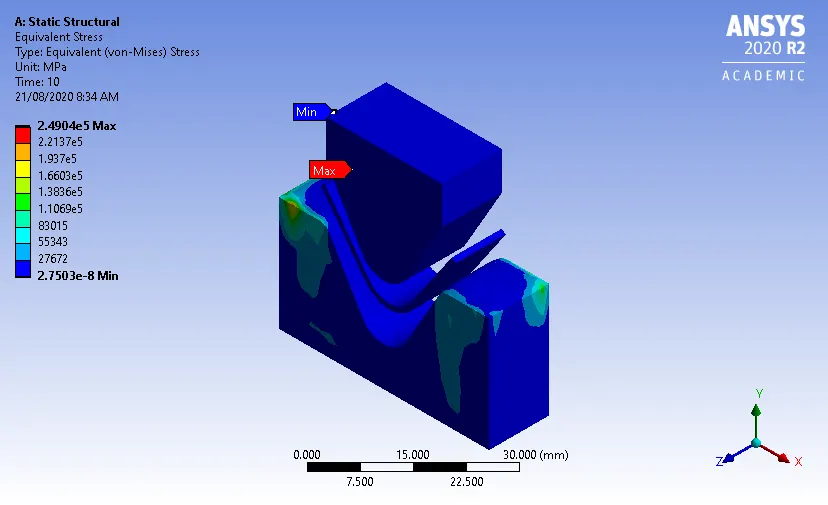
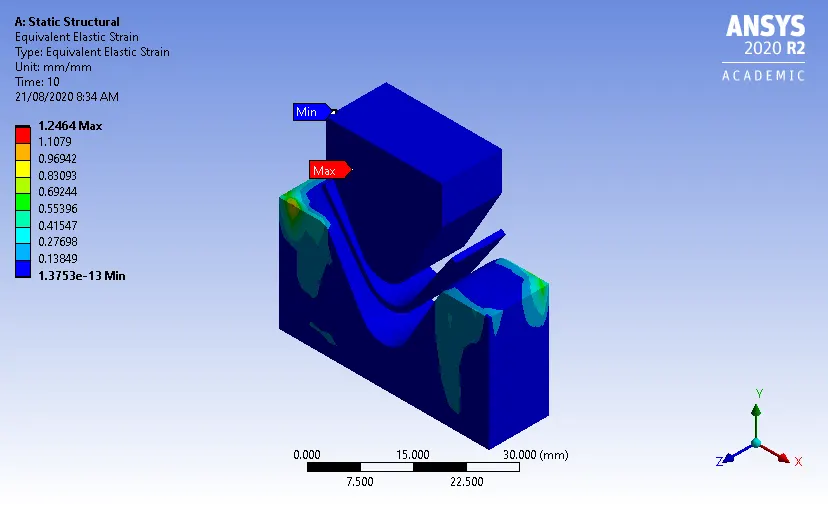
Aluminium: Stress and Strain developed in the model.
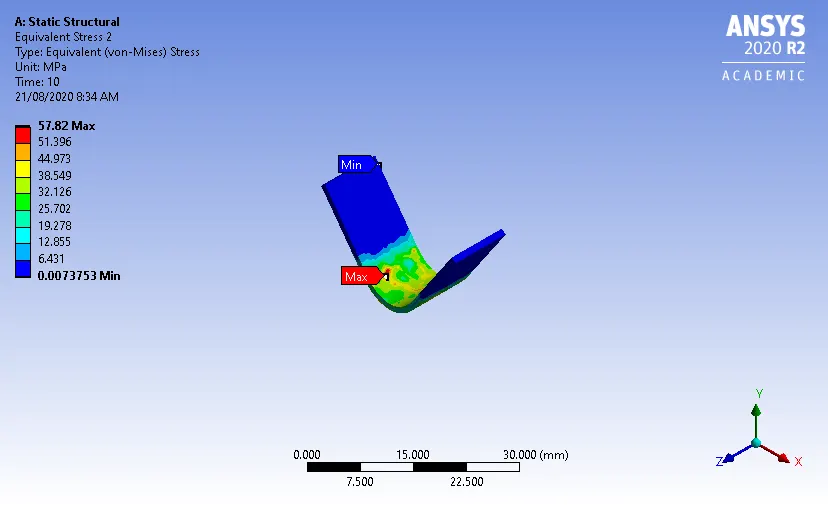
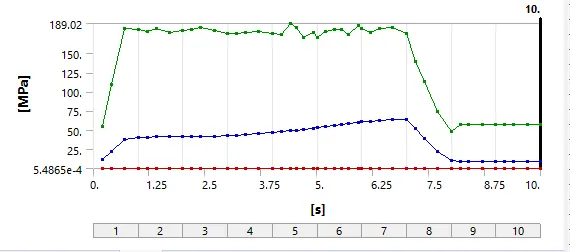
Aluminium: Stress and its graph for the plate with time.
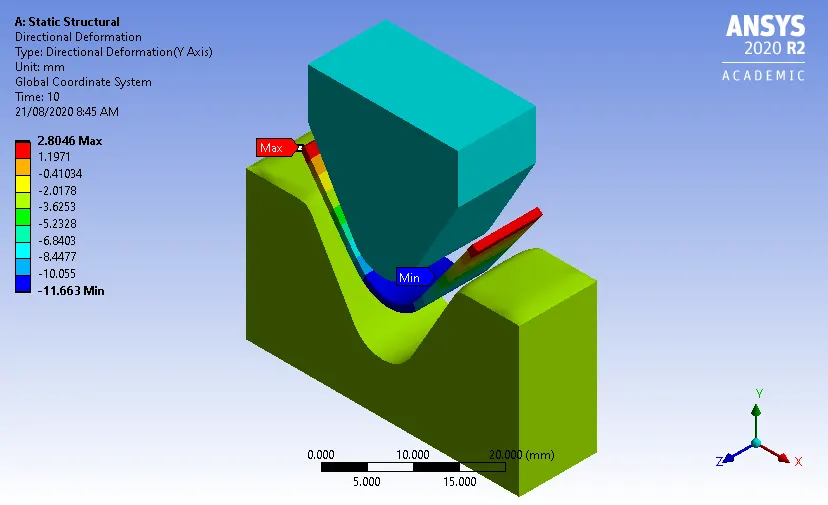
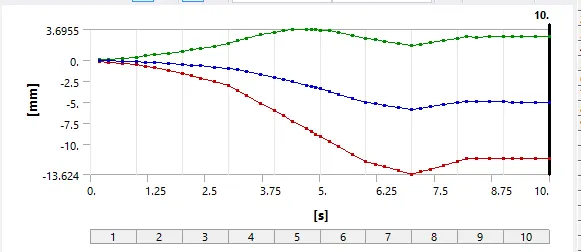
Copper: Total deformation in the y-direction and its graph with time.
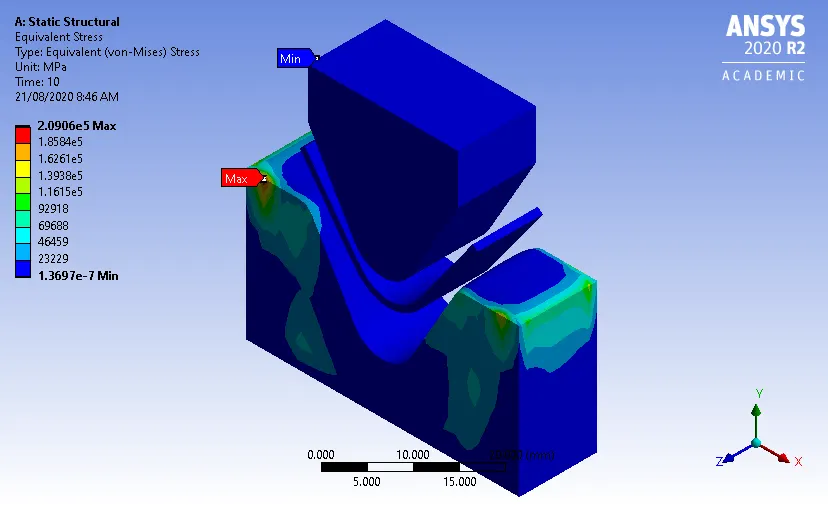
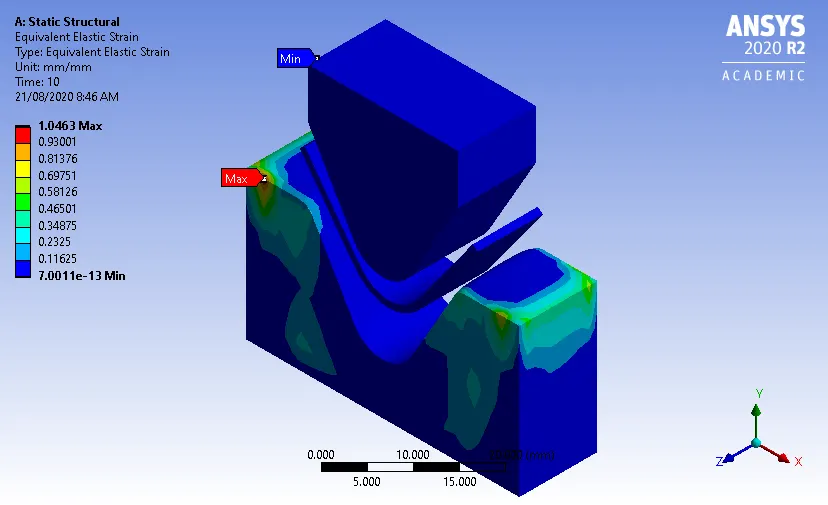
Copper: Stress and Strain developed in the model.
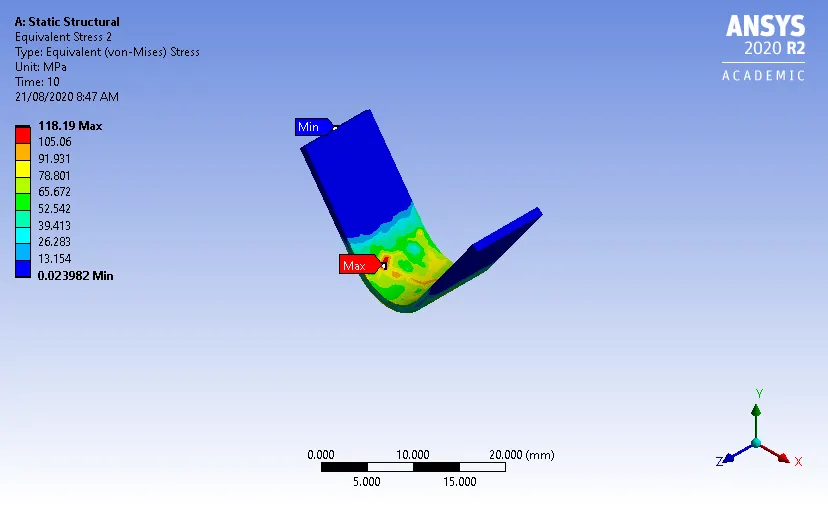
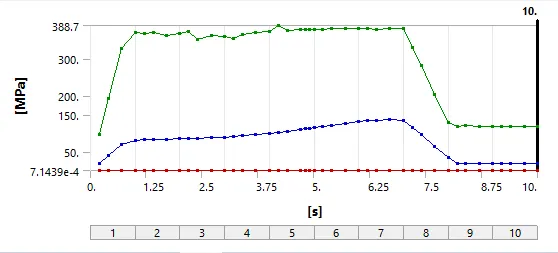
Copper: Stress and its graph for the plate with time.
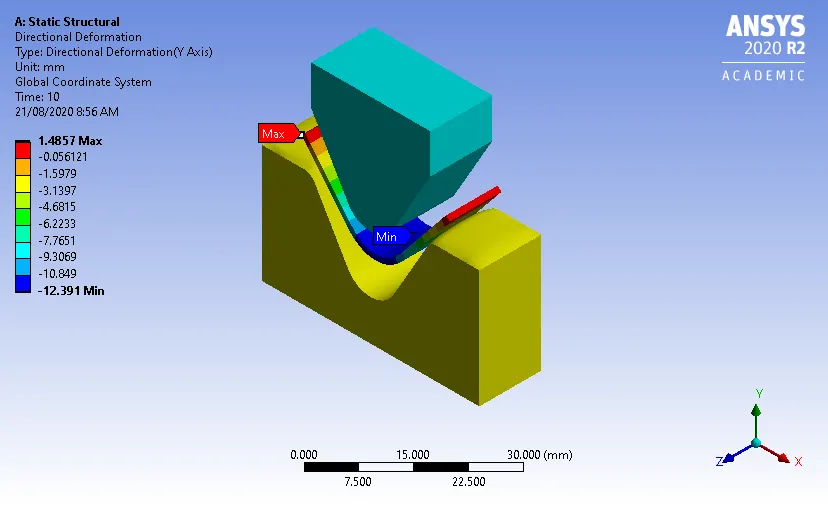
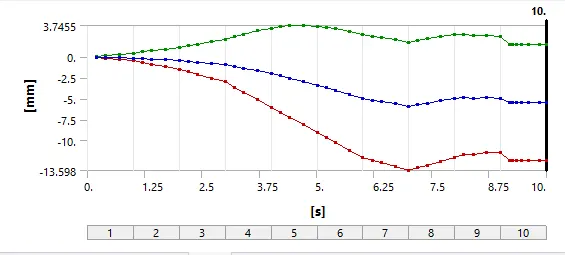
Magnesium: Total deformation in the y-direction and its graph with time.
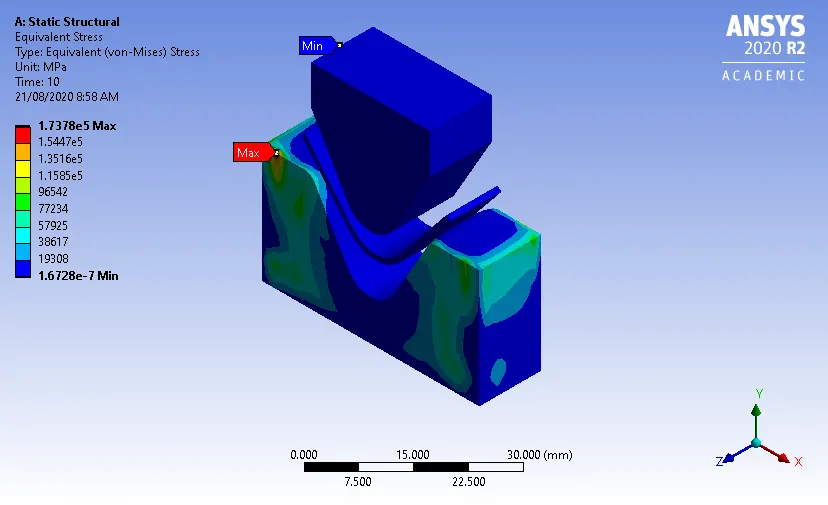
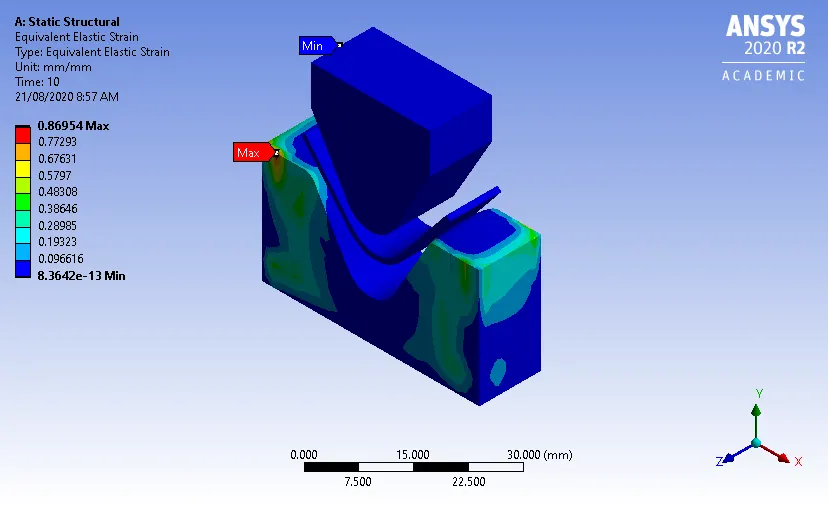
Magnesium: Stress and Strain developed in the model.
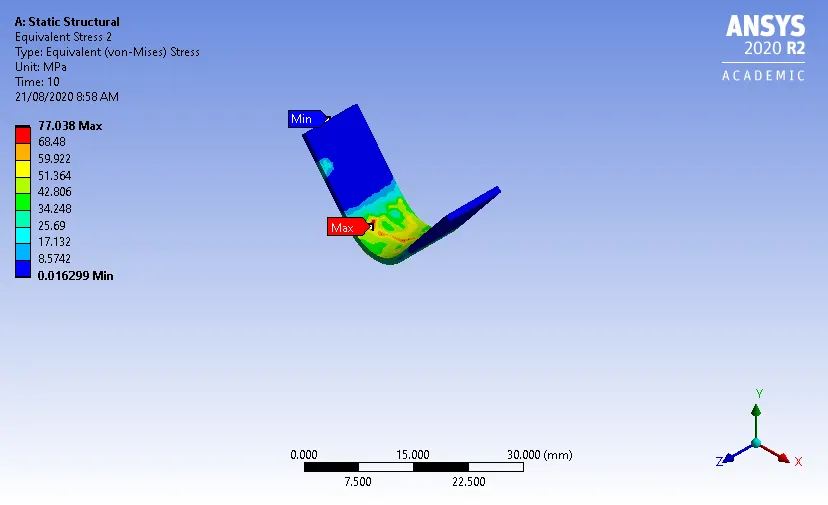
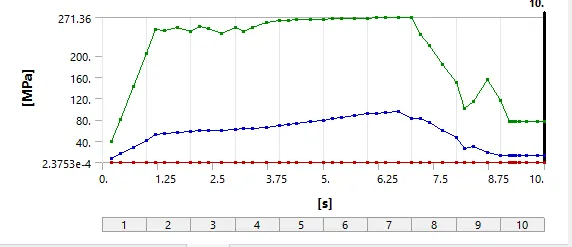
Magnesium: Stress and its graph for the plate with time.
Conclusion 1: From the table, it can be seen that the stress, strain and deformation are greater for aluminium compared to copper and magnesium alloys. But the stress on only the plate is less in case of aluminium which is the important factor to consider.
Case 2:
The comparison of results for different friction coefficient values are given in table 2:
| Y-axis deformation (mm) | Equivalent Stress (MPa) | Equivalent Strain | Equivalent Stress on the sheet (MPa) | |
| Aluminium (Friction Coefficient 0.1) | 12.476 | 2.49e05 | 1.2464 | 57.82 |
| Aluminium (Friction Coefficient 0.19) | 12.419 | 1.84e05 | 0.92173 |
58.824 |
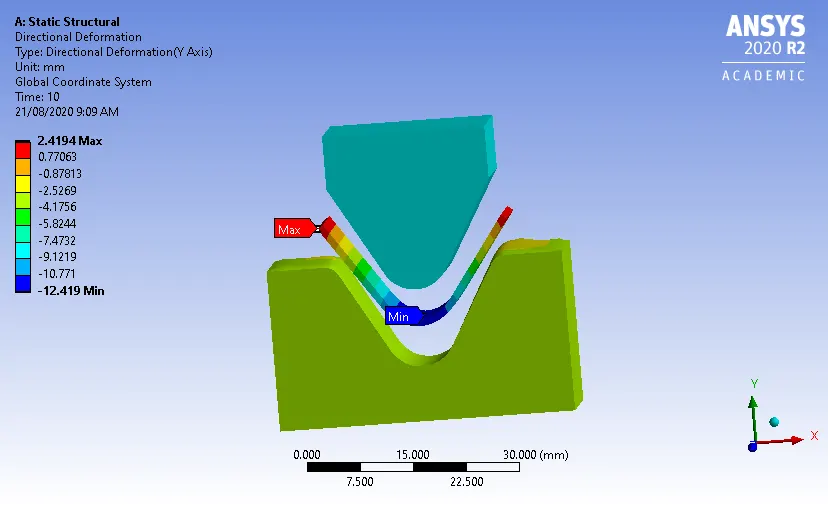
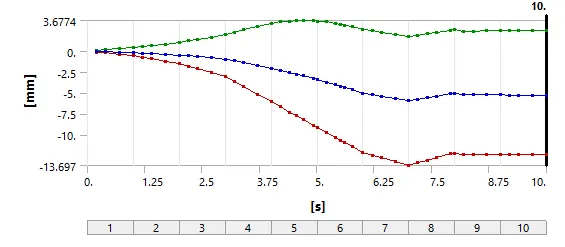
For Friction Coefficient of 0.19: Total deformation in the y-direction and its graph with time.
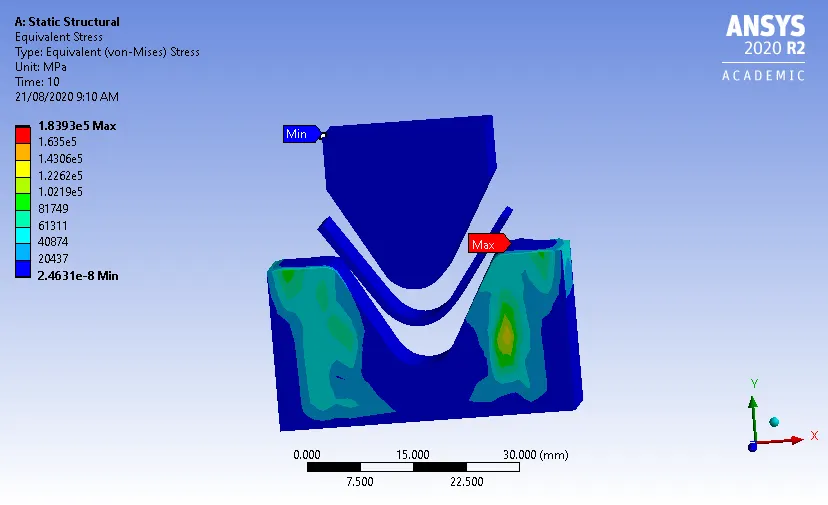
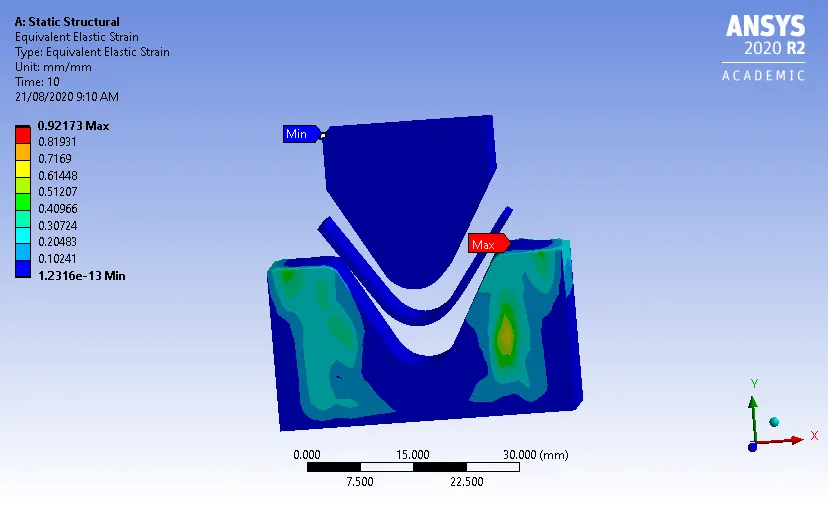
For Friction Coefficient of 0.19: Stress and Strain developed in the model.
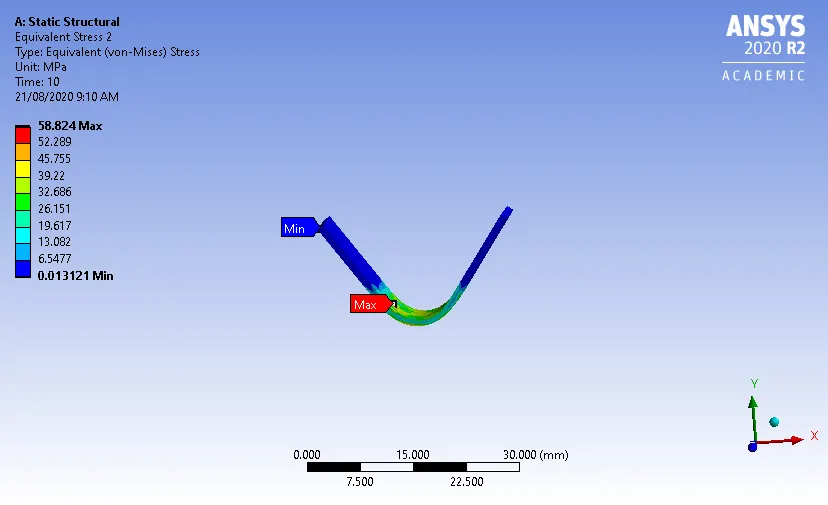
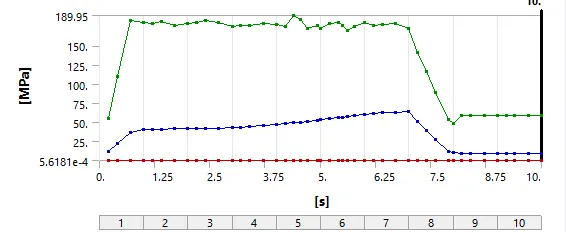
For Friction Coefficient of 0.19: Stress and its graph for the plate with time.
Conclusion: From the table, it can be seen that the stress, strain, and deformation decrease if we increase the friction coefficient. But the stress on the plate increases slightly.
Case 3:
The comparison of refined mesh results with coarse mesh for aluminium are given in table 3:
| Y-axis deformation (mm) | Equivalent Stress (MPa) | Equivalent Strain | Equivalent Stress on the sheet (MPa) | |
| Mesh size 1mm | 12.476 | 2.49e05 | 1.2464 | 57.82 |
| Mesh size 0.8mm | 12.401 | 3.25e05 | 1.6278 | 63.364 |
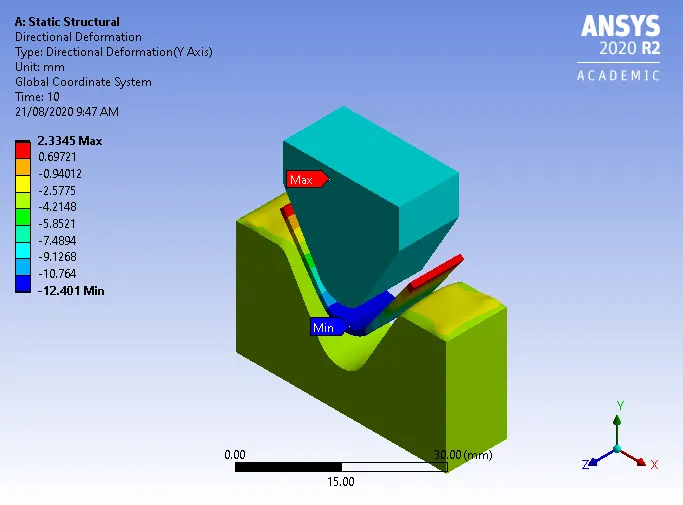
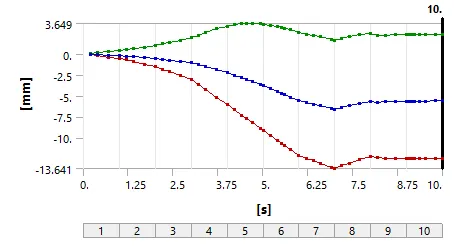
For mesh size 0.8mm: Total deformation in the y-direction and its graph with time.
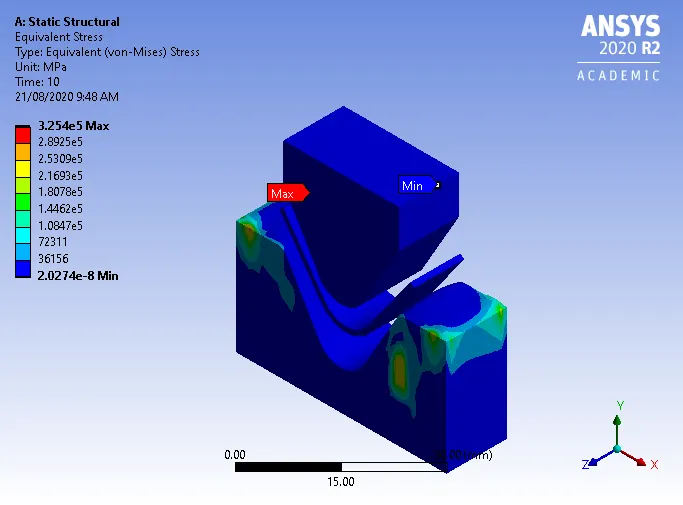
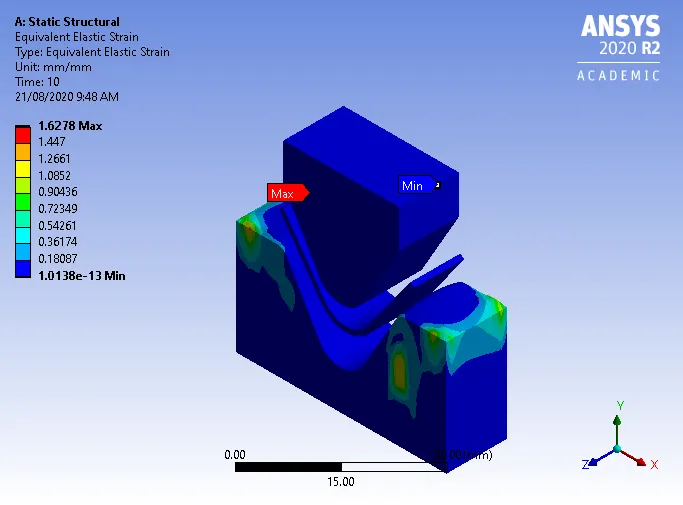
For mesh size 0.8mm: Stress and Strain developed in the model.
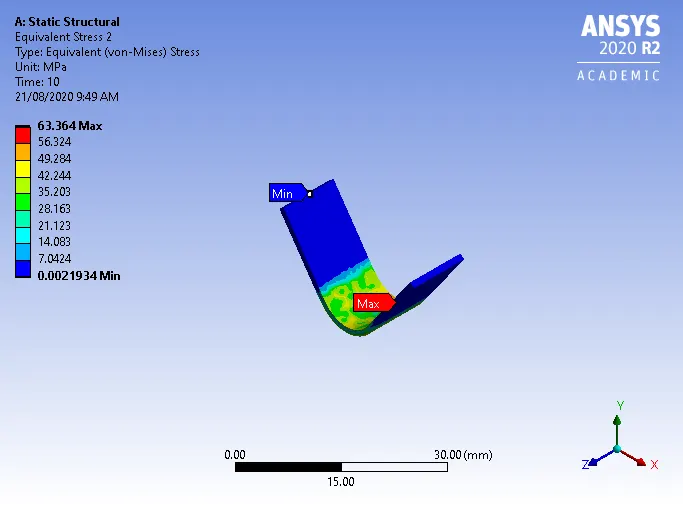
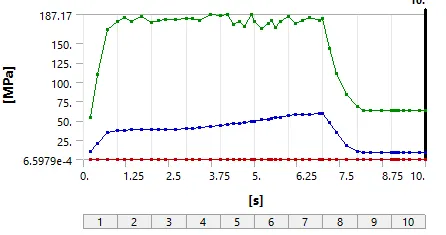
For mesh size 0.8mm: Stress and its graph for the plate with time.
Conclusion: From the table, it can be seen that the mesh refinement except for deformation all the other parameters increased the results by a significant amount.