Week 3 - External flow simulation over an Ahmed body.
Q1. Describe Ahmed's body and its importance.
Ans.: The ahmed body is also known as bluff body. It was developed for the research purposes & also for the experimental model to validate the result of the external flow simulation. It helps the enginners & researchers to capture essential flow characteristics around the body and also on bacof the body where wake region developed which creates low pressure zone. By changing the slant angle at the back of the car, researcher can study the wake region developed by different slant angle which will wb very helpful while designing vehicles.
Q2. Explain the reason for the negative pressure in the wake region.
When air pass through steep angle like the one in the back of ahmed body, seperation of flow occurs. The boundar laye of air moving over the wing slows down because it is forced to move from an area of low pressure to an area of high pressure. When the boundary layer of air slows down to a certain point, it detaches from the surface of the wing and becomes turbulent. This turbulent air has a lower pressure, which has an effect on pressure drag. Pressure drag occurs when air flowing past an object pushes harder against the front than the back. This difference creates a backward force. When separation of flow occurs, the turbulent air behind the airfoil decreases in pressure, causing an increase in pressure drag.
Q3. Explain the significance of the point of separation.
The flow region which presents the major contribution to a car's drag, and which poses severe problems to numerical predictions and experimental studies as weIl, is the wake flow behind the car. The location at which the flow separates determines the size of the separation zone, and consequently the drag force.
Model Generation:
Following steps has been taken to create model for simulation.
1. Ahmed body model
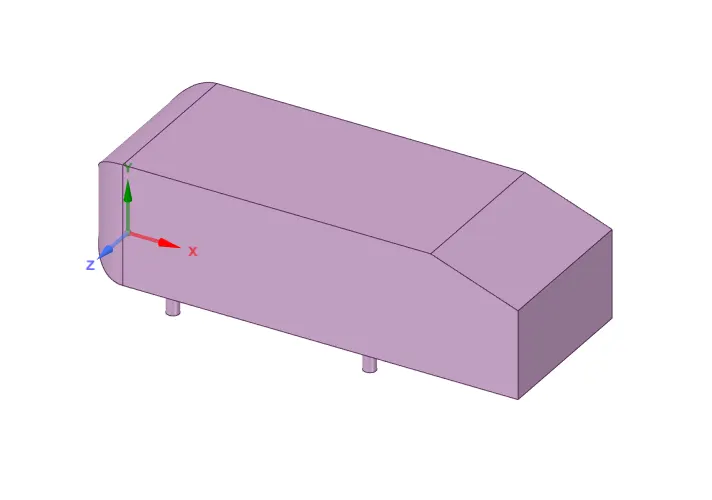
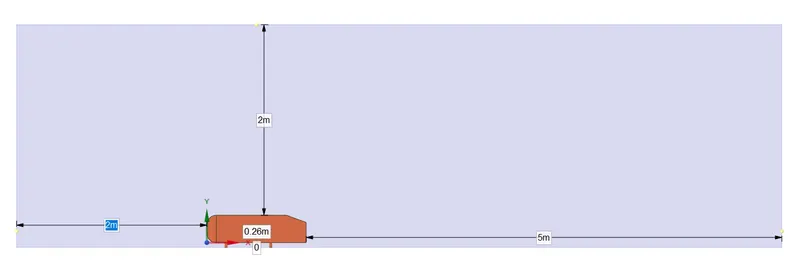
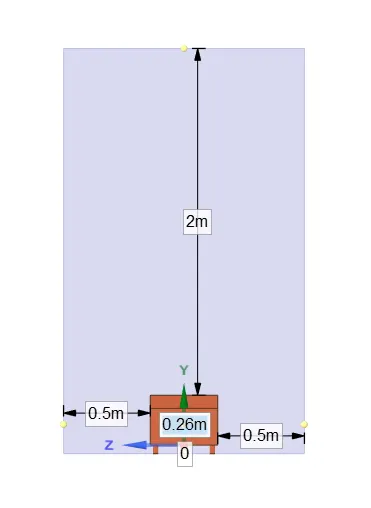
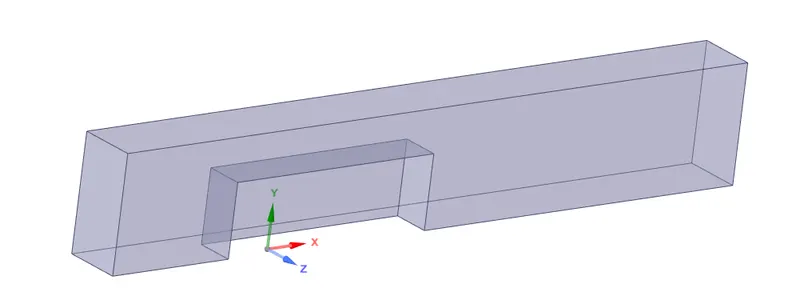
2. Outer Enclosure has been created to replicate the wind tunnel. Sizes has been mentioned in the image only.
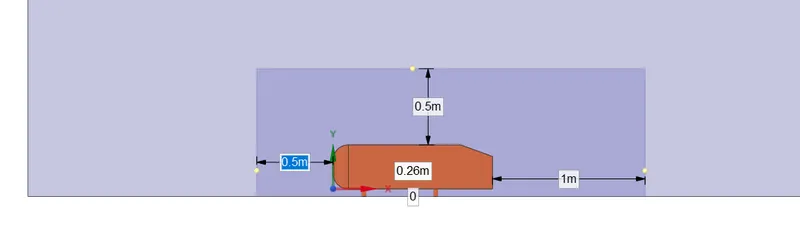
The inner enclosure has been created to refined the mesh around the ahmed body to improve the results & capture more details about the flow simulation around the model to understand flow characteristics. The inner enclosure has been used in second & third simulation only.
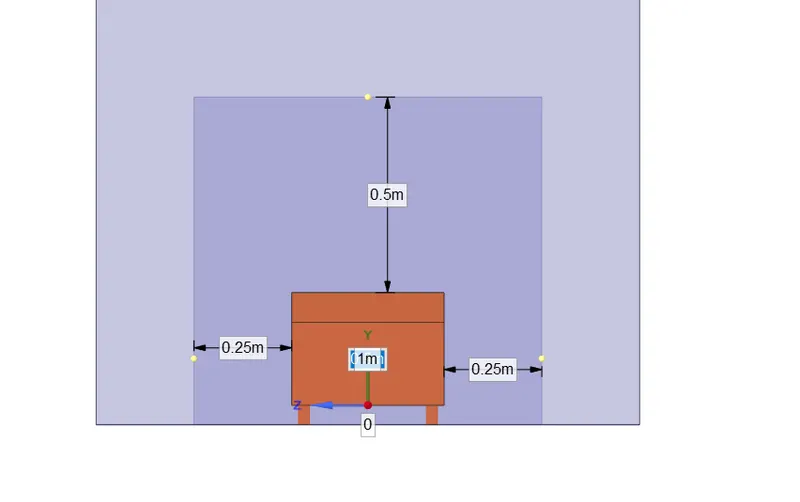
3. Datum plane has been created at origins.
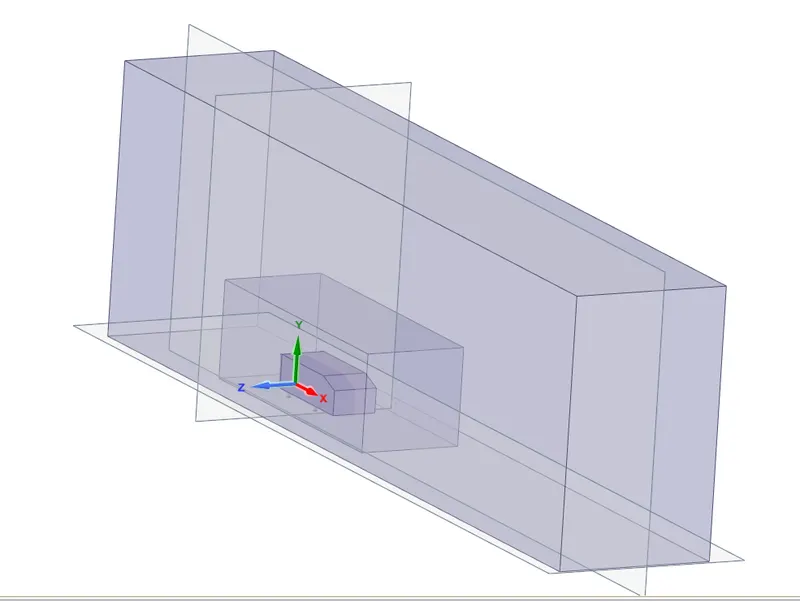
4. Using Split by Plane tool, half model has been removed to save the computational power & resources as the entire model is symmetric about XY plane. In below image, the pink portion has been deleted.
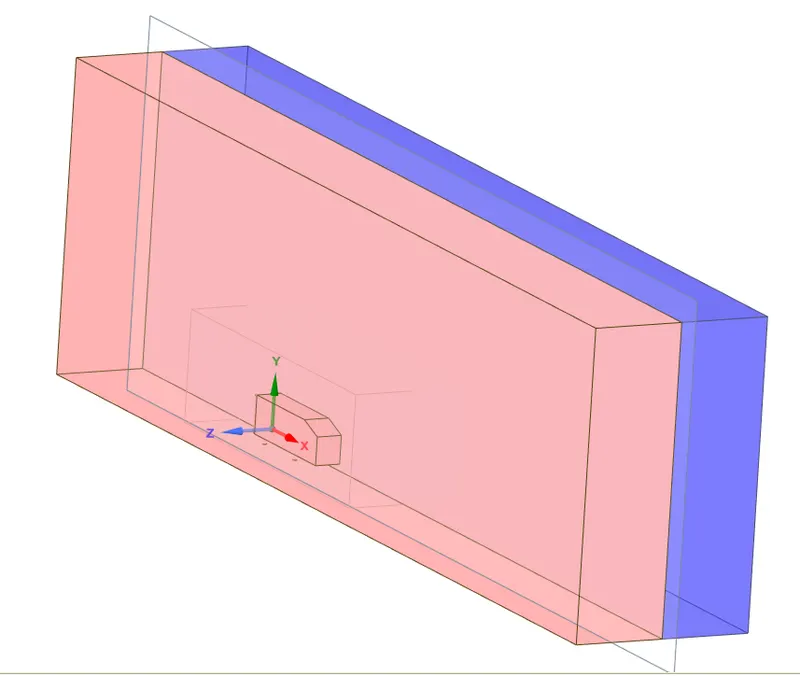
5. Final Model
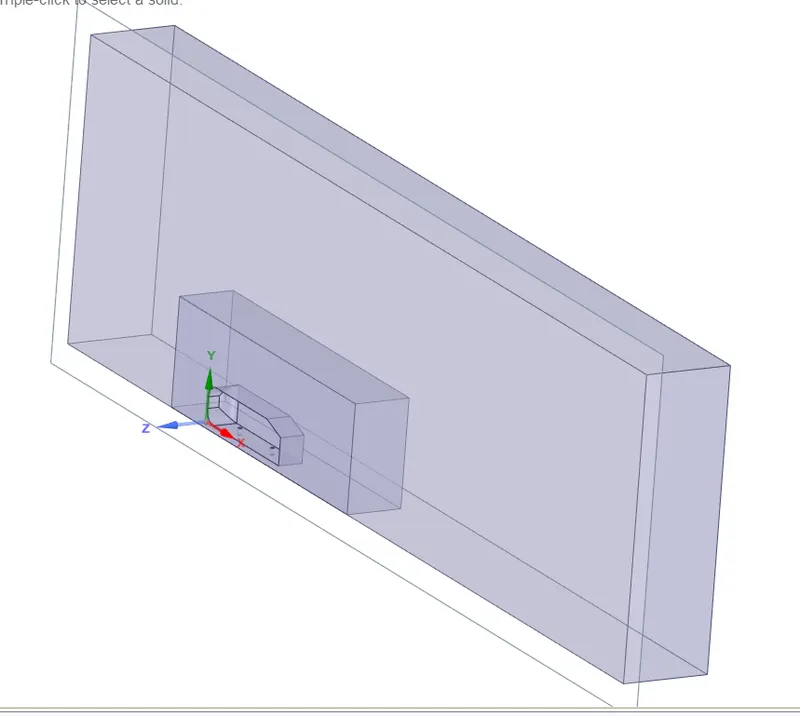
Meshing:
Meshing has been generated three times. First time meshing has been generated using default setting. Second time, the mesh has been refined using variuos tools & the third time, the mesh around the ahmed body has been refined with even smaller element size.
Meshing for first simulation:
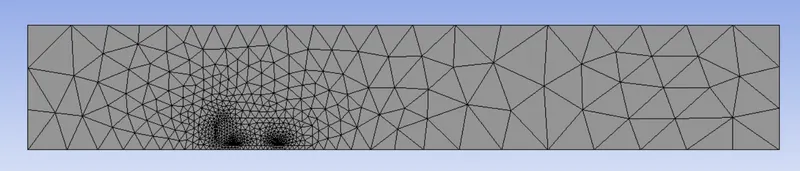
Mesh is very coarsed, but it has created smaller elements around the ahmed body.
Refined mesh for second & third simulation is as follows:

Initially, the inner enclosure & outer enclosure was overlapping each other. Because of that, the mesh elements were also overlapping. In Spaceclain, The Interference tool has been used to fix the overlapping & interfering geometry. After implementing tool, the portion of the inner enclosure has been deleted.
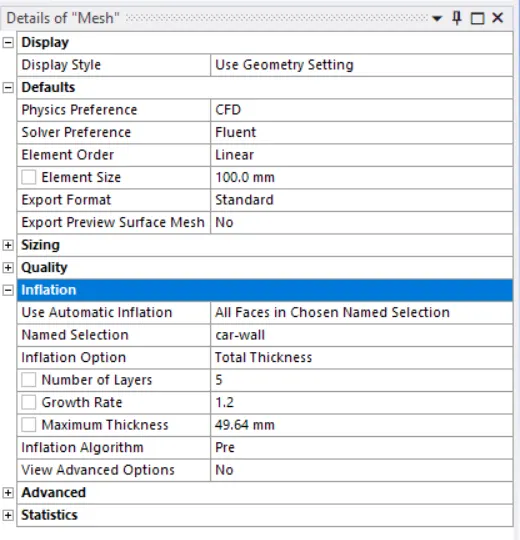
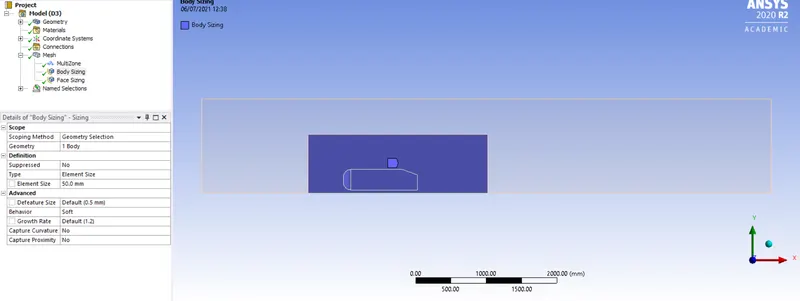
The mesh size has been kept same for second & third simualtion which is 100mm, but for inner enclosure, the mesh size has been used as 50mm for second simulation & 40mm for third simulation. In the above image of meshing, the green portion is the inner enclosure. To improve the mesh around the ahmed body boundary, inflation layers has been created.
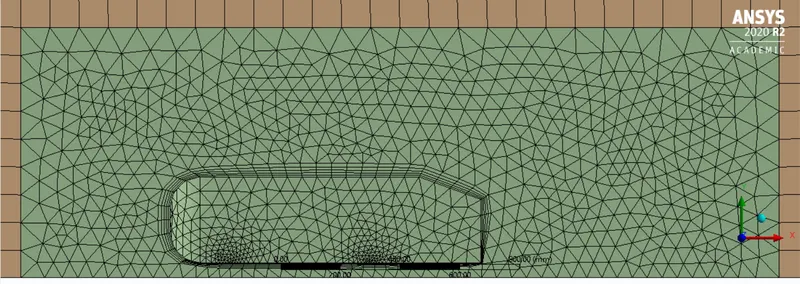
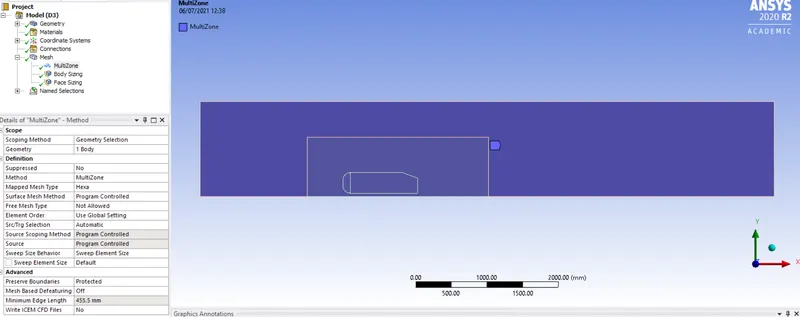
To create hexa meshing in the outer enclosure as shown in the above image, the multizone method has been used to assign the hexa elements.
The mesh element size has been assigned to the inner enclosure using body sizing. 50mm element size is for second simualtion & 40mm has been assigned for third simulation.
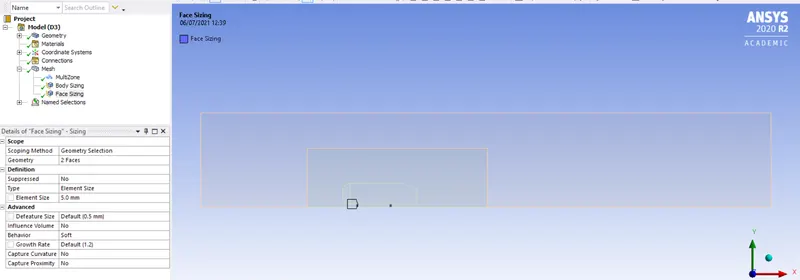
The legs of the ahmed body has been refined seperately using face meshing because of the very small in dimension.
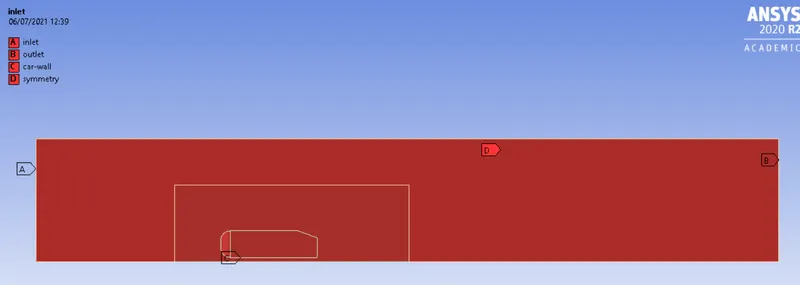
The name has been given to different faces usinf Named Selection option.
Simulation Setup:
The simulation will be performed under steady state condition. And density based will be used.
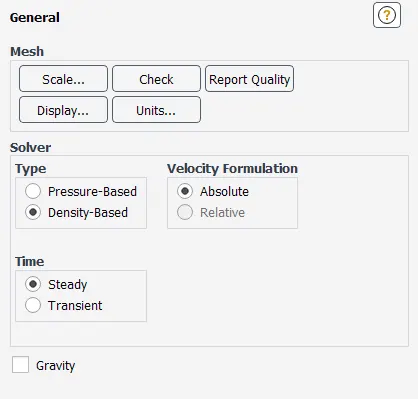
Following physics option has been selected.
Energy -ON
Viscous Model - Standard K-epsilon Model with standard wall function
Material - Air (Default)
Boundaries -
Inlet - 25 m/s air velocity
outlet - pressure outlet - gauge pressure - 0 Pa
Ahmed body - wall
Initialization Method
Hybrid Method
Reference Values
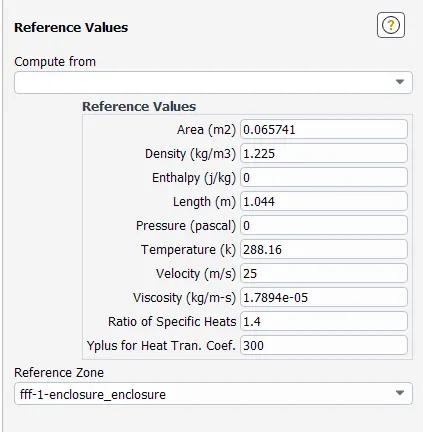
The area has been calculated using the Projected Area option in Results tab.
Post Processing:
Drag Coefficient - Force report has been created for ahmed body
Lift Coefficinet - Force report has been created for ahmed body
For Drag coefficient,
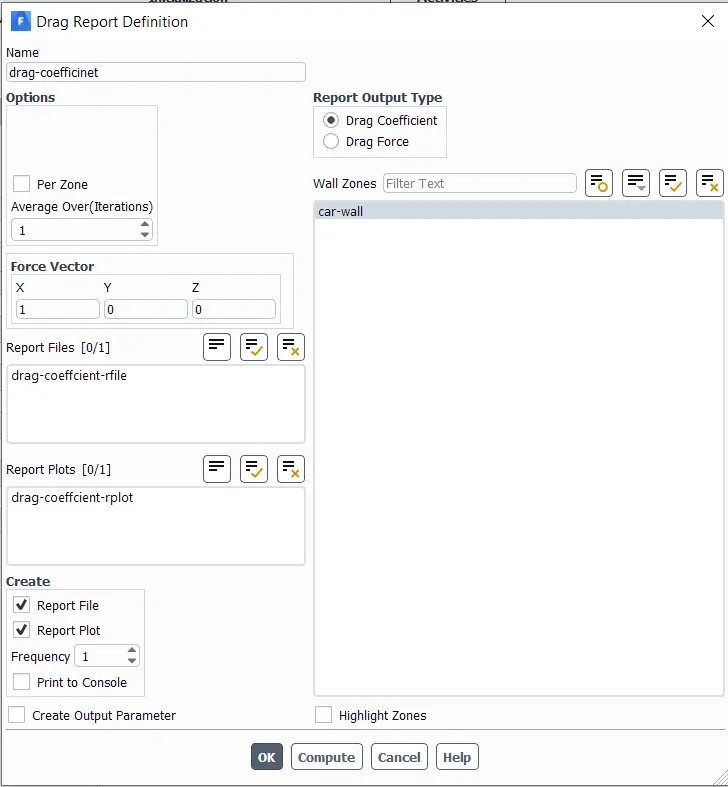
Similar way, for lift coefficient report has been set up.
After initializing the processing, the velocity & pressure contour plots has been created.
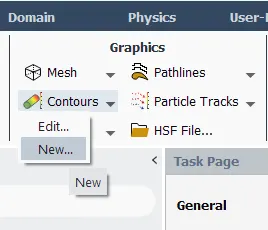
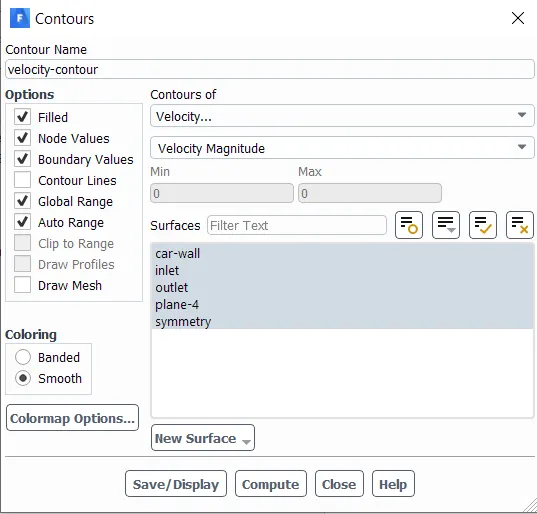
Similar way pressure contour has been created from the same dialogue box shown in above image.
Results:
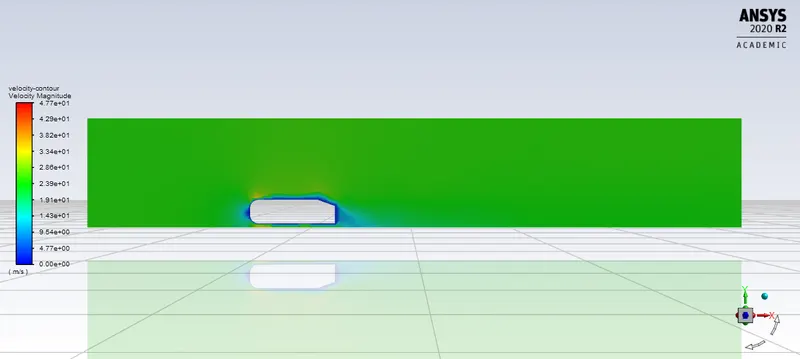
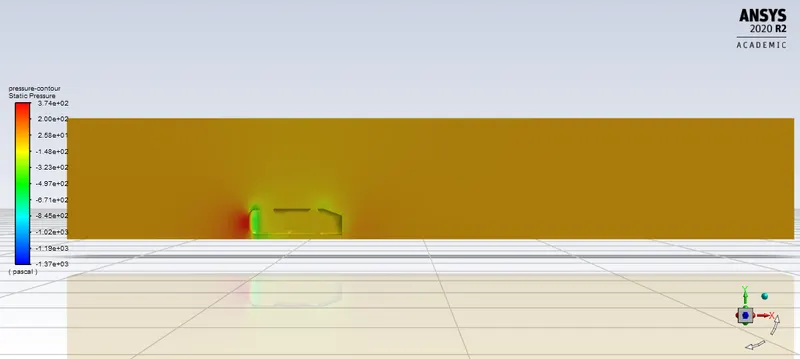
1. Velocity & Pressure Contour
For Baseline case
For Refined -1 case,
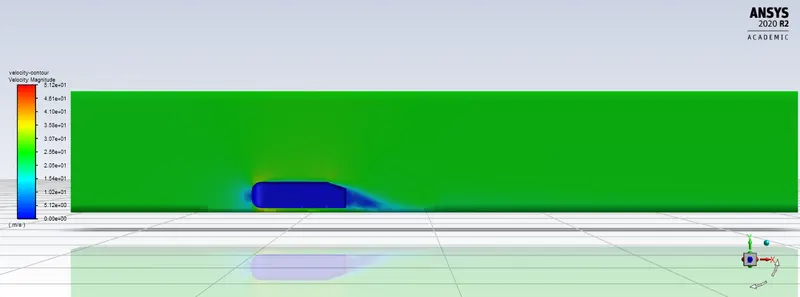
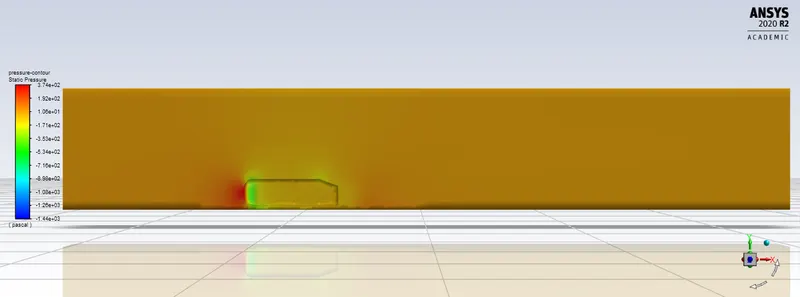
For Refined Case -2
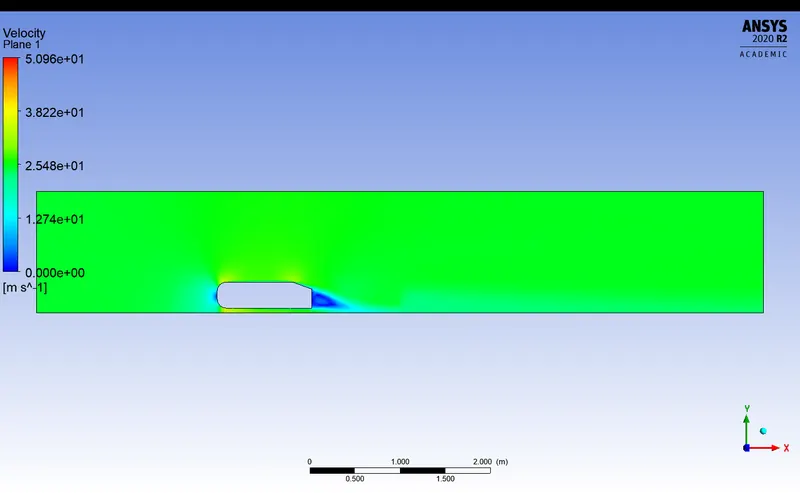
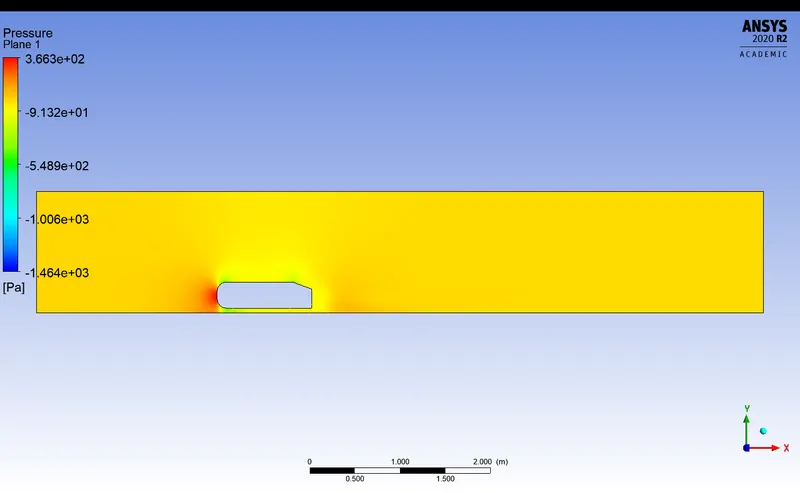
2. The drag coefficient plot for a refined case.
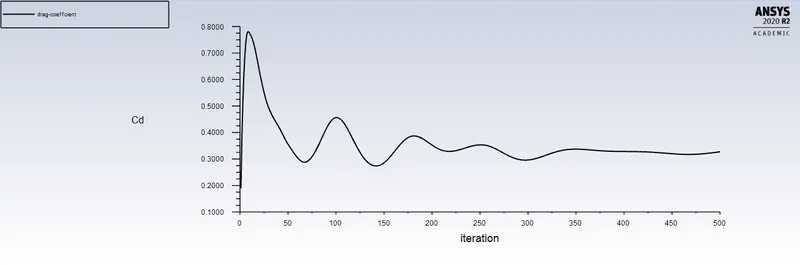
For Refined Case -1
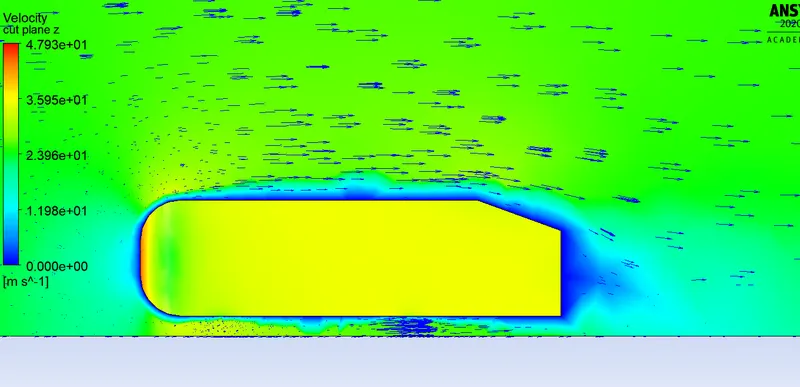
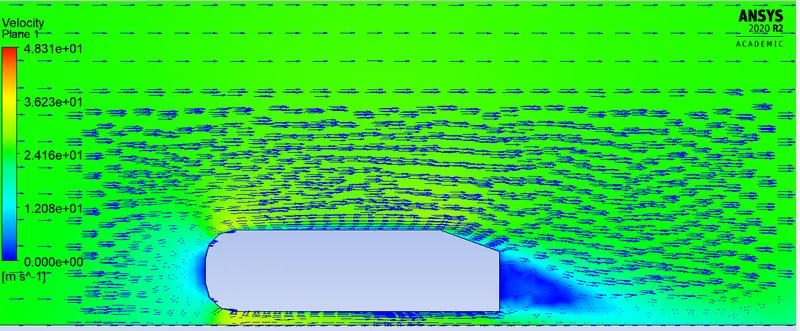
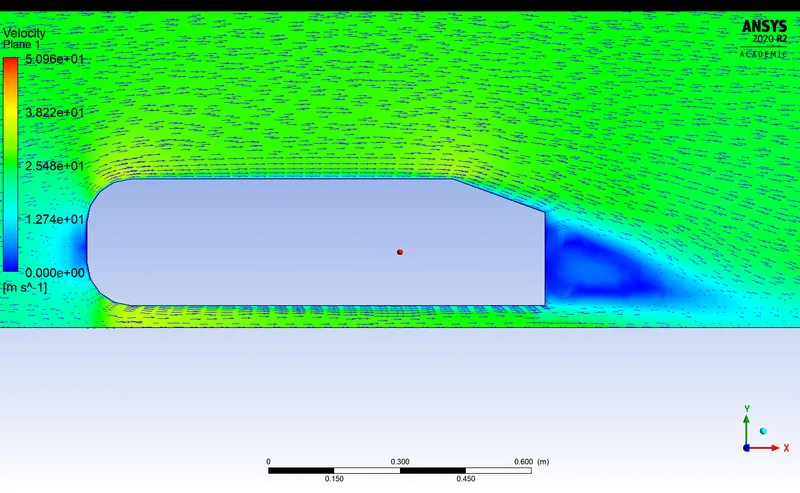
3. The vector plot showing the wake region in all three simulations.
For Baseline Case
For Refined Case -1
For Refined Case -2
4. Perform the grid independency test and provide the values of drag and lift with each case.
Grid Independence Study
| Simualtion Case | Mesh Element Size (mm) - Outer | Mesh Element Size (mm) - Inner | Drag Coefficient | Lift Coefficient |
| Baseline | 500 | N/A | 0.38 | 0.31 |
| Refined -1 | 100 | 50 | 0.33 | 0.24 |
| Refined -2 | 100 | 40 | 0.32 | 0.22 |
In this challenge, the velocity & pressure contour plots has been preseneted for all three cases. The details in 6 images are vary with the mesh quality. The wake region behind the ahmed body in the velocity plot is the most differentiated part all three velocity contour plots. The details in the wake region is increasing with the mesh quality. In the similar way, the pressure contour plots also vary with the mesh quality. The most details are presented in the Refined Case -2 presure contour plot. The maximum pressure can be seen at the front & at the back of ahmed body.
The vector plot focusing on the wake regions has also been presented with vector plots. The details & accuracy increases with the mesh quality. The arrows are the air flow movement around ahmed body & especially in the wake region. Because of low pressure, the air is started moving inside which can be seen in the blue portion. This air movement is pulling in the body in the downward direction. The inflation layers have also captured very good details in refined case -2 image especially.
The drag coefficient pot also preseent for the refined case -1. The computed drag coefficinet for the same case is 0.33.
At last, grid independent study has been performed which is presented in above table. The drag coefficient is almost similar for refined case -1 & refined case -2. But for baseline case, the drag coefficient has been little higher because of very coarse mesh.
References:
1. https://howthingsfly.si.edu/ask-an-explainer/how-does-separation-flow-affect-pressure-drag
2. https://aerospaceengineeringblog.com/boundary-layer-separation-and-pressure-drag/