Week 3 - External flow simulation over an Ahmed body.
AHMED BODY
Aim :
The aim of this project is to find the drag and lift co-efficient of the flow over the ahmed body and validate it by comparing the results to experimental results. Also to do a grid dependency test to fiugre out the optimal meshing set up.
Introduction to AHMED BODY:
The Ahmed Body was first created by S.R. Ahmed in his research “Some Salient Features of the Time-Averaged Ground Vehicle Wake” in 1984. Since then, it has become a benchmark for aerodynamic simulation tools. It is a generic car body (a simplified vehicle model). The airflow around the Ahmed body captures the essential flow features around an automobile and was first defined and characterized in the experimental work of Ahmed . Although it has a very simple shape, Ahmed body allows us to capture characteristic features that are relevant to bodies in the automobile industry.
This model is also used to describe the turbulent flow field around a car-like geometry. Once the numerical model in validated, it is used to design new models of the car.
Geometry:
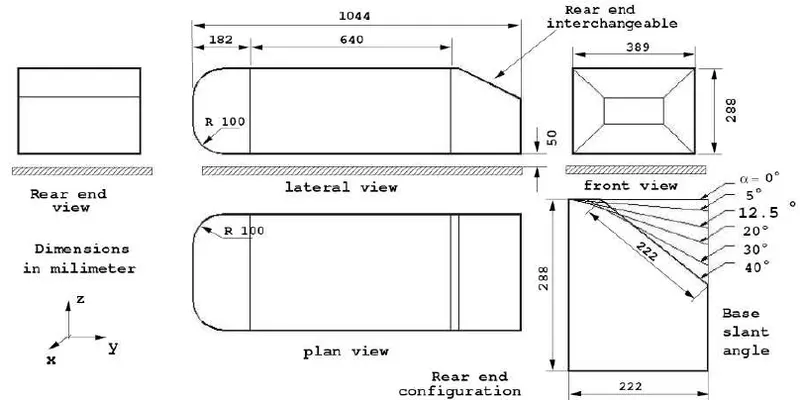
The simple geometrical shape has a length of 1.044 meters, height of 0.288 meters, and a width of 0.389 meters. It also has 0.5-meter cylindrical legs attached to the bottom of the body and the rear surface has a slant that falls off at 40 degrees. The complete geometrical specifications can be see below.
Importance and application of ahmed body :
In this era of increasing fuel prices and focus on efficiency, aerodynamics of the automobile plays very important role. From driving stability to reducing emissions, aerodynamics of a vehicle plays important role. Understanding the air flow around a vehicle and optimizing it can be made easy by carrying out CFD simulations rather than creating a scale model and testing it in wind tunnel every time there is a small change can be tedious and the closest thing to a general vehicular body is ahmed body. Hence having a reliable and accurate CFD simulation package is very important. The validation of the CFD packages can be checked by simulating a flow around the ahmed body and comparing it to the experimental data and thus the package can be optimized accordingly.
Geometry Preparation:
The ahmed body model is loaded into the space claim for the geometry preparation.
Outer enclosure :
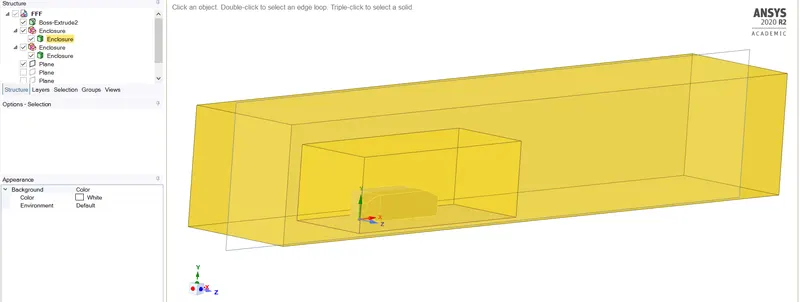
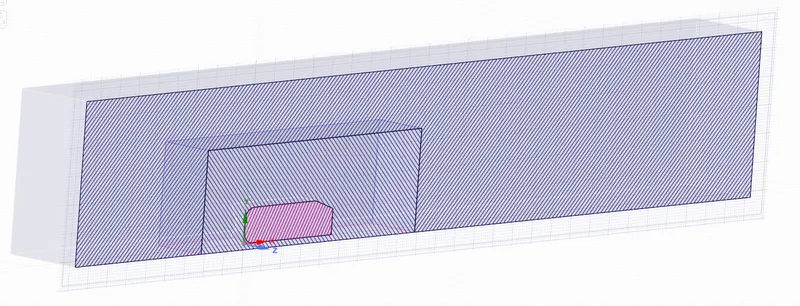
An outer enclosure is added with an inlet wall 2m from front of ahmed body, exit wall at 5m from rear of ahmed body, side walls are set at 0.5m away on each side, top wall being a meter away and bottom enclosure being 0 constitutes as a outer enclosure and is used of baseline mesh.
The image below shows the outer enclosure set up around the ahmed body
Inner enclosure :
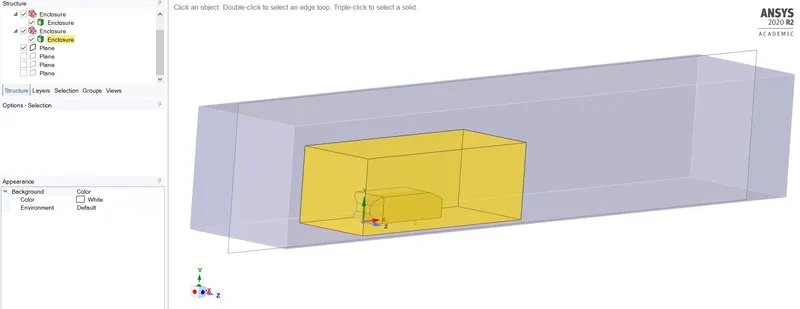
An even finer enclosure within this enclosure is added with front face being a meter away from the face of the ahmed body and sides at a distance of 0.25m on both sides, top wall being 0.5m, a meter away at the rear and 0 at the bottom.
The image below shows the inner enclosure set up around the ahmed body
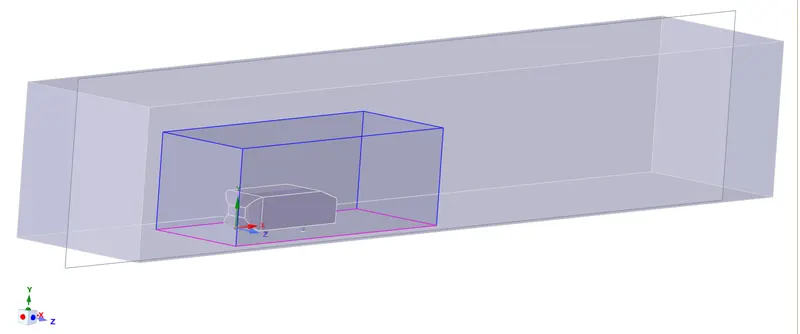
The image below shows the enclosure set up around the ahmed body
Preparation of geometry :
In order to have a continuous flow inside th eenclosure, mesh overlap between the enclosure has to be avoided, hence interference check is done and the problem is rectified.
Meshing:
1) Baseline mesh - 80- 250 thoushand elements
case 1 :
- Element size - 150mm
- Number of elements - 109058
- Number of nodes - 21577
case 2 :
- Element size - 100mm
- Number of elements - 195100
- Number of nodes - 37253
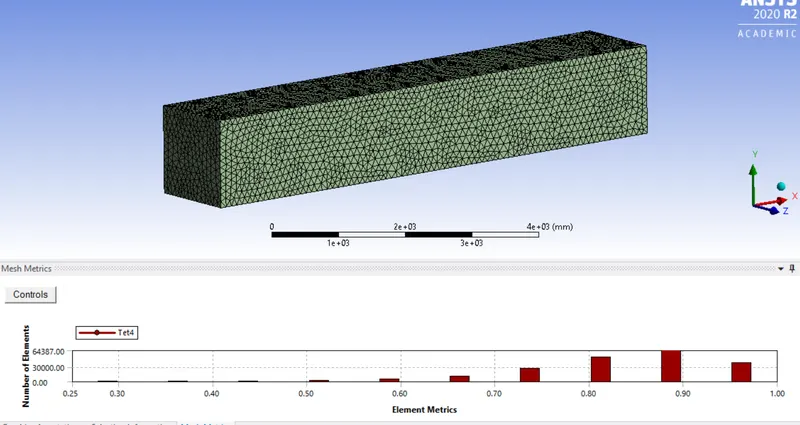
A baseline mesh is a simple mesh around the ahmed body with bare minimum meshing is done to obtain a result.
The image below shows the element quality of the mesh-
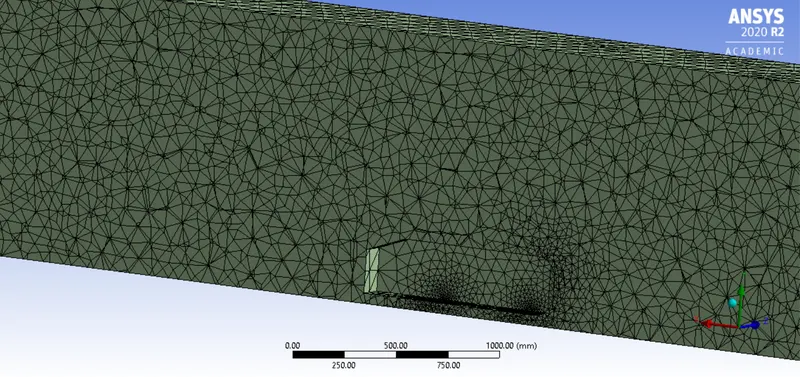
The image below shows the cut section of the mesh-
2) Refined mesh - close to 500 thousand elements
- Element size : 75mm
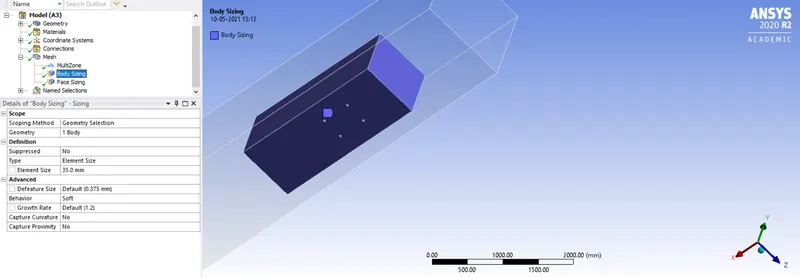
- Body sizing : 35 mm
- Face sizing : 3 mm
- Number of elements : 450850
- Number of nodes : 126991
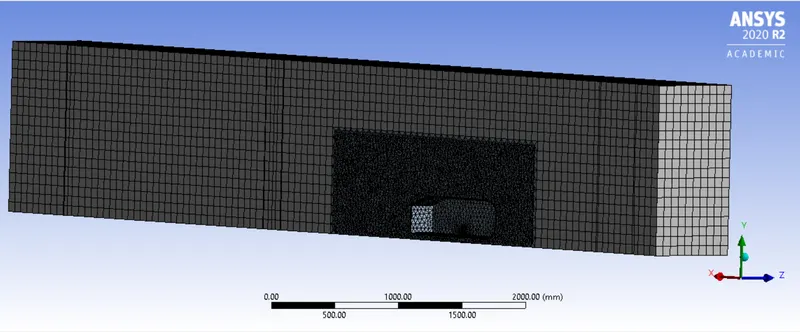
Since the outer enclosure does not have any curves or intricate structures, hexahedral mesh can be used. This allows us to get the highest quality of mesh and the image below shows the hexahedral mesh of the outer enclousure.
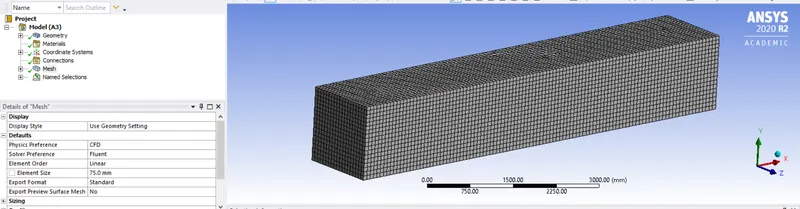
The image below shows the multizone method used on outer enclosure to obtain hexahedral mesh
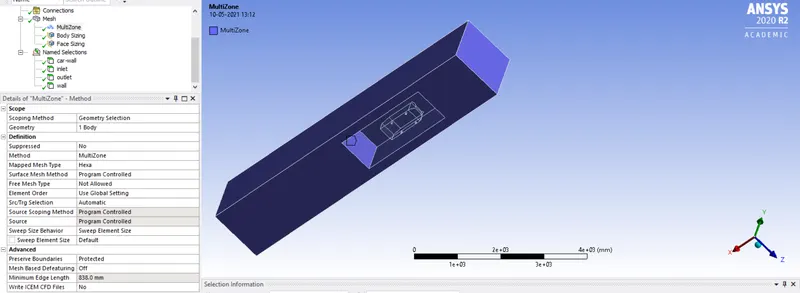
The image below shows the cut section view of the mesh and no meshoverlapping is seen
In order to obtain better results the mesh around the ahmed body is made finer by using the body sizing method as shown in the images below
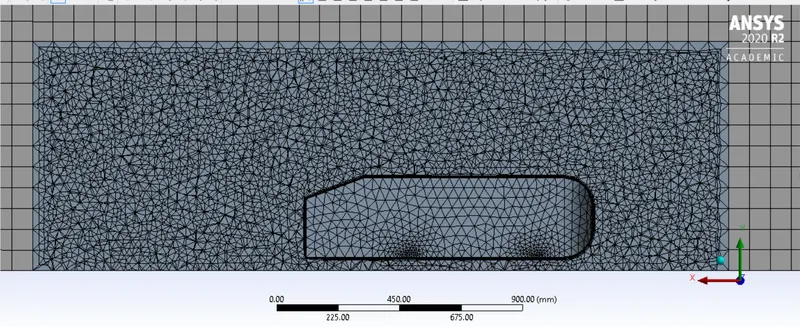
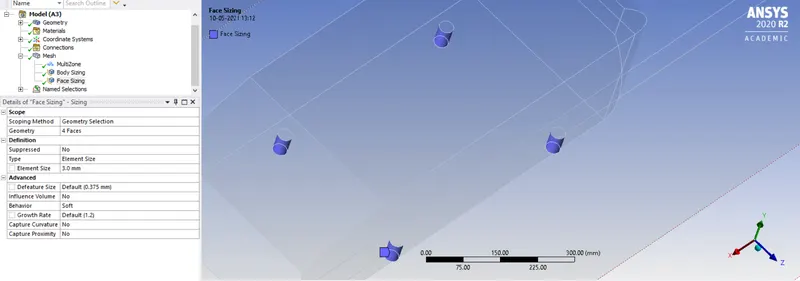
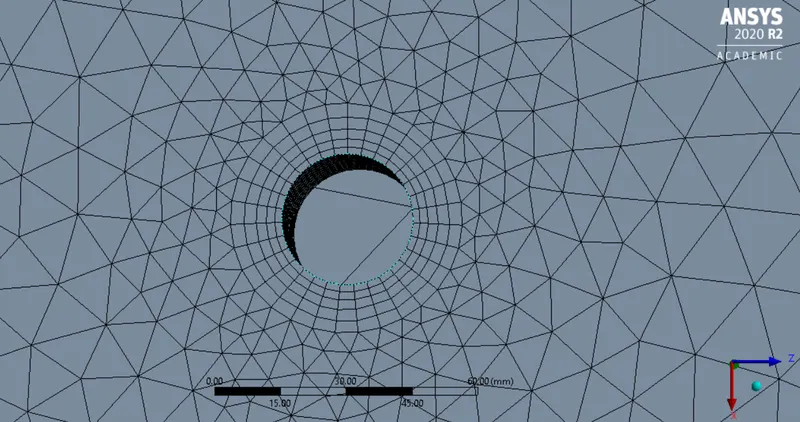
The face sizing operation is done on the pegs on which the ahmed body stands on, this is because, after the body sizing of the enclosure the pegs were seemed to have become more of a polygon than a cylinder. To overcome this face sizing operation is used to get as close to as circle as possible. The images below shows the same
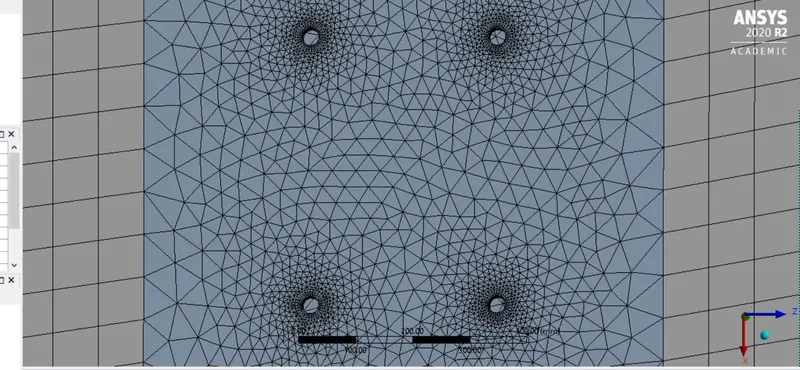
A close up view of the meshing around the pegs can be seen in the image below
Pre-processor set up :
Solver set up :
- Set up type - Density based solver
- Time - Steady state simulation
- Absolute velocity formulation
- Viscous model - K-epsiolon
- Flow Material - air
- Inlet velocity - 25m/s
- Temperature - 300k
- Density - 1.225 `(Kg)/m^3`
- Viscosity - 1.7894e-05 `(Kg)/(m s)`
- Gauge Pressure - 0 Pa
Reference values:
- Frontal Area : 0.115`m^2`
- Density : 1.225 `(Kg)/(m^3)`
- Length : 1.04m
- Ratio of specific heats : 1.4
Calculations :
Frontal area of Ahmed body is given by - height * width + area of pegs
Height = 288 mm
width = 389 mm
288*389 + (2*(30*50))
Area is given by 0.115 `m^2`
Results :
Case 1 : Baseline mesh
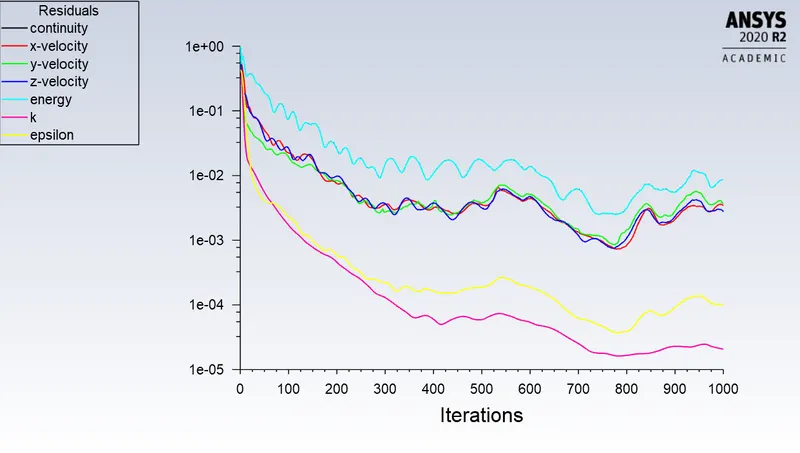
The image below shows the scaled residuals for the baseline mesh
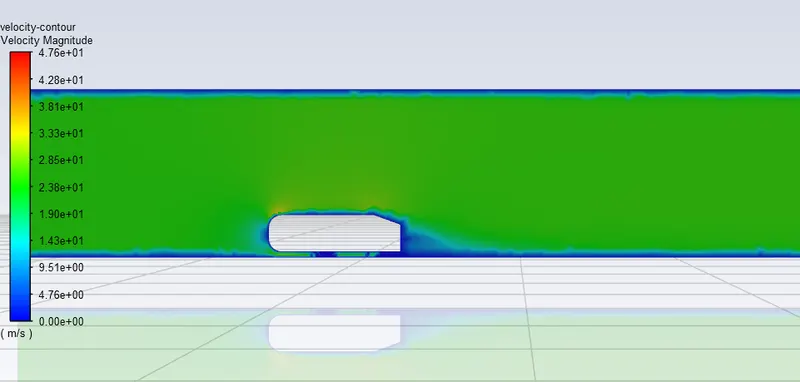
The image below shows the velocity contour of the flow around the ahmed body. As we can see the result obtained does not provide us with clear information as the boundary layer is not fine enough. The velociy contours are not smooth too. There is a significant drop off in the flow velocity behind the ahmed body.
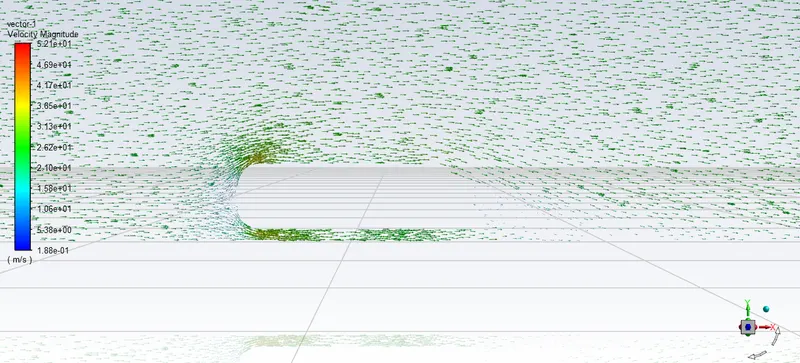
In the image below the vectors of velocity magnitude of the flow arounf the ahmed body can be observed. It is seen that there is a flow seperation region behind the ahmed body which contributes to the drag force.
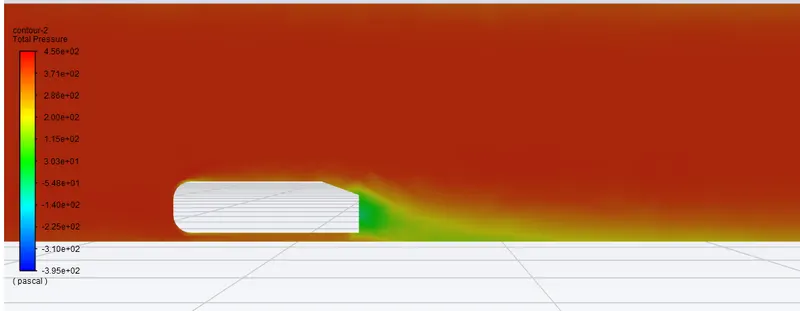
The image below shows the pressure contour around the ahmed body. The low pressure behind the ahmed body can be seen and the pressure contours are sloped along the negative rake behind the top of the body and continues downwards.
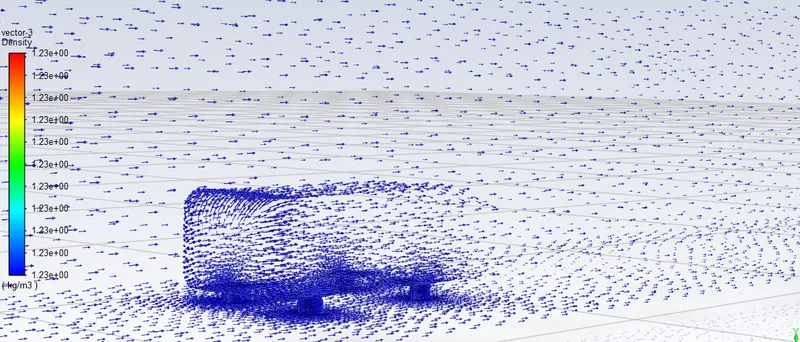
The image shows the density vectors of the flow around the ahmed body.
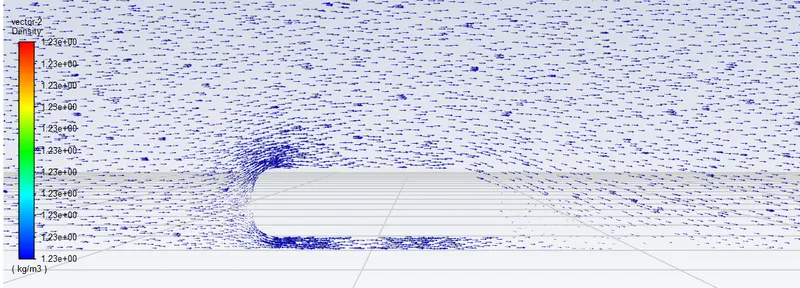
This image shows the 3d vectors of the flow density of the ahmed body. This is significant because we can see an abundance of flow around the pegs supporting the ahmed body and this is due to the non refined shape of the pegs in the base line mesh and this turbulance leads to higher drag forces. This discripency can be ovvercome by refining the mesh around the ahmed body and creating a boundary layer to obtain much accurate results.
Case 2 : Refined mesh
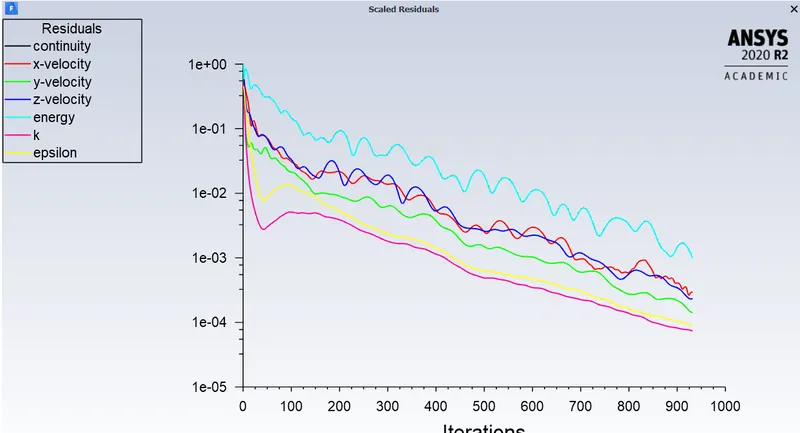
The image below shows the scaled residuals for the refined mesh
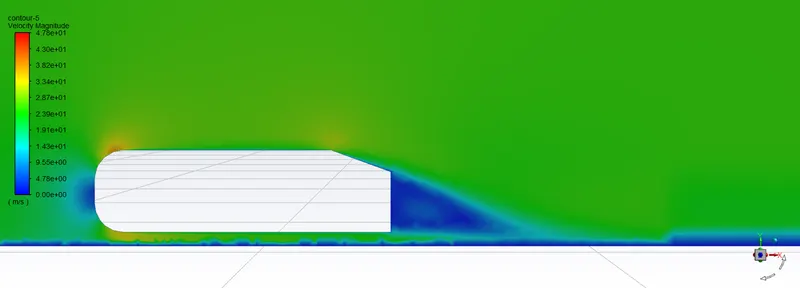
The image below shows the velocity contour plot as we can see that the air flow behind the ahmed body significantly reduces, also around the front face. We can see there is a diffrence of air speed at the edges and the curves of ahmed body, this is caused due to the air slipping out into diffrent pressure(pressure difference between the either side of the edges affects the speed of the air flow).
At the beginning of the simulation it can be observed that a vortex is created behind the ahmed body due to which the drag and lift coefficients varies significantly and as the flow stabilizes the flow velocity is as seen below.
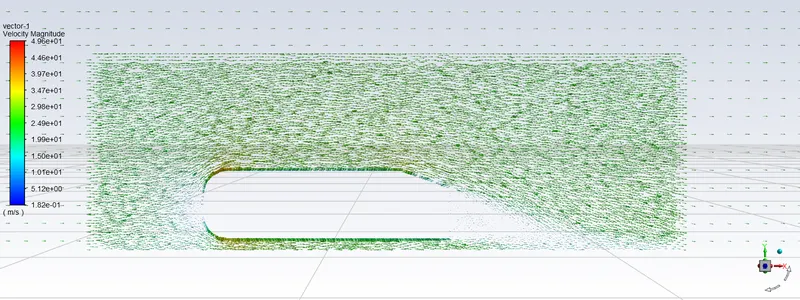
The image below shows the velocity magnitdue vector plot. It can be observed that, due to the flow seperation at the rear of the ahmed body a wake region is created. The air flow is attched to the body on the horizontal surfaces and as there is a 40 degree slope the flow starts to seperate from the body creating low pressure and as the flow reaches the end, a full 90 degree vertical drop for the air which cannot be followed by the air as it carries enough momentum to keep the motion tending towards the X-direction. This phenomenon of flow seperation behind the ahmed body creates a low presssure region which is known as wake region. This is the reason due to which negative pressure is created in the wake region.
When the flow direction is towards positive x axis, in the image we can observe that the velocity vectors behind the ahmed body in the wake region is moving towards negative x axis which supports the case for the negative pressure in the wake region.
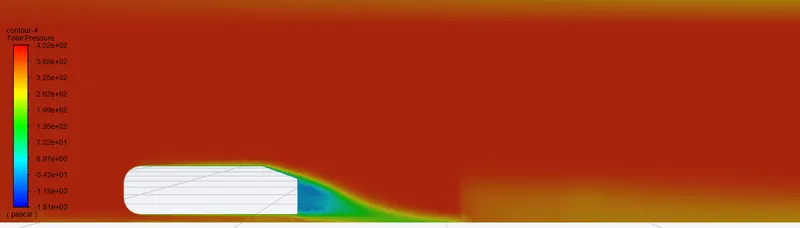
The image below shows the pressure contour of the flow around the ahmed body. The light blue region at the rear of the ahmed body suggests the negative pressure being created that leads to wake region. Since the pressure at the front of ahmed body is high and is lower at the rear and the air tends to move from high pressure to low pressure region a force against the direction of motion of ahmed body is created and this force is known as drag force.
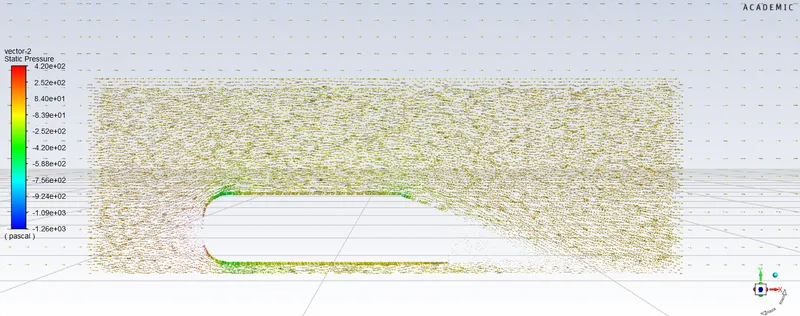
The image below shows the static pressure vector. It can be observed that there is a drop of pressure at the edge (flow seperation) regions. The pressure remains almost constant when the flow is attched to the boundary layer. As usual the pressure is highest at the frontal surface of the ahmed body and lowest or negative at the flow seperation region.
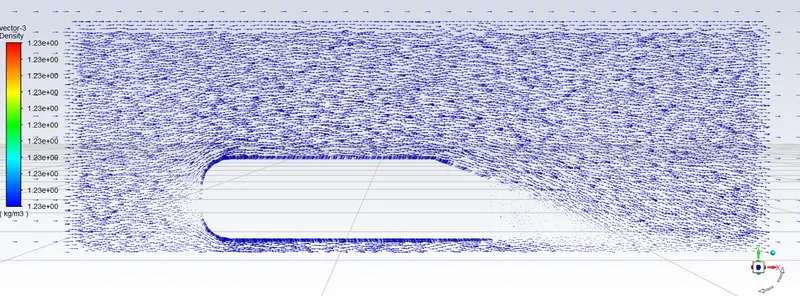
The image below shows the density vector of the flow and we can observe there is almost no air flow at the rear of the ahmed body which results in the negative pressure at the wake region. This ngative pressure is the main reason for the form drag acting on the body due to flow seperation. The high density of flow attched to the body results in the many layers of air flow shearing over one another leading to skin friction drag.
Conclusion :
|
Mesh type |
Number of elements |
Drag co-efficient (Cd) |
Lift co-efficient (Cl) |
|
Baseline mesh |
109058 tetrahedral cells |
0.43953 | 0.298781 |
|
Baseline mesh with smaller cells |
2,95,058 tetrahedral cells |
0.42268 | 0.28984 |
|
Refined mesh |
4,50,850 elements | 0.39526 | 0.32691 |
Based on the grid dependency test, more refined the mesh higher the accuracy of results obtained. As the baseline mesh failed to produce closer and expected results to that of refined mesh it can be determined that the results starts to get nearer to the experiment values. Due to the constraints of the software availability, much refined mesh test was not possible but the results are converging towards the actual values as the mesh gets finer.