Week 3 - External flow simulation over an Ahmed body.
EXTERNAL FLOW SIMULATION OVER AN AHMED BODY
Aim
To simulate the flow over an ahmed body using ANSYS Fluent.
Objective
Problem Statement:-
- Describe Ahmed's body and its importance.
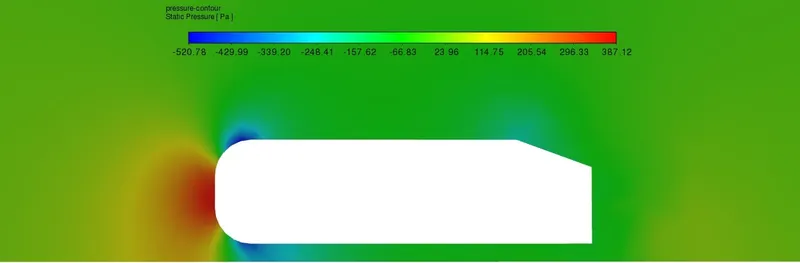
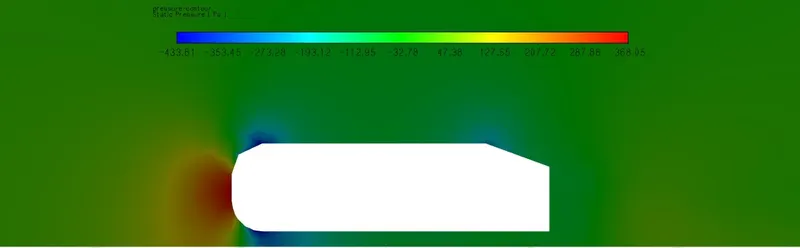
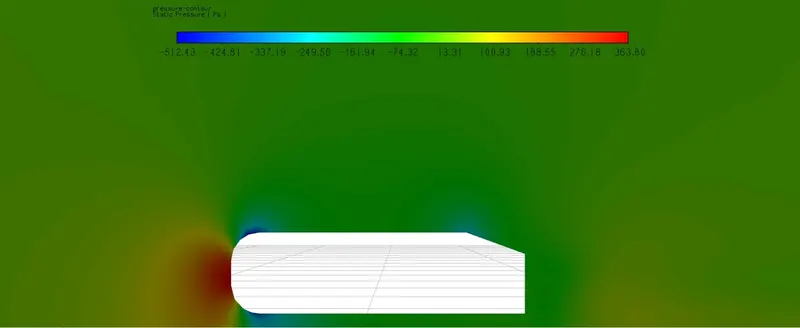
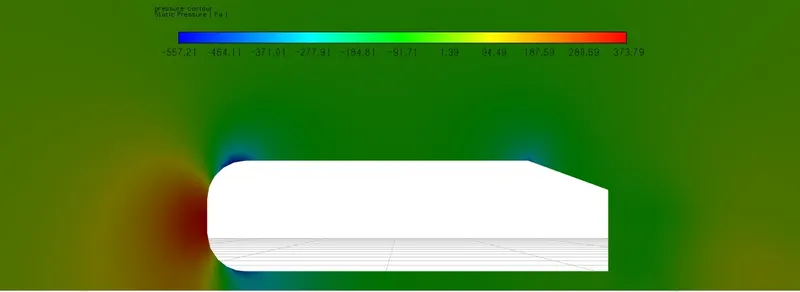
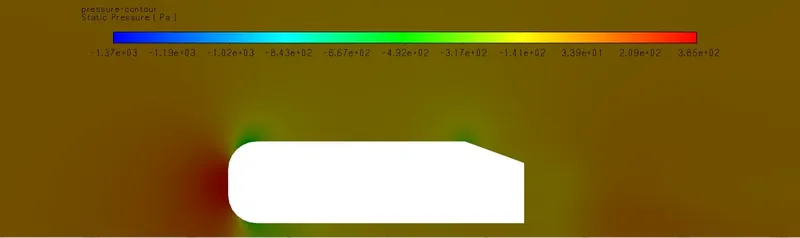
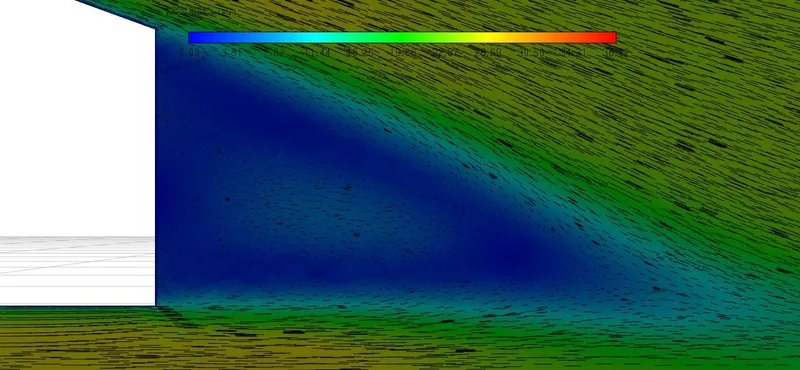
- Explain the reason for the negative pressure in the wake region.
- Explain the significance of the point of separation.
Expected Results:
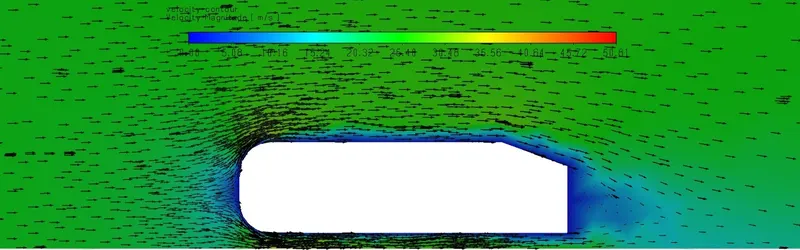
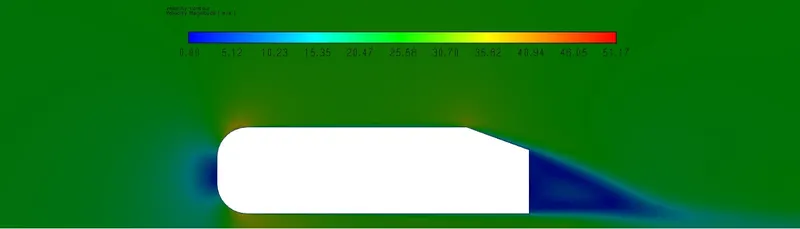
- Velocity and pressure contours.
- The drag coefficient plot for a refined case.
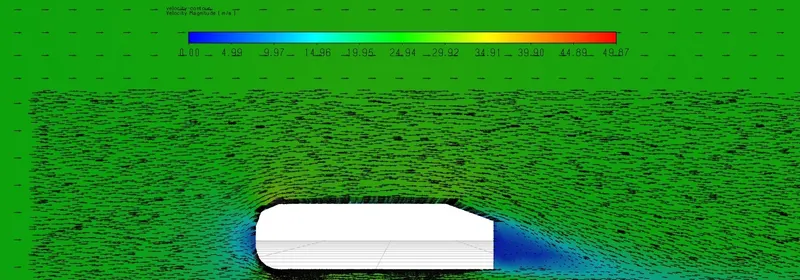
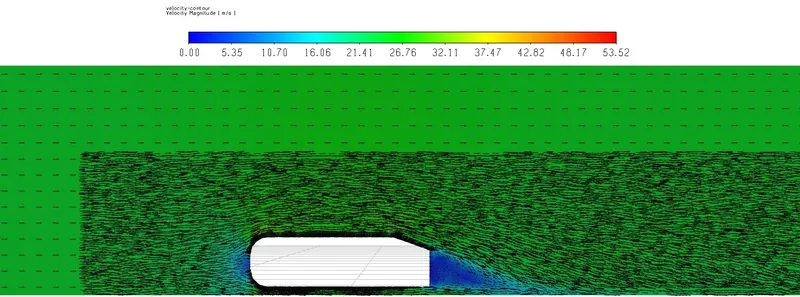
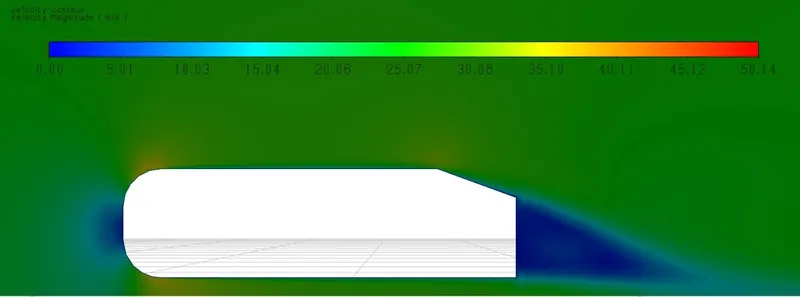
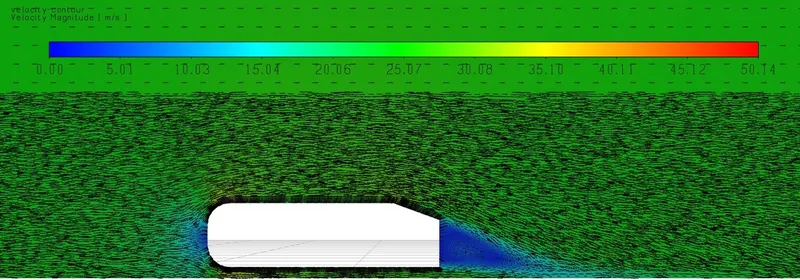
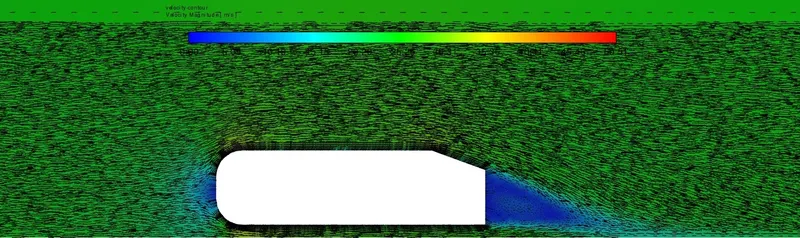
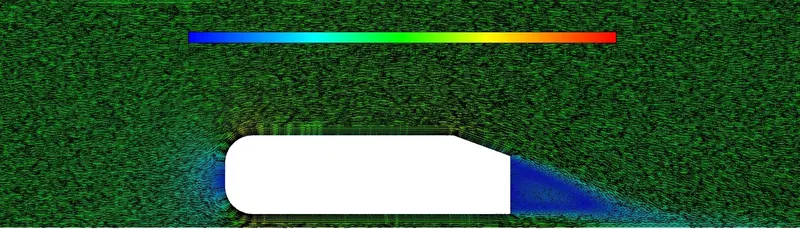
- The vector plot clearly showing the wake region.
Introduction
- The Ahmed structure is a generic automobile framework (a simple vehicle model). Ahmed's experimental work established and characterised the airflow around the Ahmed body, which captures the main flow properties surrounding a car. Despite its simplistic structure, the Ahmed body allows us to capture characteristics that are significant to bodies such as flow impingement and displacement at the nose, somewhat uniform flow in the centre, and flow separation and wake creation at the back.The Ahmed Body is used for drag force and lift force evaluations, as well as rolling, pitching, and yawing moments, in addition to velocity field analyses. The slant angle on the back enables for the investigation of the separation zone and its impact on the velocity profile and forces.
- Since the Reynolds number for this scenario is more than 2000, the flow we are utilising is turbulent, and the turbulent model we are using is k-epsilon. For high Reynolds number, steady, equilibrium flows without a significant unfavourable pressure gradient, the K-epsilon model is utilised since it is not necessary to explicitly represent the influence of the innermost part of the turbulent layer.
Negative pressure at Wake region and Point of Separation
- The vehicle's rear has a slant, which causes flow separation and counter-rotating vortices to form at the slant edges. When the slant angle is 30 degrees, the drag forces on the Ahmed Body are at their highest. Higher slant angles cause the flow to completely detach over the slant due to the significant unfavourable pressure differential between the slant and the ceiling.
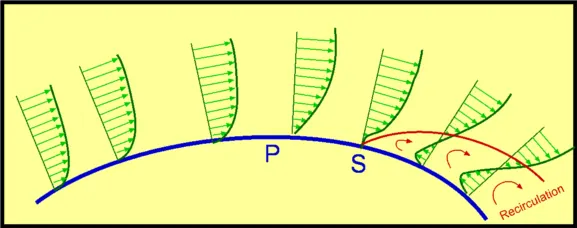
- Negative pressure at Wake region: When an item travels through a fluid, the fluid adheres to the body's surface and creates a boundary layer on top of it. Now, there is a point on a body for specific types of motion and bodies where the fluid separates from its surface, shattering the boundary layer; this point is known as the flow of separation. When the velocity gradient decreases or turns negative, the boundary layer is maintained until it is larger than zero. The separation process moves forward.
- Point of Separation: Because of the higher starting y+ value, lower total mesh count, and quicker run times, the coefficient of drag and lift is increased as the y+ value grows, and it is also decreased when the mesh is finer. It is advisable to resolve the boundary layer with a finer mesh all the way to the wall since flow separation is expected and the precise prediction of the separation point will have an influence on the results, such as the drag or lift forces the elliptical experiences.The inaccuracy is much decreased since the residuals keep lowering as we refine the mesh using the Y+ value. As Y+ increases, the flow separation and appearance of vortices become more pronounced. By suitably refining the mesh, the wake region is capture.
Y+ term
- In layman's terms, it refers to the height of the first grid element adjacent to a wall in a CFD simulation.
- A non-dimensional distance is y+. It is frequently used to specify the coarseness or fineness of a mesh for a specific flow pattern. The correct cell size near domain barriers must be determined in turbulence modelling. The y+ value at the wall is constrained by the wall rules of the turbulence model.
- The flow behaviour near the wall is a difficult phenomena, and the concept of wall has been developed to separate the various zones near the wall. Thus, y+ is a dimensionless quantity that measures distance from the wall in terms of viscous lengths.
- The initial cell height may be computed using the idea of y+ and the y+ value. In order to capture the impacts and prevent an excessively high mesh count overall, the near-wall region is meshed using the computed initial cell height value with progressive expansion in the mesh.
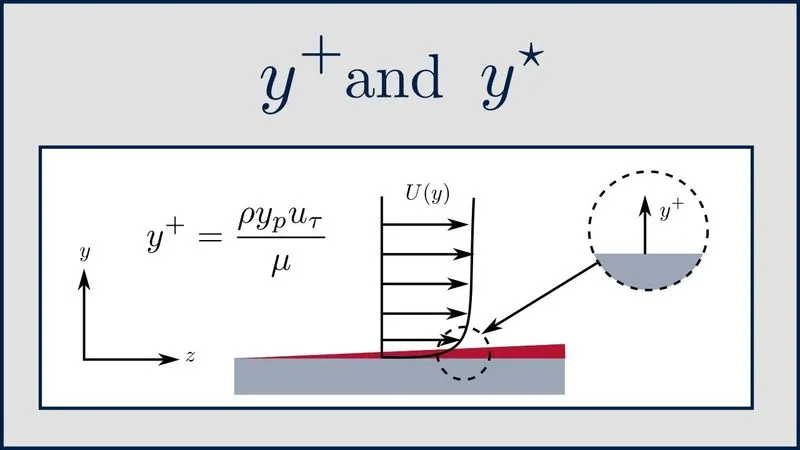
- When the Y+ value is larger than 30 and less than 200, the solver automatically applies the log-law empirical equation. If the Y+ value is less than 5, the solver utilises the viscous sublayer equation.
- In the present simulation all the cases has been studied with the constant y+ value of 3.5 mm.
Steps for the Simulation:
- Create the geomentry or load the geomentry
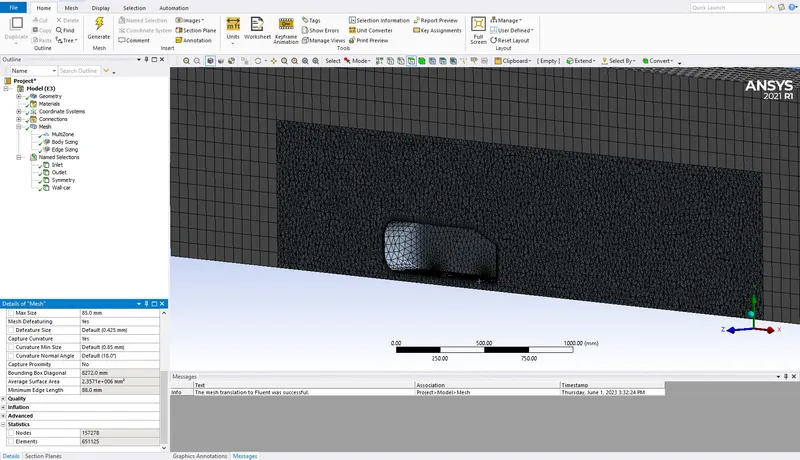
- Discretize the geomentry with adaptable mesh element size
- Apply the material and boundary conditions
- Solve the problem
- Interrupt the results
Problem Setup
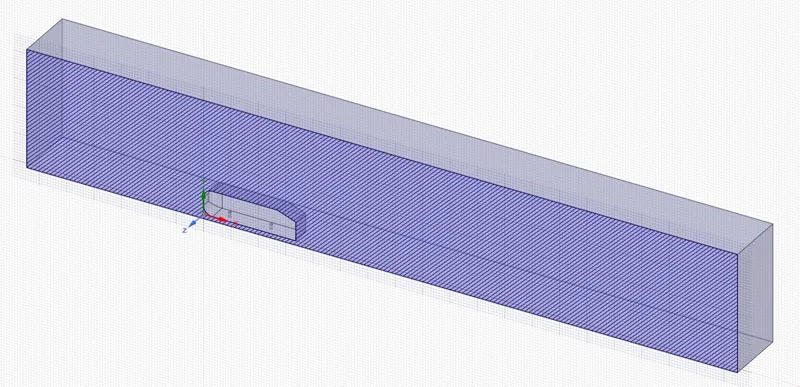
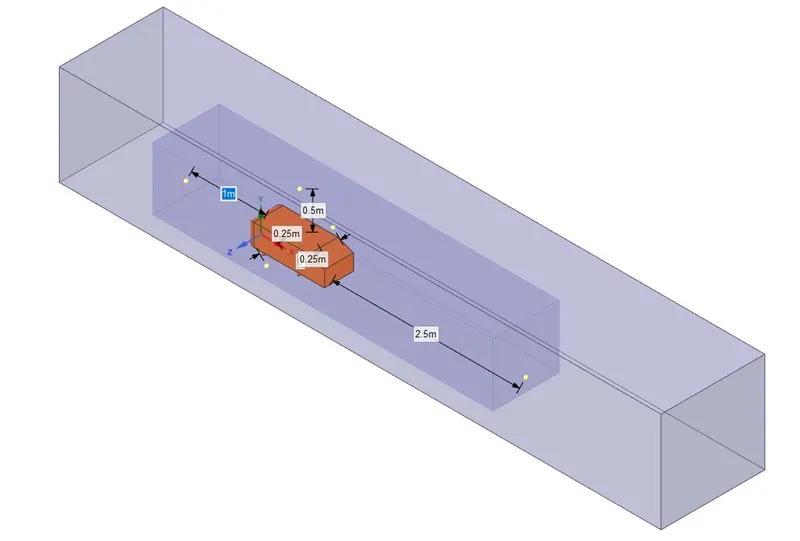
Geometry of Ahmed body
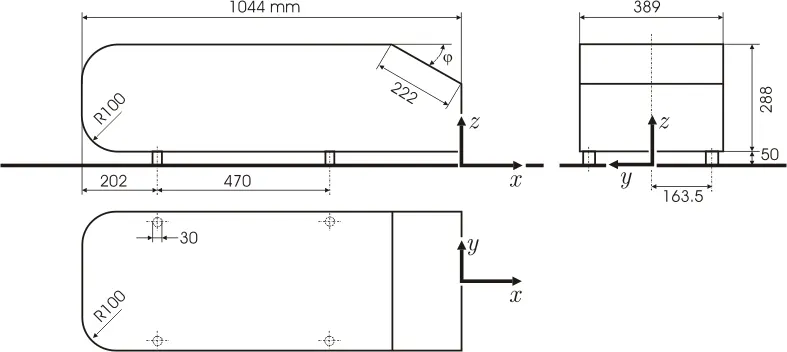
Geometry of Ahmed body for baseline meshing
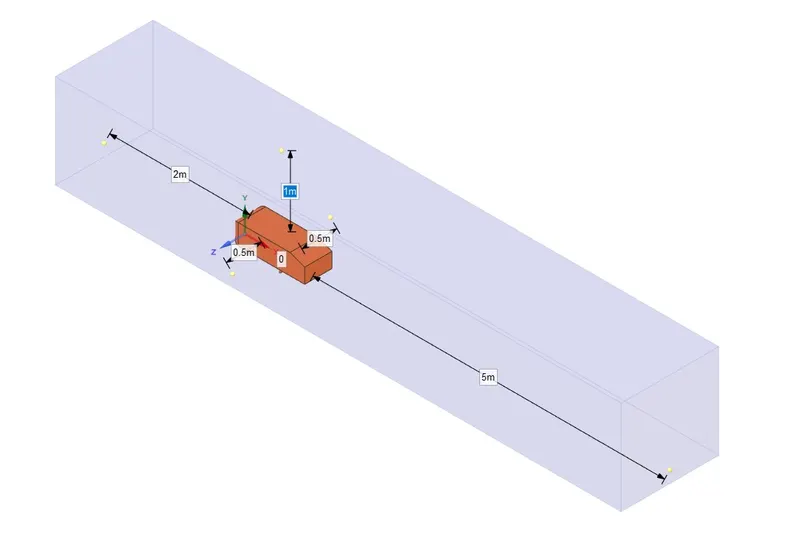
Geometry of Ahmed body for fine meshing
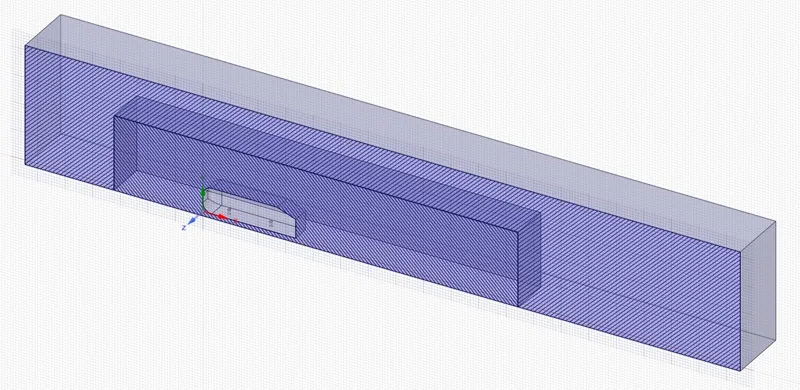
Solution Setup
Fluent Solver
- Solver type - Density Based
- Viscous - k-epsilon
- Fluid - Air
- Inlet velocity - 25m/s
- Method of solve - SIMPLE
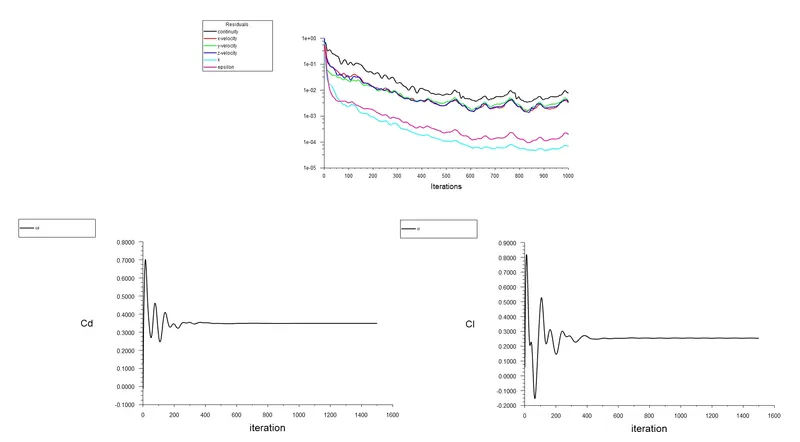
- Create reports/plots for drag coefficient and lift coefficient over the ahmed body wall.
- Initialization - Hybrid
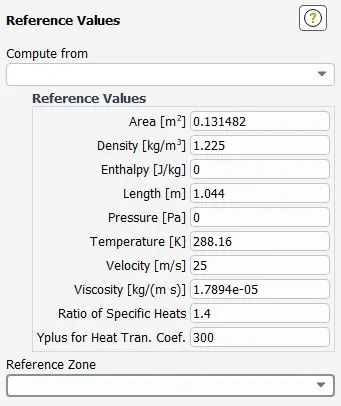
Results
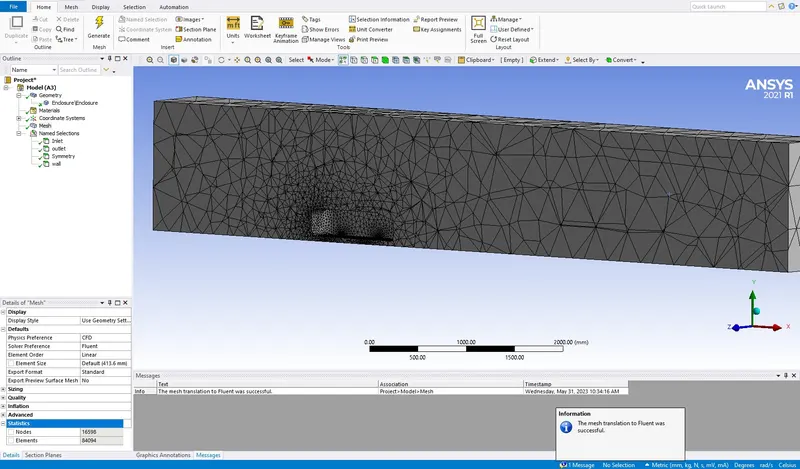
(i)Baseline Mesh: No of mesh elemants - 84094
Mesh
Plots
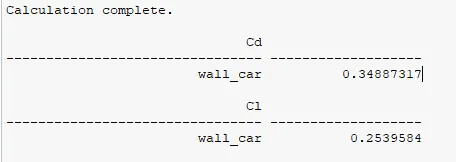
Coefficient values
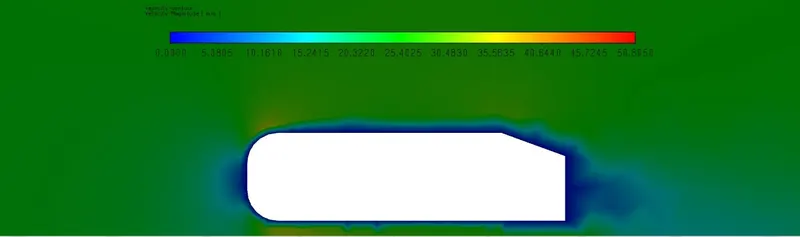
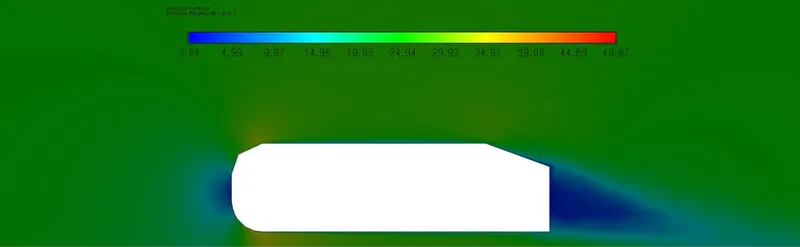
Velocity Contour
Velocity-Vector Contour
Pressure Contour
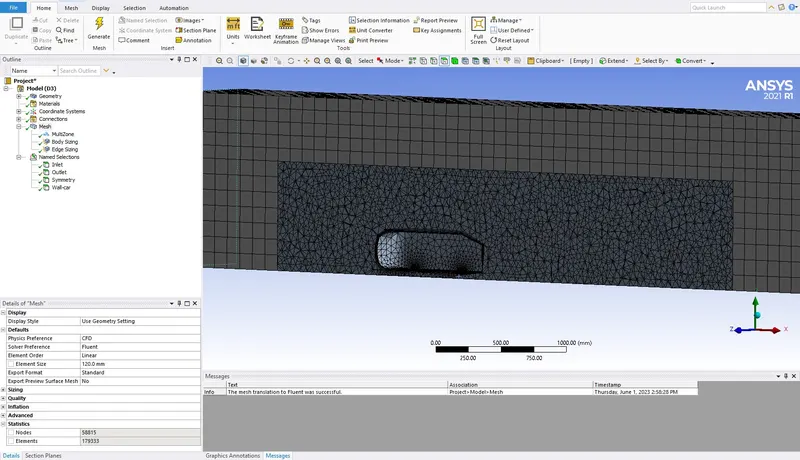
(ii) No of mesh elements: 179333
Mesh
Plots
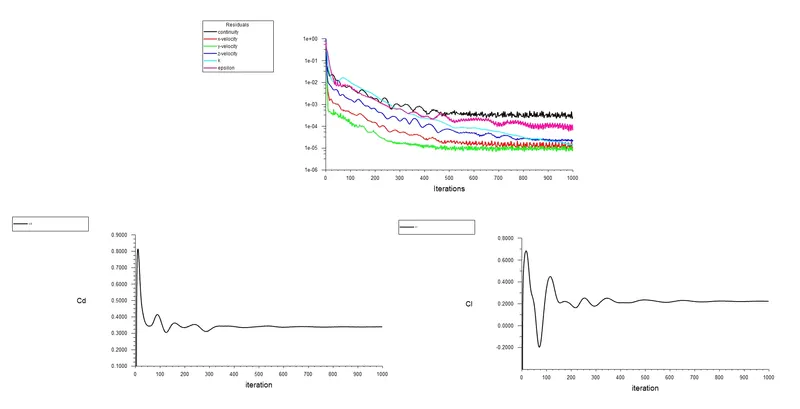
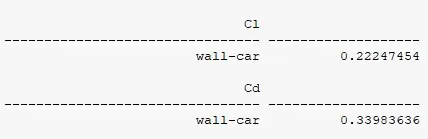
Coefficient values
Velocity Contour
Velocity-Vector Contour
Pressure Contour
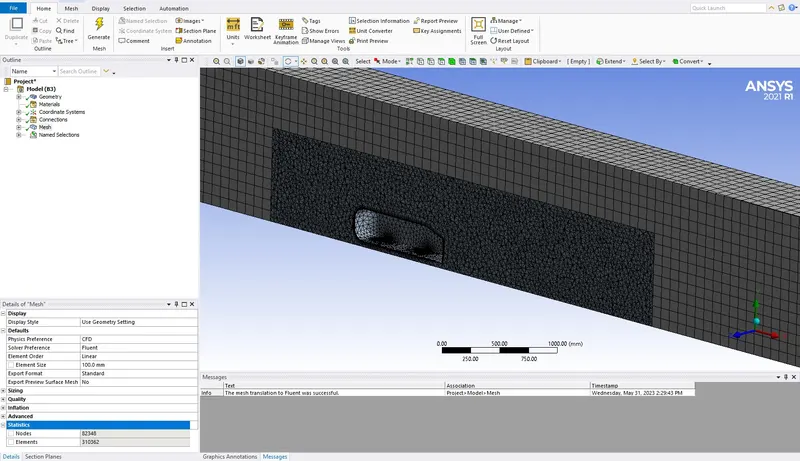
(iii) No of mesh elements: 310362
Mesh
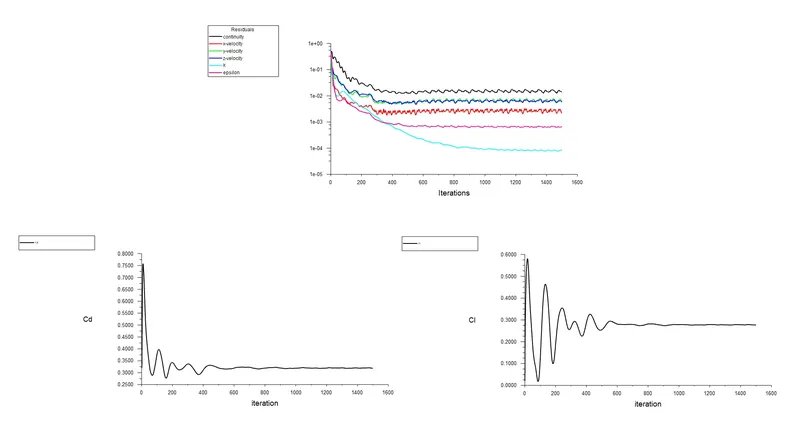
Plots
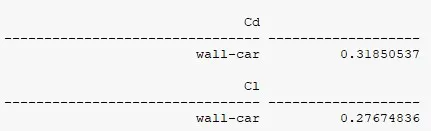
Coefficient values
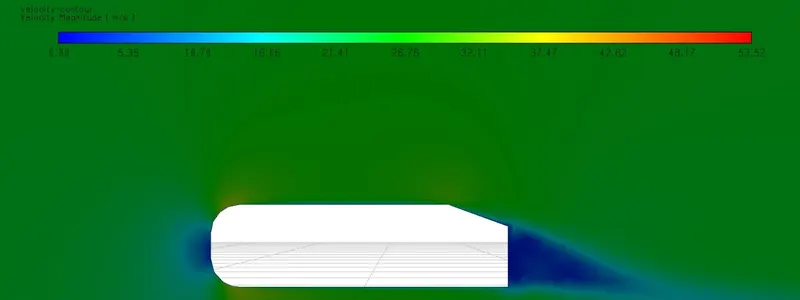
Velocity Contour
Velocity-Vector Contour
Pressure Contour
(iv) No of mesh elements: 651125
Mesh
Plots
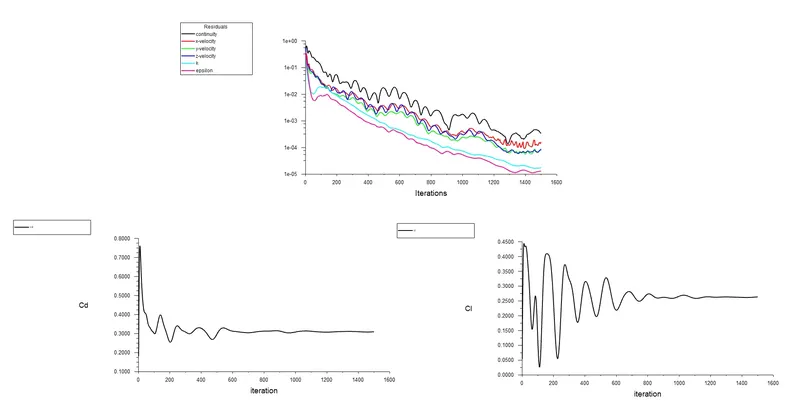
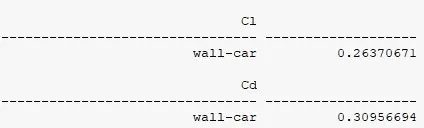
Coefficient values
Velocity Contour
Velocity-Vector Contour
Pressure Contour
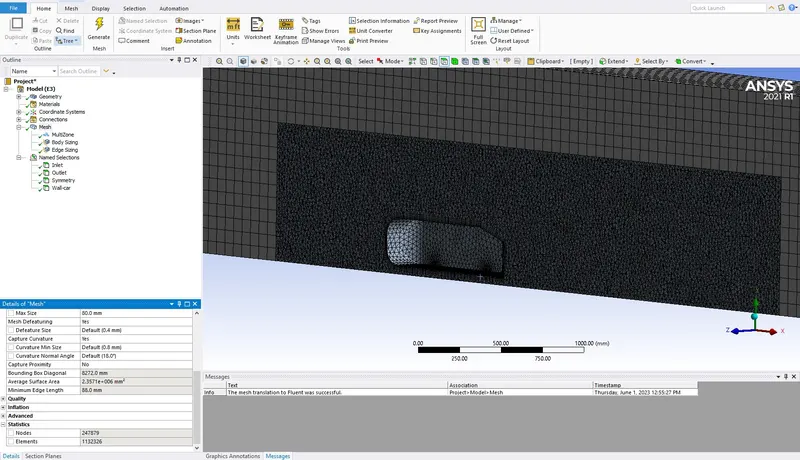
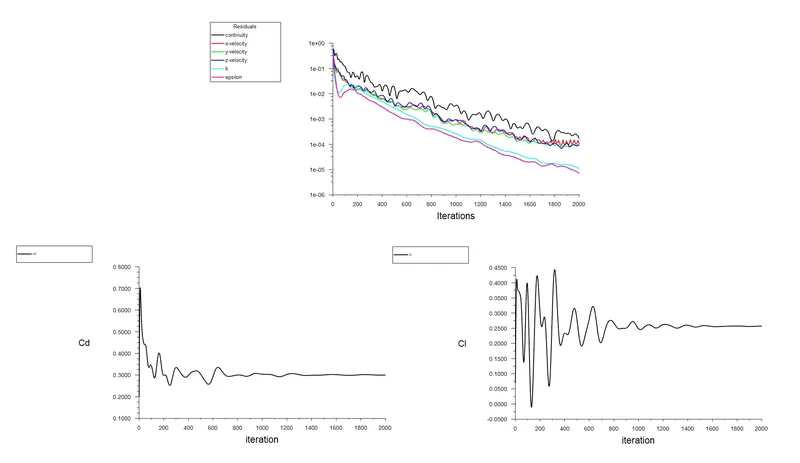
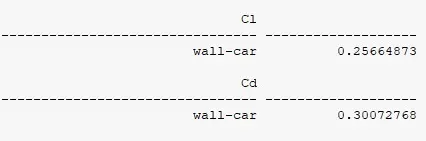
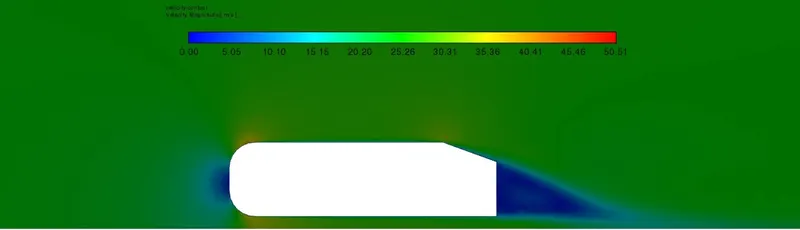
(v) No of mesh elements: 1132326
Mesh
Plots
Coefficient values
Velocity Contour
Velocity-Vector Contour
Pressure Contour
(vi) No of mesh elements:
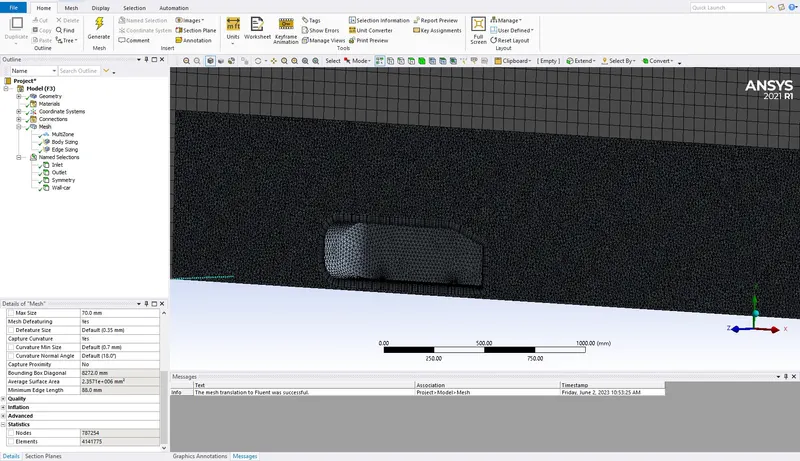
Mesh
Plots
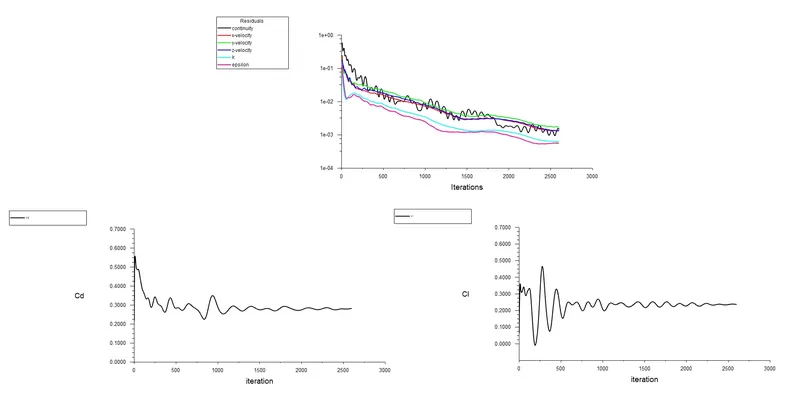
Coefficient values
Velocity Contour
Velocity-Vector Contour
Pressure Contour
Grid Dependence Test
| Sl.No | No of Mesh Elements | Lift Coefficient | Drag Coefficient |
| 1 | 84094 | 0.2539584 | 0.34887317 |
| 2 | 179333 | 0.22247454 | 0.33983636 |
| 3 | 310362 | 0.27674836 | 0.31850537 |
| 4 | 651125 | 0.26370671 | 0.30656694 |
| 5 | 1132326 | 0.25664873 | 0.30072768 |
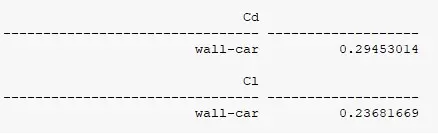
| 6 | 4141775 | 0.23681669 | 0.29453014 |
- Drag coeffcient decreases as number of elements increase, this claim is substantiated by the work of Jie Tian et al [1].
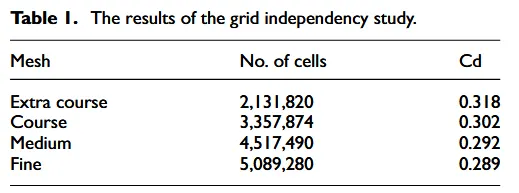
- The key finding is that the drag coefficient does not change appreciably as mesh fineness increases. When the mesh is made more coarse, the drag coefficient does change. Thus, the grid dependency test was successful.
Conclusion
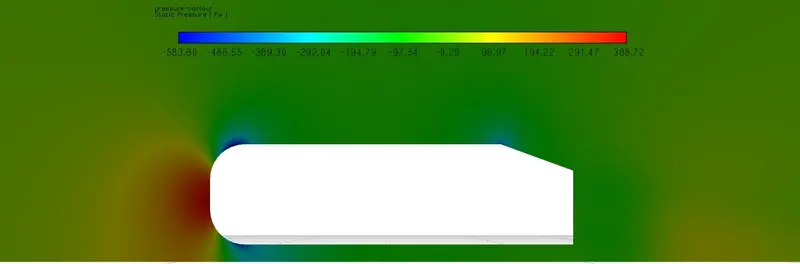
We can plainly draw the conclusion that the velocity in the wake region is higher than the velocity in the tail region, and the velocity vectors are likewise much higher in the wake region. This is due to the fact that an Ahmed body provides greater impediment in the wake than in the tail. The Ahmed body's tail section has greater circulating flow, which causes low velocity.Although there is a lot of pressure at the front, there is adverse pressure, also known as negative pressure, in the wake zone.
Reference
1. 1. Tian J, Zhang Y, Zhu H, Xiao H. Aerodynamic drag reduction and flow control of Ahmed body with flaps. Advances in Mechanical Engineering. July 2017.