Week 3 - External flow simulation over an Ahmed body.
Ahmed's Body And Its Importance
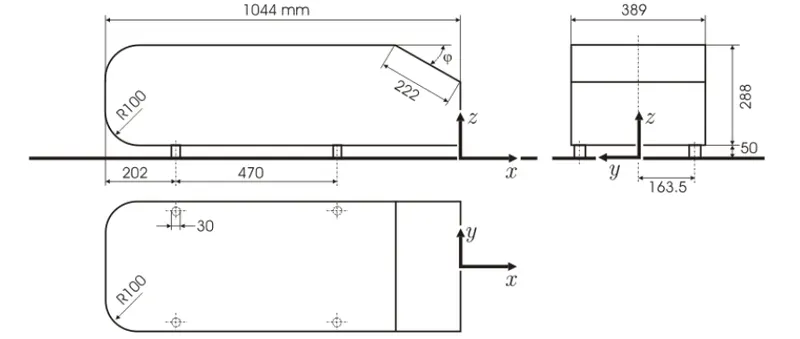
Ahmed's body, also known as the Ahmed body or the Ahmed reference shape, is a simplified geometric model of a car body used in automotive aerodynamics research and testing. It was introduced by Professor S. R. Ahmed in the 1980s as a way to represent a generic sedan-shaped vehicle for studying the flow characteristics and aerodynamic performance.
The Ahmed body consists of a streamlined front section, a sloping roof, and a rear end with a truncated tail. It typically has a three-box shape resembling a sedan or notchback car. The body model is characterized by specific geometric parameters, such as the slant angle of the rear window, the length and height of the rear end, and the height of the trailing edge.
The importance of Ahmed's body lies in its simplicity and reproducibility, which allows for consistent and standardized comparisons of aerodynamic performance between different vehicle designs and configurations. It serves as a benchmark for evaluating the aerodynamic drag, lift, and flow characteristics of automotive vehicles, particularly in the early stages of vehicle design.
By studying the flow around the Ahmed body, researchers can investigate and optimize various aerodynamic aspects, such as reducing drag, improving fuel efficiency, enhancing stability, and minimizing undesirable aerodynamic effects like lift, turbulence, and flow separation. The Ahmed body has become widely used in wind tunnel testing, computational fluid dynamics (CFD) simulations, and other experimental and numerical studies related to vehicle aerodynamics.
The results obtained from Ahmed body studies provide valuable insights into the flow behavior and aerodynamic performance of vehicles, enabling engineers and designers to make informed decisions in developing more efficient and aerodynamically optimized car designs. It has played a significant role in advancing automotive aerodynamics research and facilitating improvements in vehicle performance, fuel efficiency, and overall vehicle design.
Diagram
Reason For The Negative Pressure In The Wake Region
The negative pressure in the wake region is a consequence of the complex flow dynamics, including the formation of vortices and the deceleration of the flow. It is important to note that the negative pressure does not imply an absolute or true negative pressure (below atmospheric pressure) but rather a pressure lower than the surrounding regions. This negative pressure contributes to the forces experienced by objects in the wake, such as drag forces or lift forces, and can have implications for the overall aerodynamic performance and flow characteristics.
Significance Of The Point Of Separation
The point of separation in fluid flow refers to the location where the boundary layer, which is the thin layer of fluid adjacent to a solid surface, detaches or separates from the surface. The significance of the point of separation lies in its influence on aerodynamic forces, wake formation, and the overall flow behavior. Understanding and controlling the point of separation is crucial for optimizing the performance, efficiency, and stability of various systems in fields such as automotive, aerospace, wind energy, and fluid dynamics.
Project Report
The given model is opened in ANSYS SpaceClaim.
Since the model is symmetric, only the half portion is taken for the simulation. This will helo to reduce the simulation time and effort.
The computational domin is created using the enclosure option.
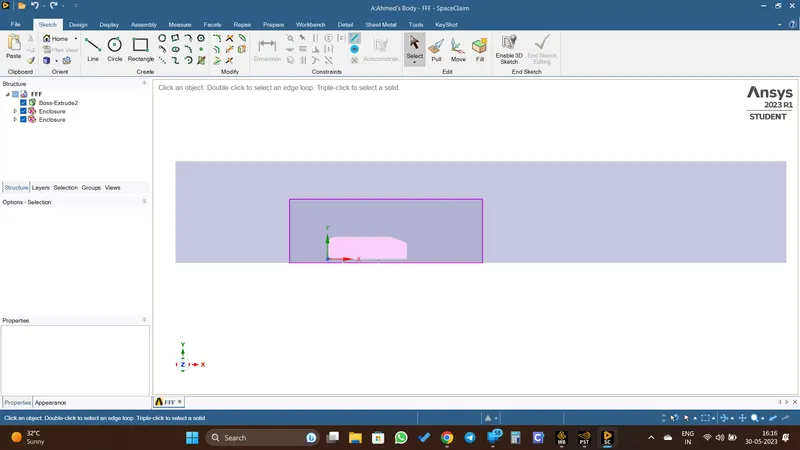
Then the model is opened in Meshing window and meshed
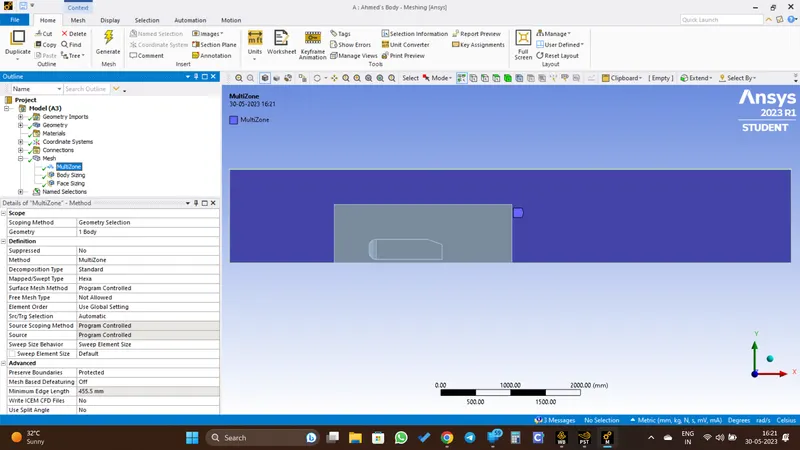
Outer Enclosure
The outer enclosure is meshed with the hexahedral mesh type. It have the highest mesh quality
Inner Enclosure
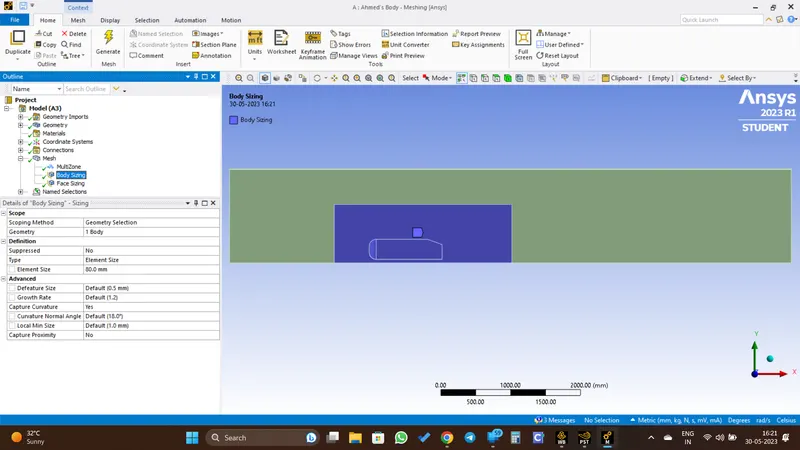
The inner enclosure is meshed with a mesh element size of 80 mm
Ahmed Body
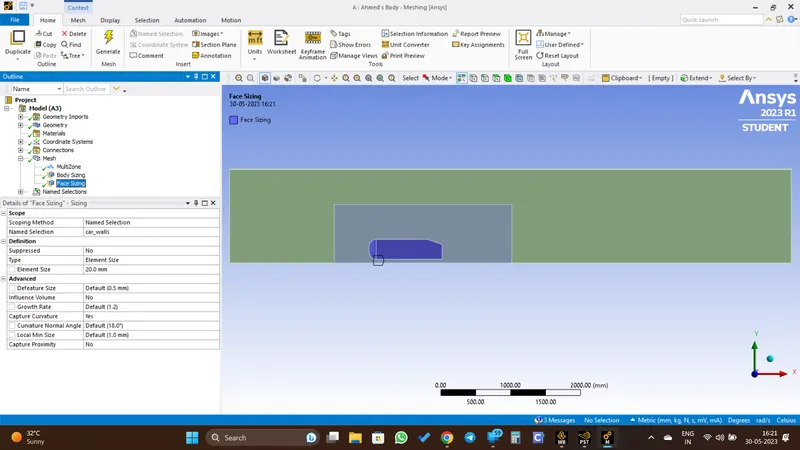
The given body is meshed with a mesh of element size of 20 mm.
Inflation Layer
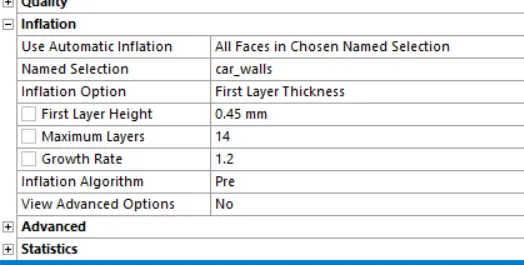
Inflation layer is created to capture the flow properties on the boundary region.
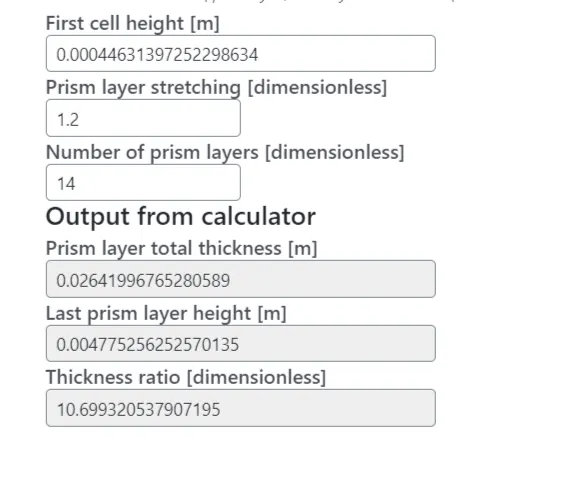
The parameters for the inflation layer are calculated using Y+ calculator (volupe).
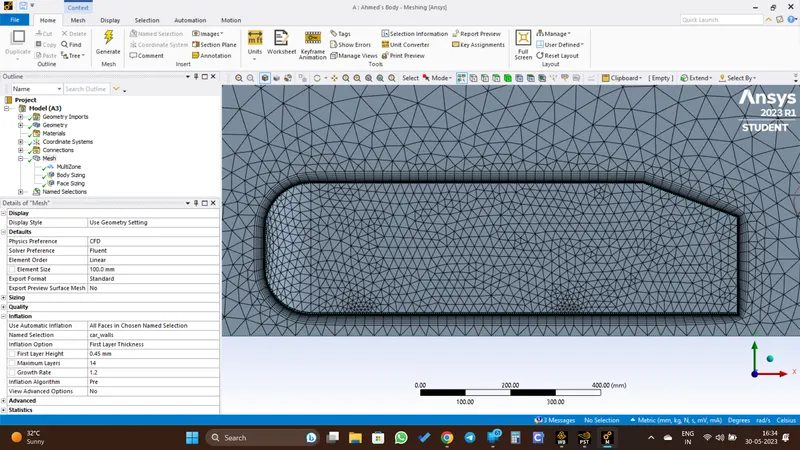
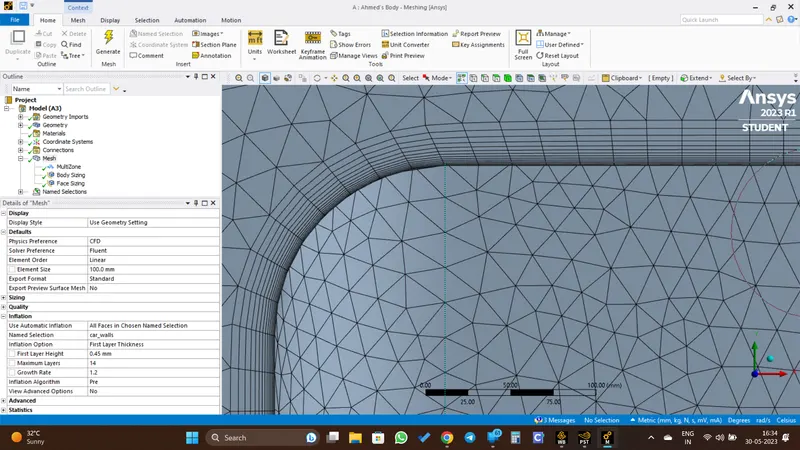
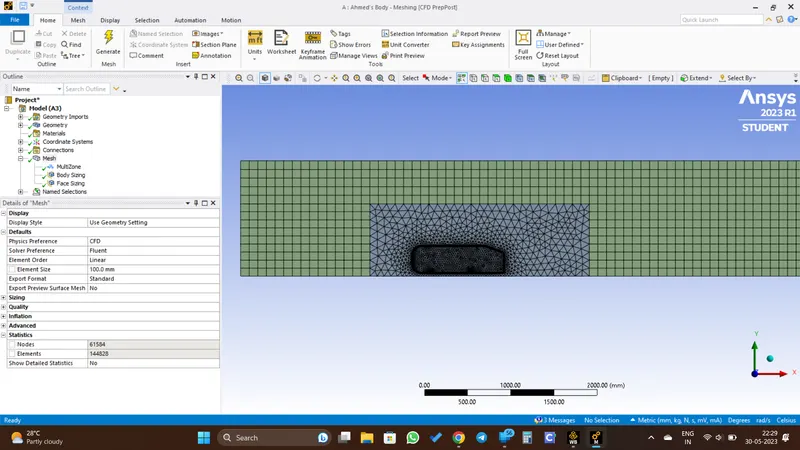
This is the final meshed model.
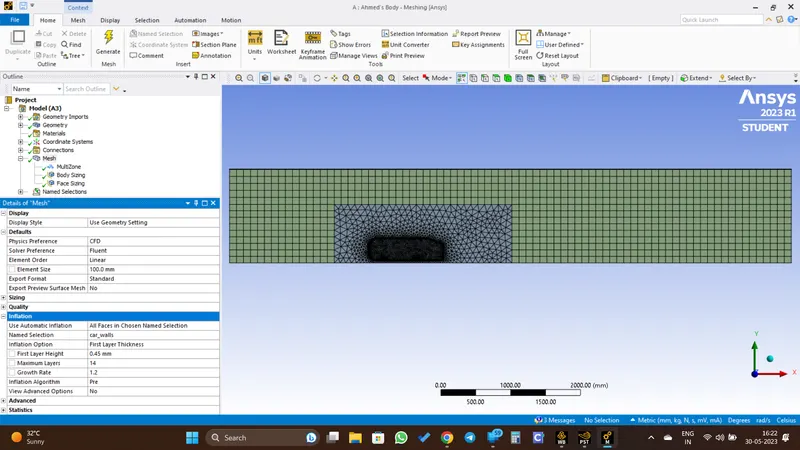
Total no: of nodes: 61584
Total no: of mesh elements: 144828
Then the model is opened in ANSYS FLUENT.
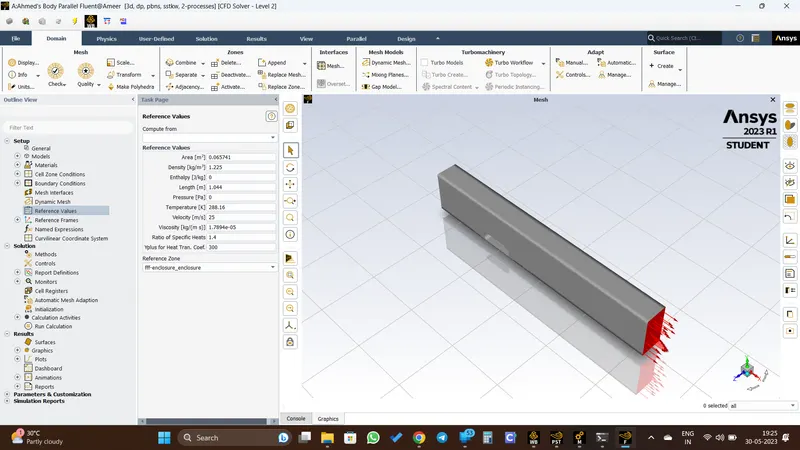
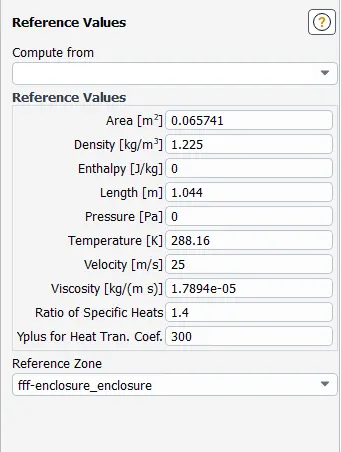
The reference values are given.
k-omega SST viscous model is selected because it is more suitable for the simulation of turbulent flow like flow in the wake regions.
The inlet velocity is set as 25 m/s.
Default air properties in fluent are taken.
Plot for drag coefficient and lift is created under definitions.
Then initilize and run to obtain th result.
Results
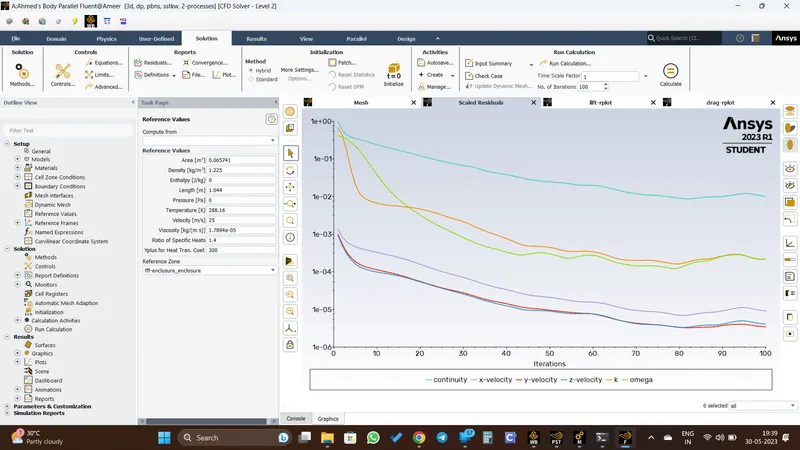
Residual Plot
Lift Coefficient
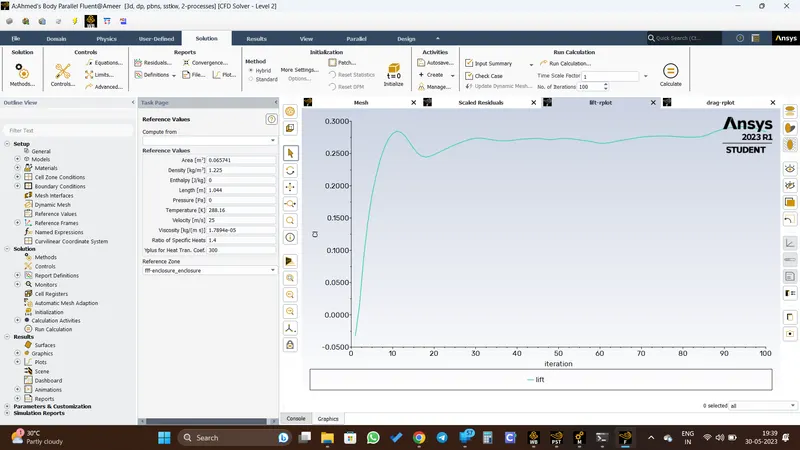
The value of lift coefficient, Cl = 0.282
Drag Coefficient
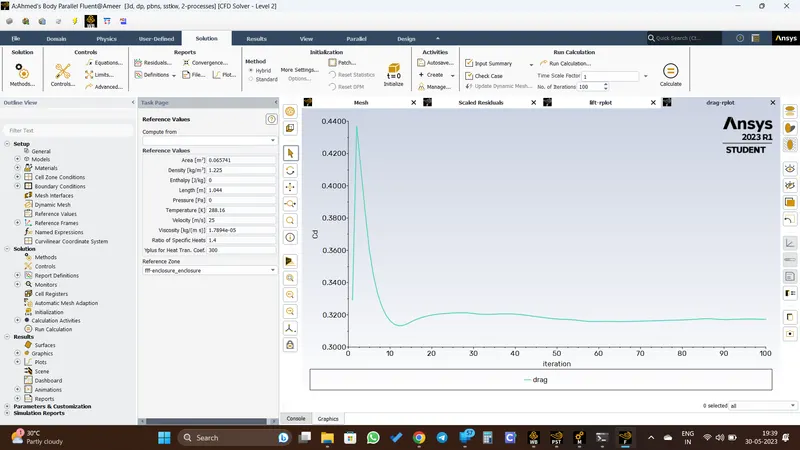
The value of drag coefficient, Cd = 0.317
Velocity And Pressure Contours
Velocity Contour
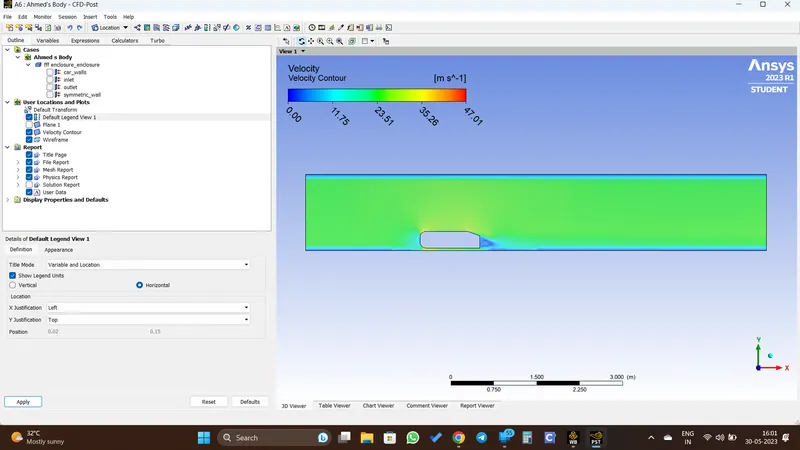
In the wake region, the velocity is lower compared to the upstream or freestream region. This phenomenon is primarily due to the formation of a recirculation zone behind the object that disrupts the flow.
Pressure Contour
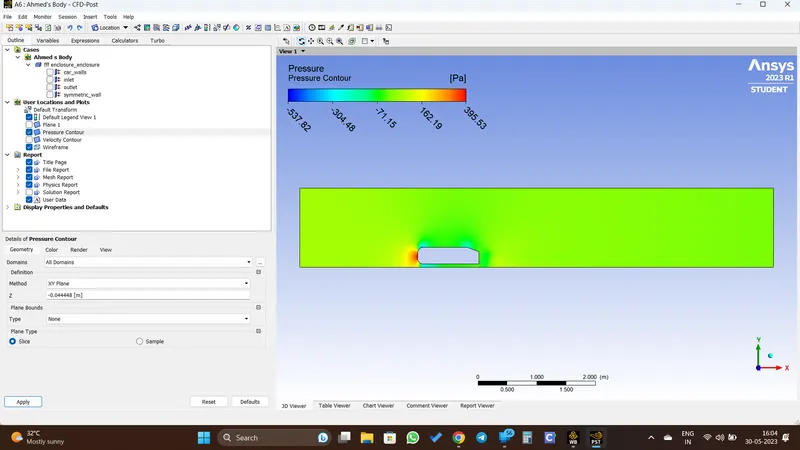
In the front of the body, we can see a region of high pressure compared to the free stream. This phenomenon is primarily caused by the combination of fluid compression and flow deceleration.
And in the wake region, there is a negative pressure. This is due to the Bernoulli principle and the vortices or recirculation zones formed behind an object or obstacle.
Velocity Vector
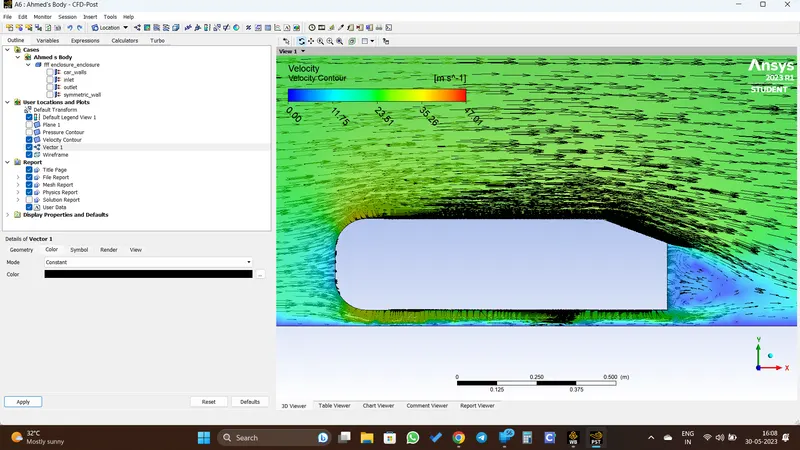
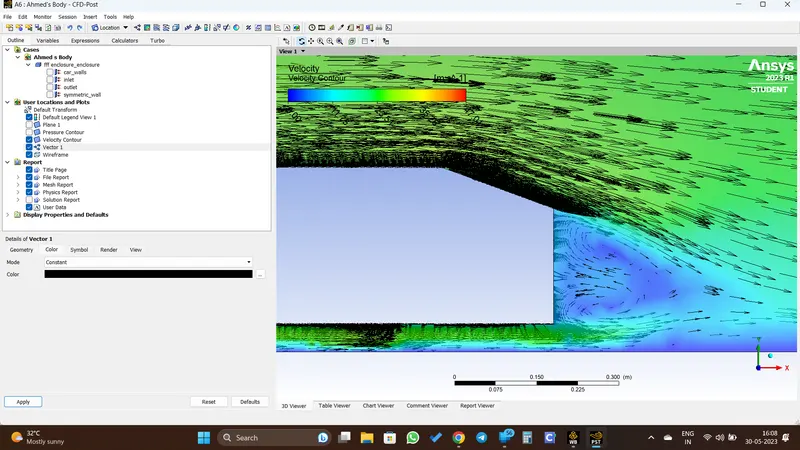
Form this we can clearly see the recirculating region behind the body (wake region), due to the complex flow dynamics and the interaction between the fluid and the object.
Some factors contribute to the formation of these recirculating vectors:
- Boundary Layer Separation
- Vortex Shedding
- Flow Instabilities
Inference
From the results, we can see discrepancy and that may be due to the mesh refinement.
Grid Independency Test
Grid independence testing, also known as mesh independence study, is a process used in numerical simulations to assess the sensitivity of the results to the grid resolution. The main objective of this testing is to determine the minimum grid resolution required to achieve accurate and reliable results without excessive computational cost.
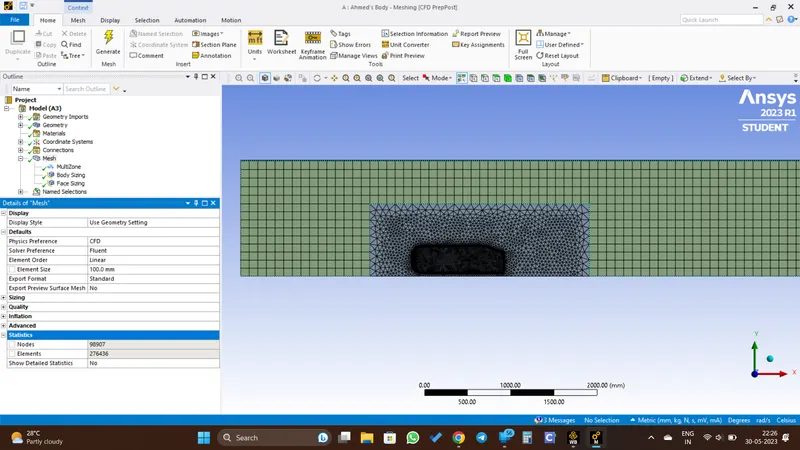
For the grid independence study, the model is mehed with different mesh element size and run.All the other flow parameters are kept same.
Coarse Mesh
Base Mesh
Refined Mesh
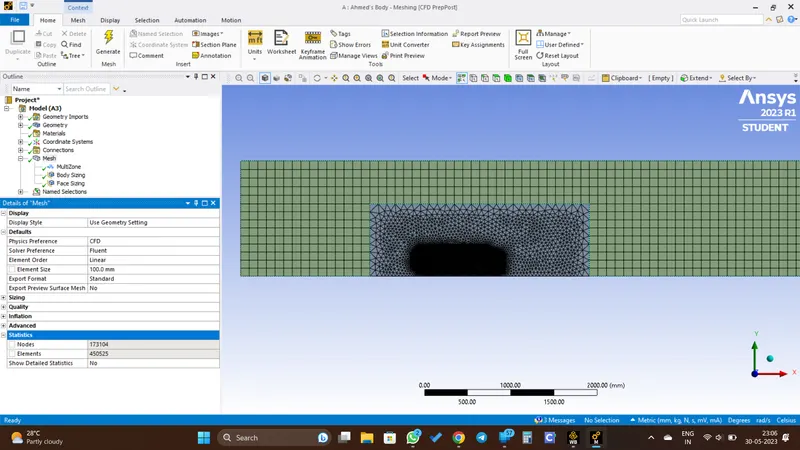
The table below shows the mesh type, number of elements and their corresponding Cd and Cl.
| Mesh Type | No: of elements | Nodes | Cd | Cl |
| Coarse Mesh | 144828 | 61584 | 0.317 | 0.282 |
| Base Mesh | 276436 | 98907 | 0.318 | 0.279 |
| Refined Mesh | 450525 | 173104 | 0.306 | 0.267 |
Inference
As the mesh is refined and the cell size decreases, the Cd/Cl converge to a consistent value. This means that further mesh refinement should have a diminishing effect on the Cd/Cl value, and a converged Cd/Cl is obtained with a sufficiently fine mesh. The convergence indicates that the solution is becoming grid-independent and that the numerical error associated with the discretization is decreasing.
With a coarse mesh, the flow features and boundary layer behavior may not be adequately resolved. This can lead to underestimating or overestimating the drag forces/lift force, resulting in a Cd/Cl value that deviates from the accurate solution. As the mesh is refined, the finer grid captures more details of the flow field and boundary layer, leading to improved accuracy and a more reliable Cd/Cl value.
For project file, Click here