Week 1- Mixing Tee
AIM
To set up steady-state simulations to compare the mixing effectiveness of two Mixing Tees having different lengths.
Also evaluate which one is suitable out of k-epsilon and k-omega for this simulation.
GIVEN DATAS
- Two mixing tees having two differen length is given.
- Hot inlet temperature is 36 0C.
- Cold inlet temperature is 19 0C.
- Hot inlet velocity is 3 m/s
CASE 1
- Short mixing tee
- Momentum ratio of 2, 4.
The cad model is opened in spaceclaim and cleared the exterior volume since we are going to deal with the internal flow analysis
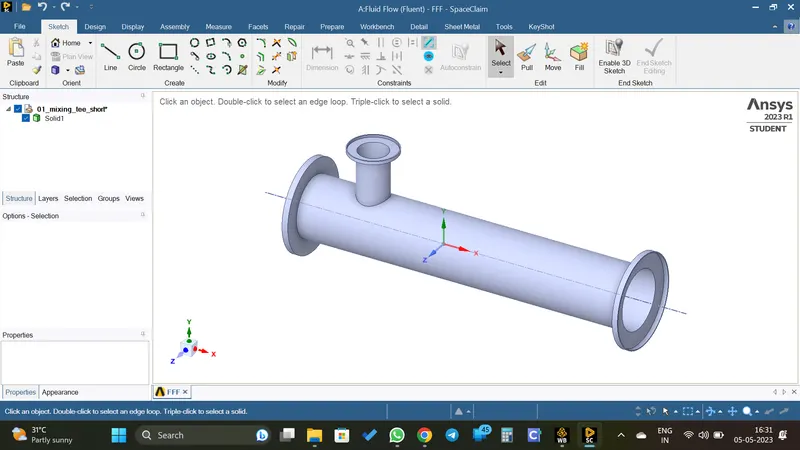
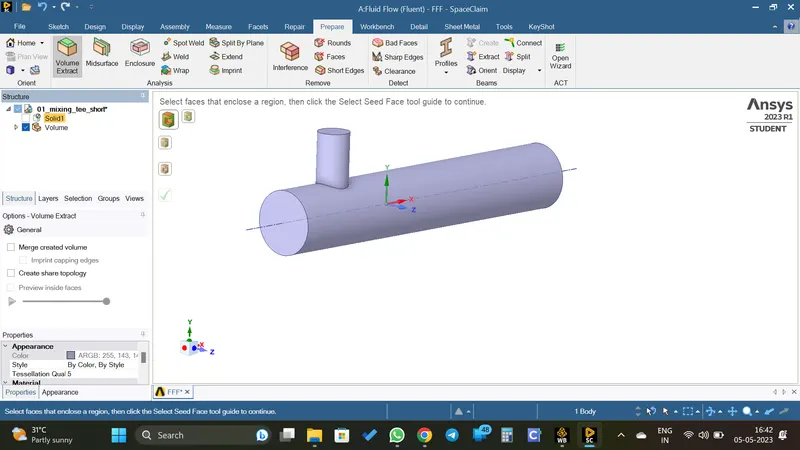
Then the model is opened in the meshing window
Before doing the meshing process, done for the naming of the faces.
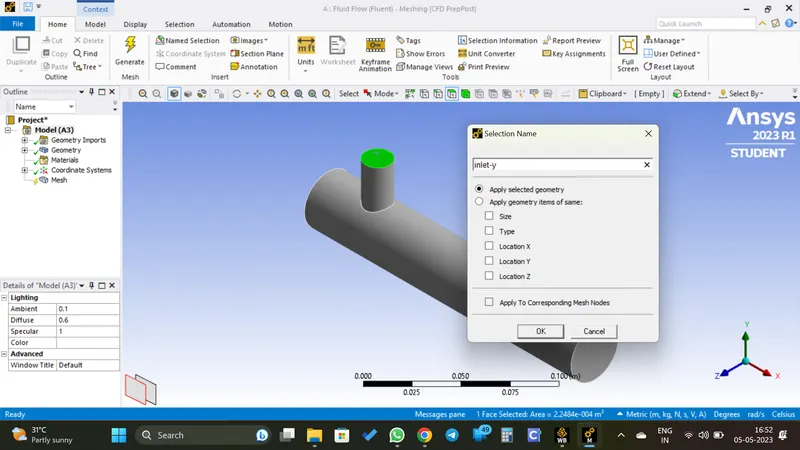
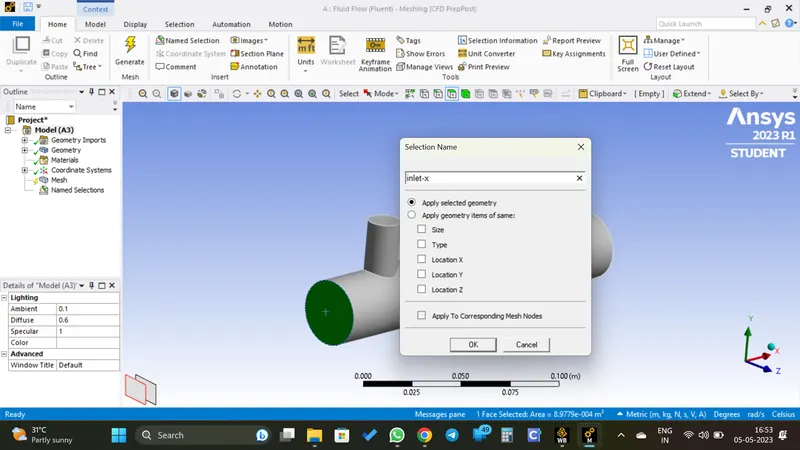
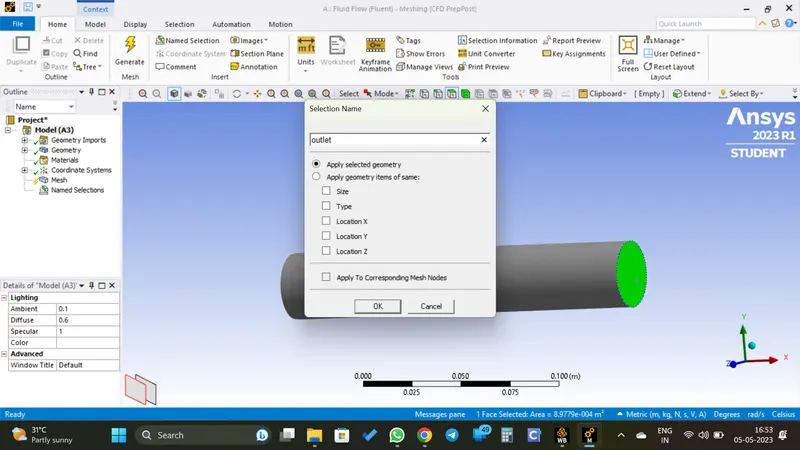
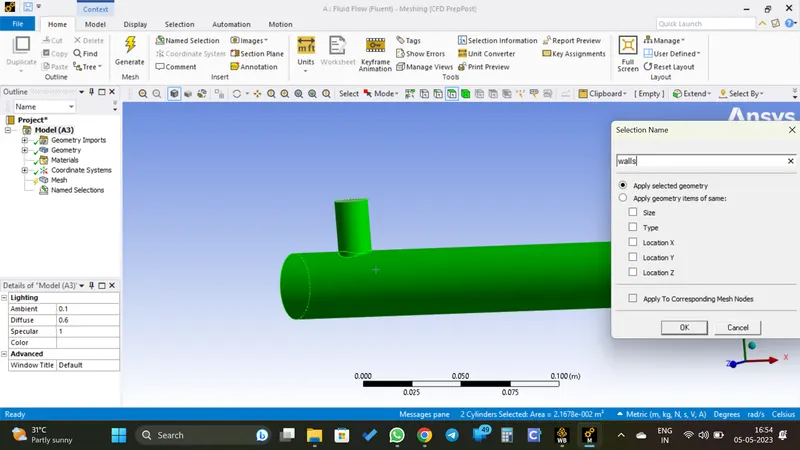
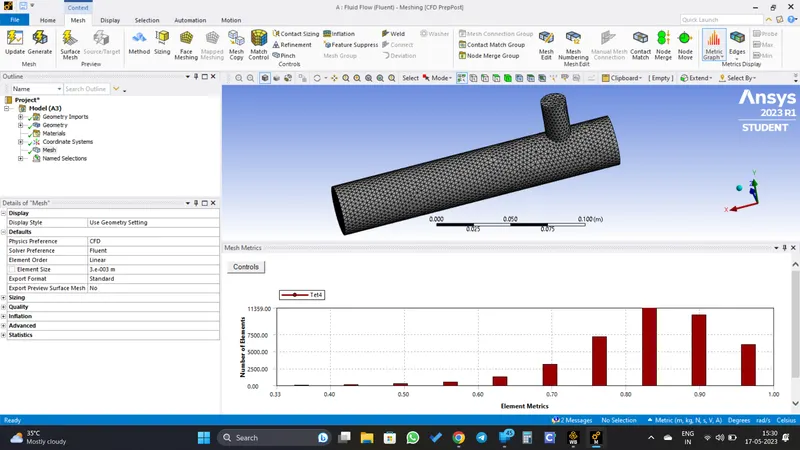
After naming the faces, the mesh is created using the mesh generate option.
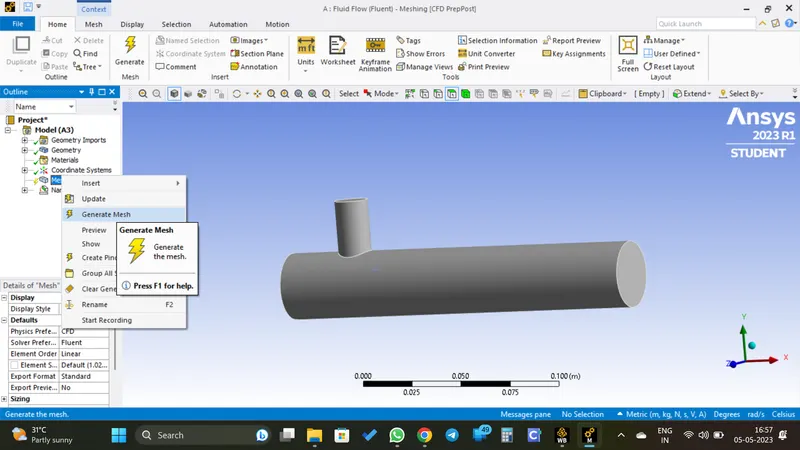
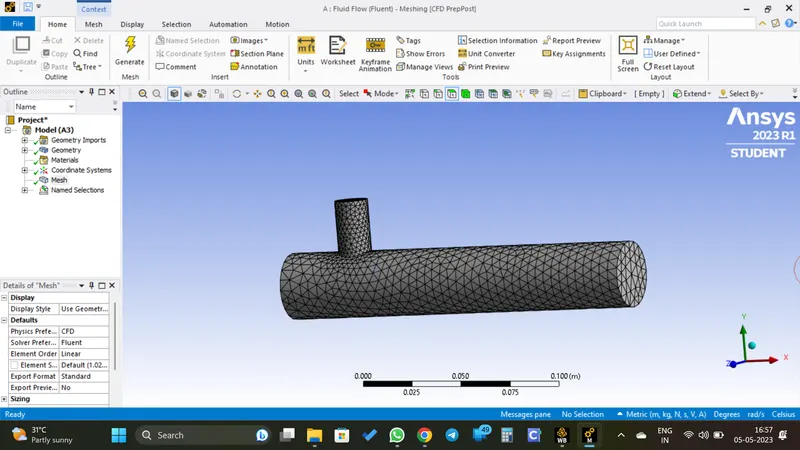
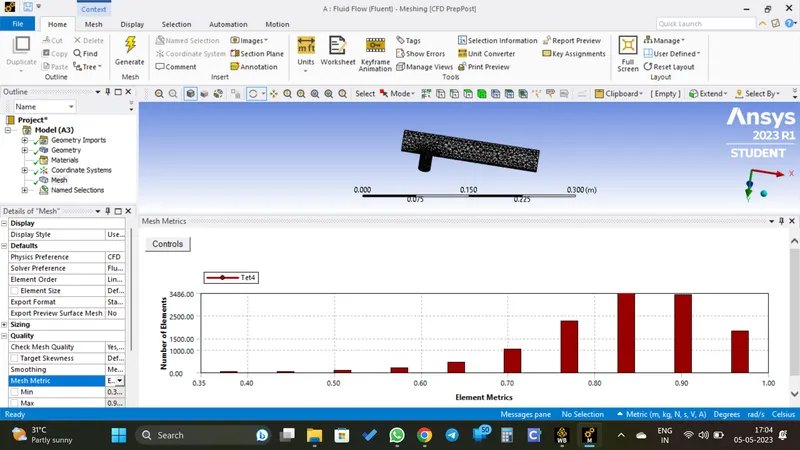
The element quality should not be less than 5%. But here it is above 35%, so we can proceed.
CASE 1.1.1
- Short mixing tee.
- Momentum ratio 2.
- Cold inlet velocity 6 m/s.
- Turbulence Model : k-epsilon
The meshed model is opened in setup window and the physical parameters are given.
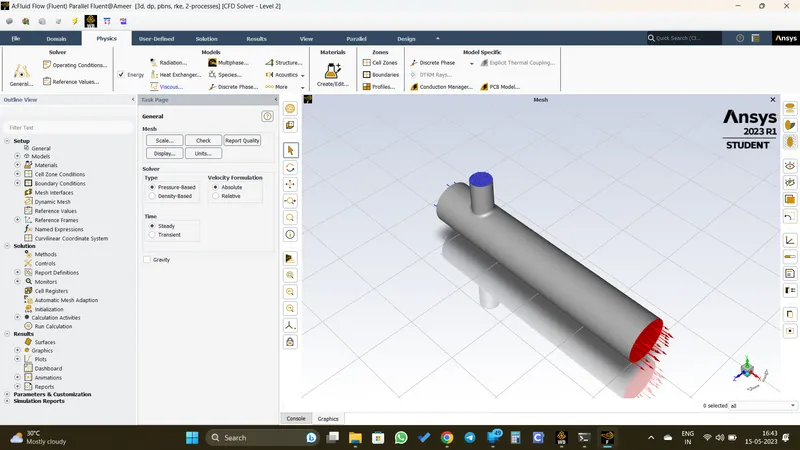
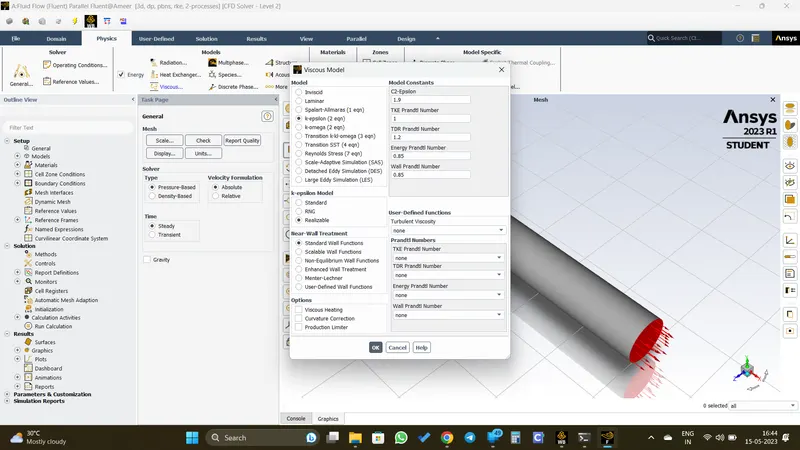
The turbulance model k-epsilon realizable is selected.
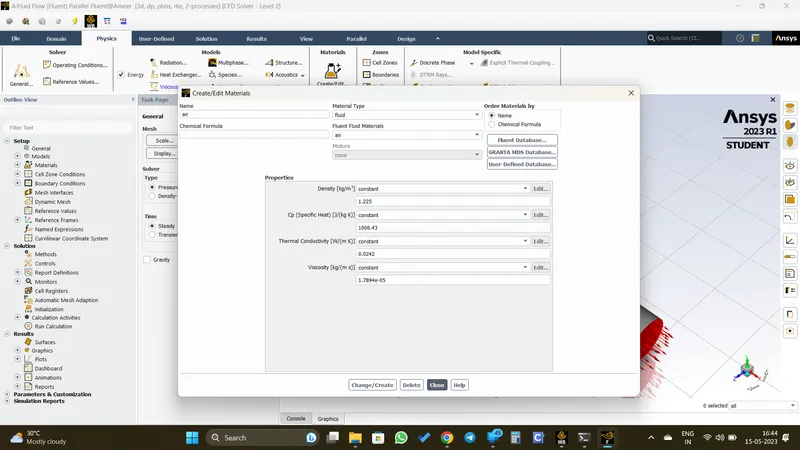
The material properties are defined.
Cell zone is selected.
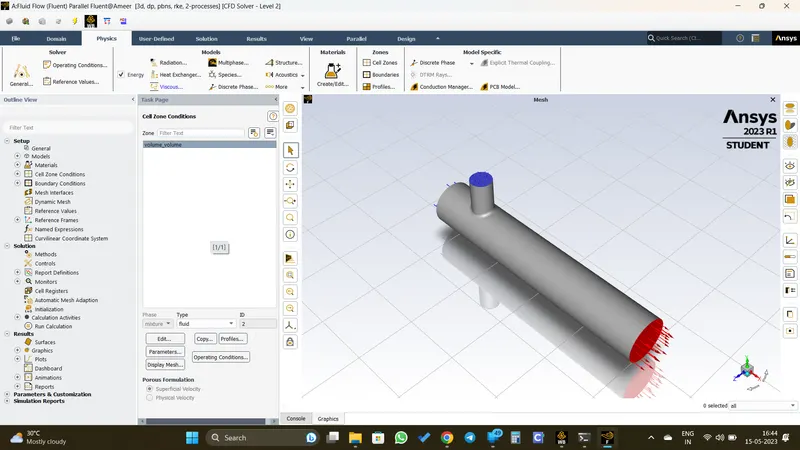
Parameters of the boundaries are defined.
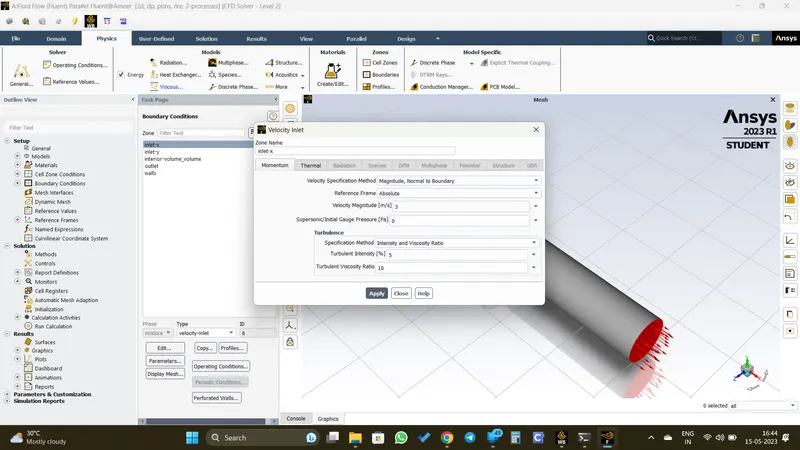
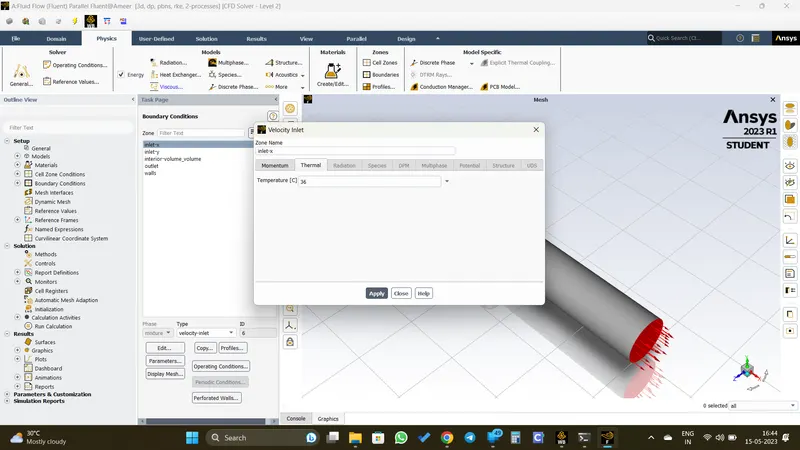
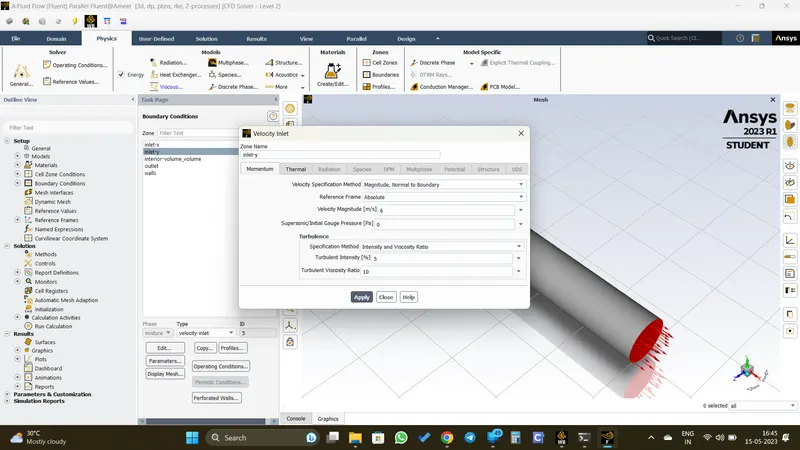
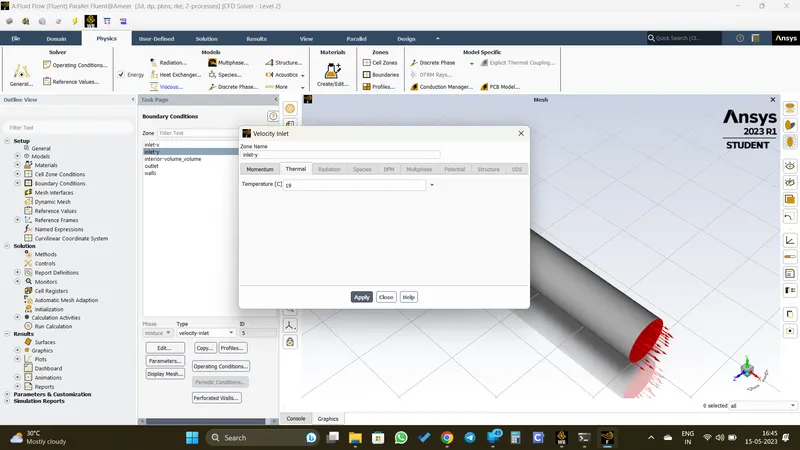
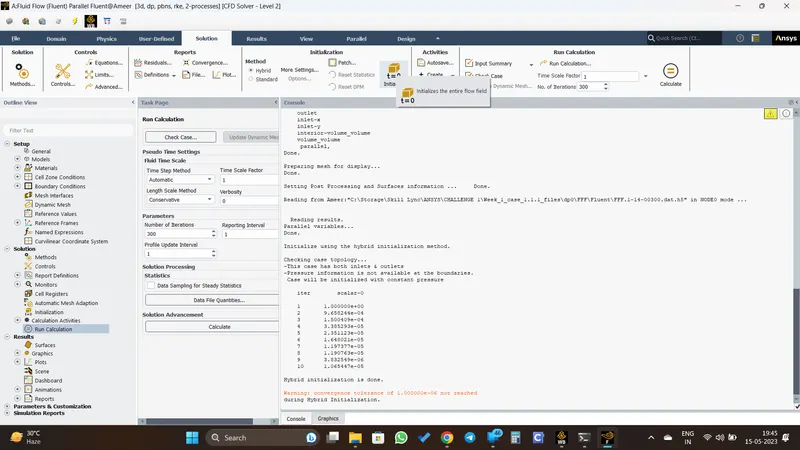
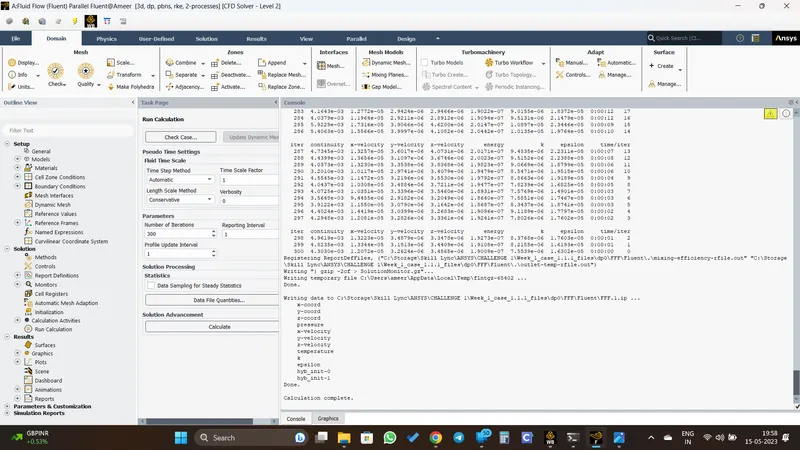
Then the model is opened in the solution window and initilize and then run it.
Results
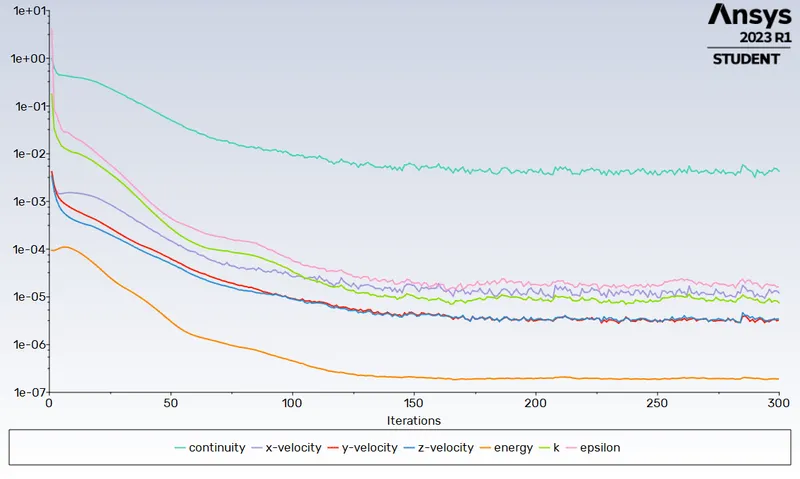
Residual Plot
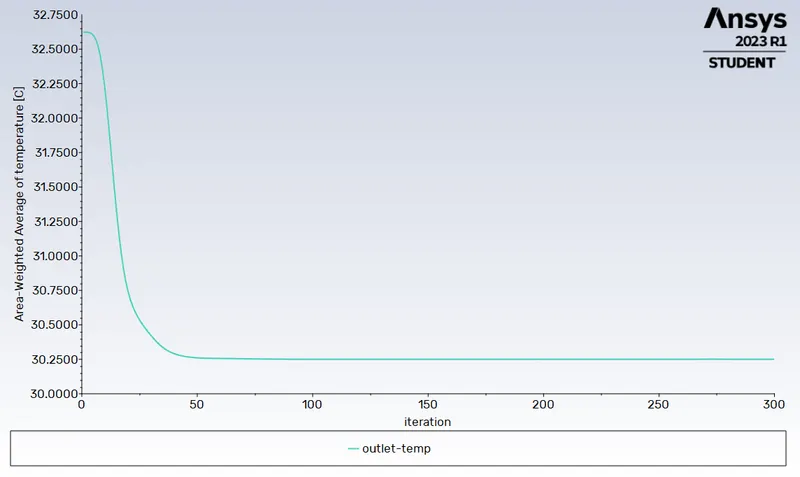
Outlet Temperature
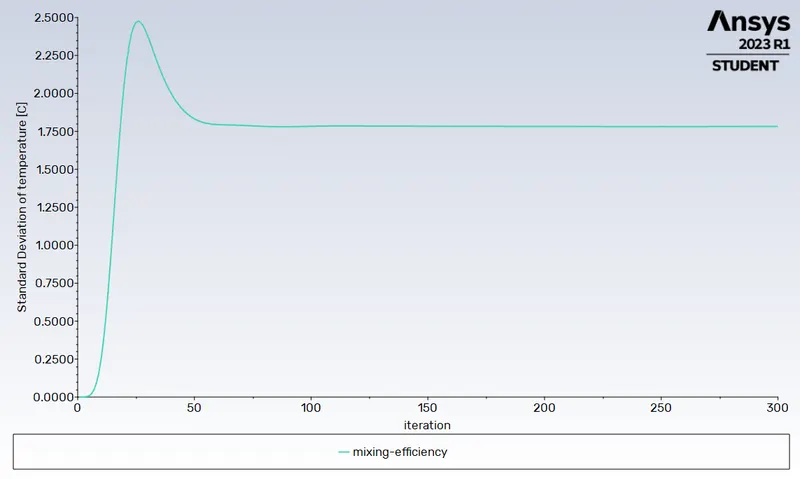
Mixing Efficiency
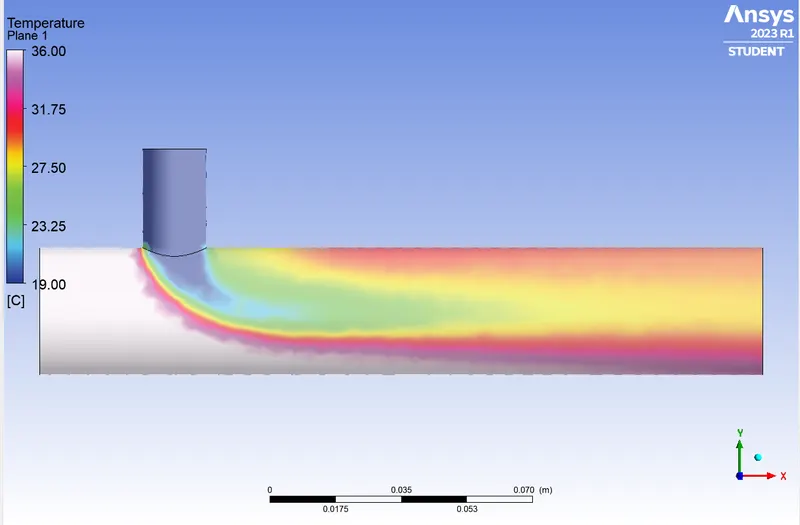
Temperature Contour Along The Pipe
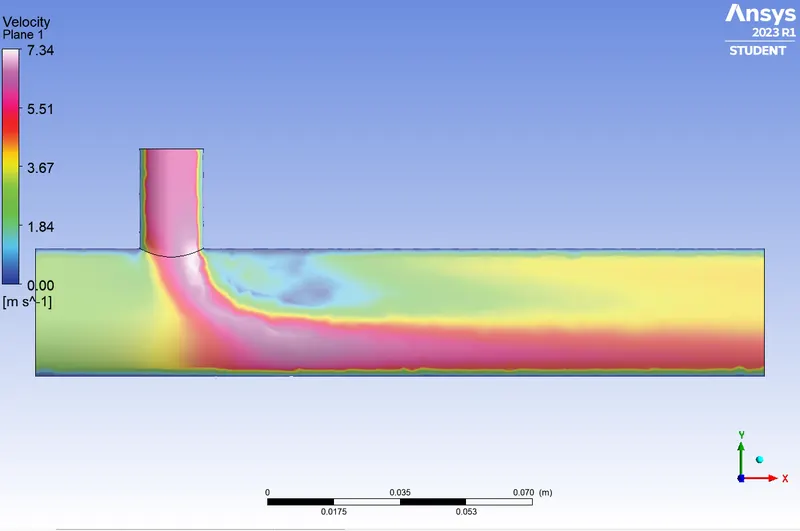
Velocity Contour Along The Pipe
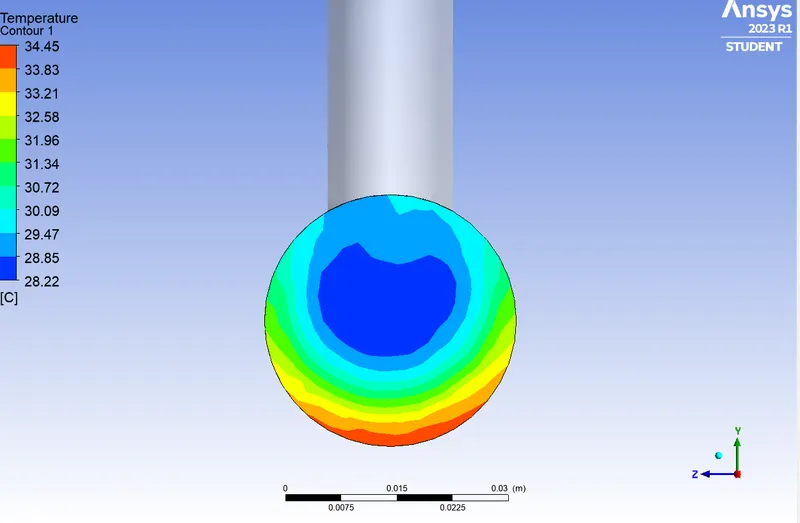
Temperature Contour Across The Pipe
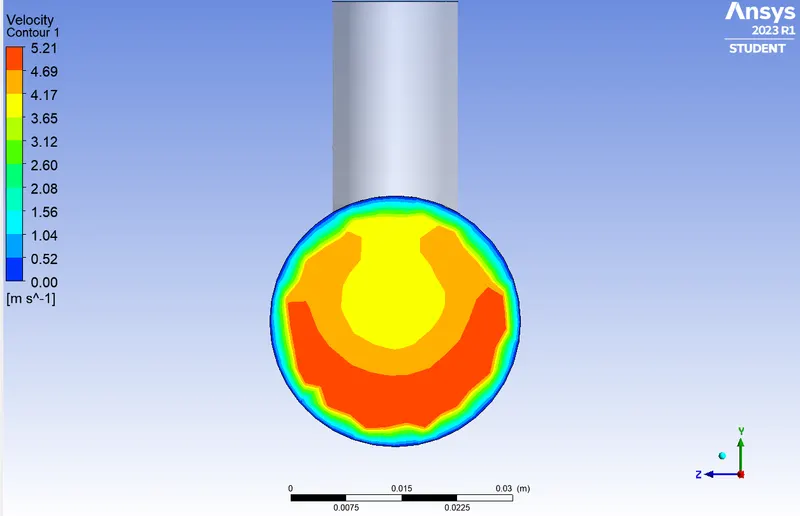
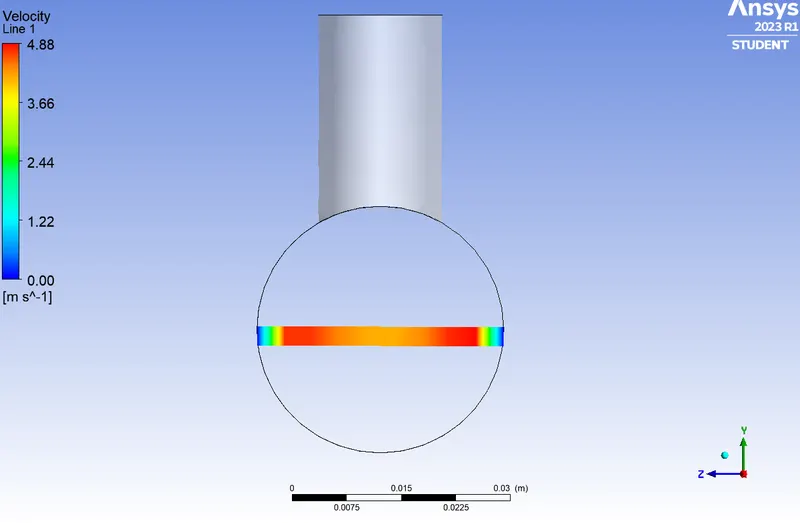
Velocity Contour Across The Pipe
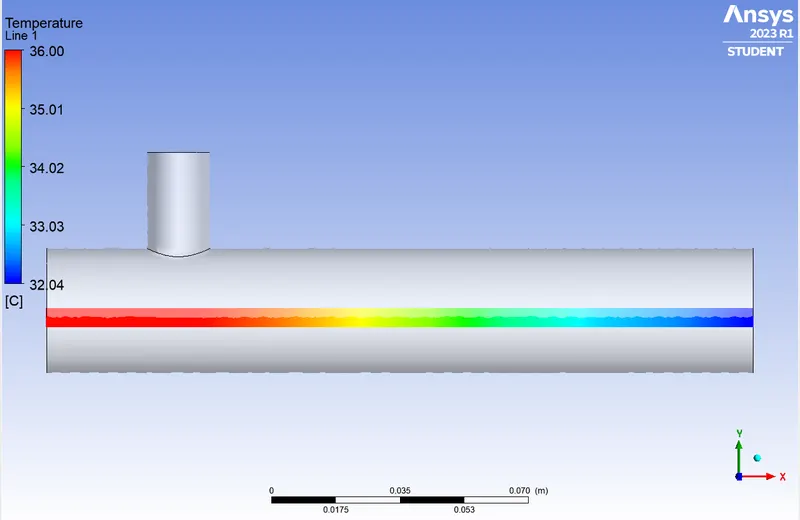
Temperatur Line Plot Along The Pipe
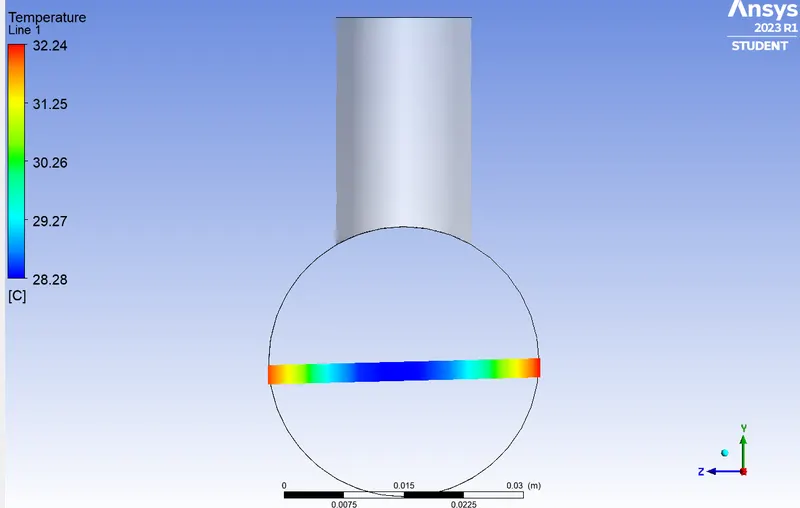
Temperature Line Across The Pipe
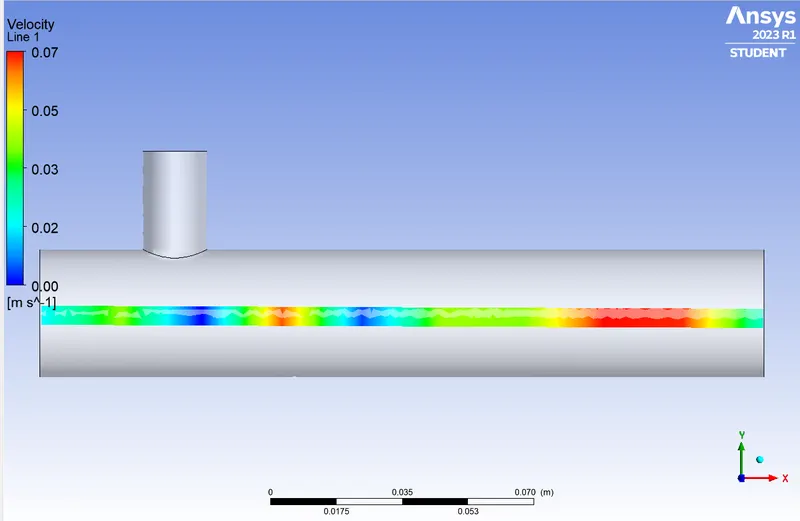
Velocity Line Along The Pipe
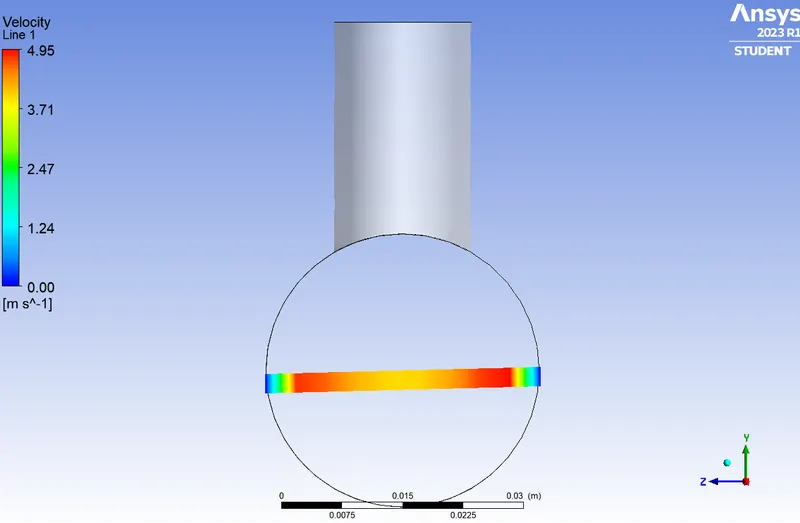
Velocity Line Across The Pipe
CASE 1.1.2
- Short mixing tee.
- Momentum ratio 2.
- Cold inlet velocity 6 m/s.
- Turbulence Model : k-omega
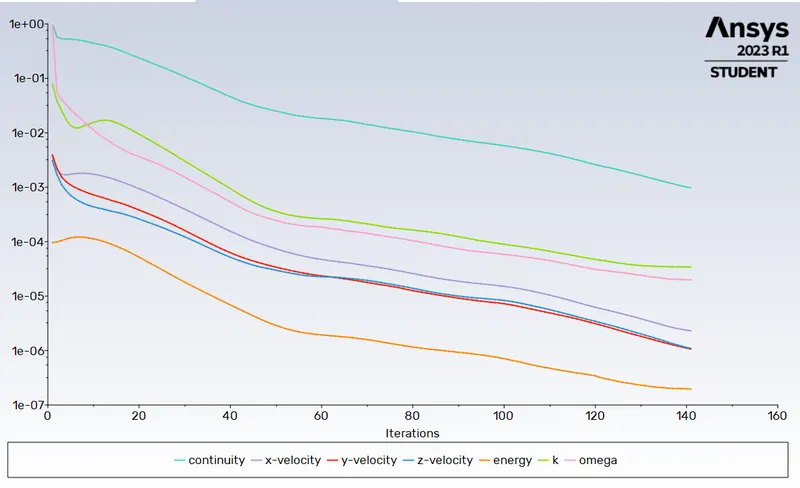
The meshed model is opened in setup window and the above parameters are given using the same way as the previous one and run the model for 300 iterations.
Results
Residual Plot
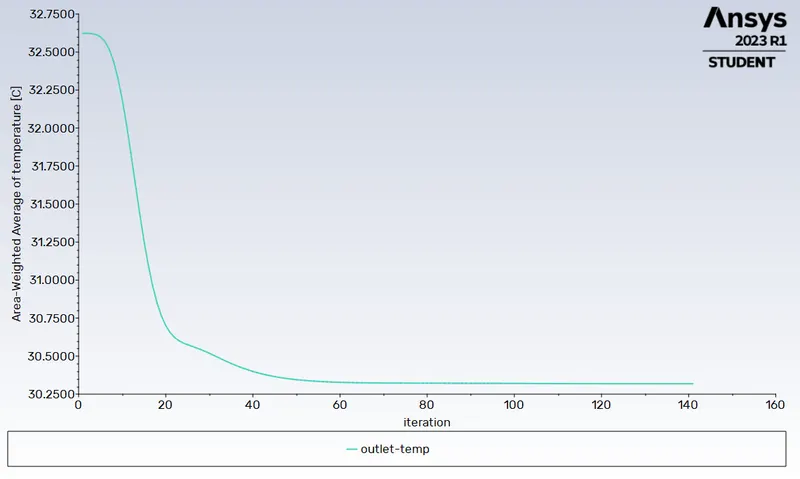
Outlet Temperature
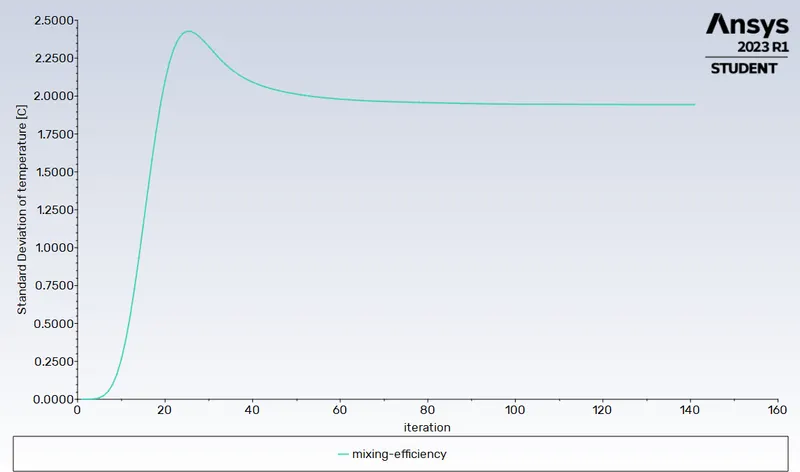
Mixing Efficiency
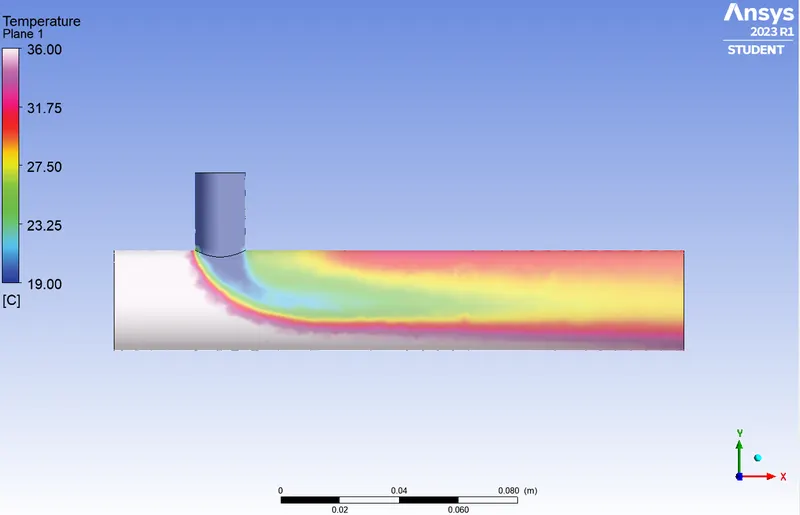
Temperature Contour Along The Pipe
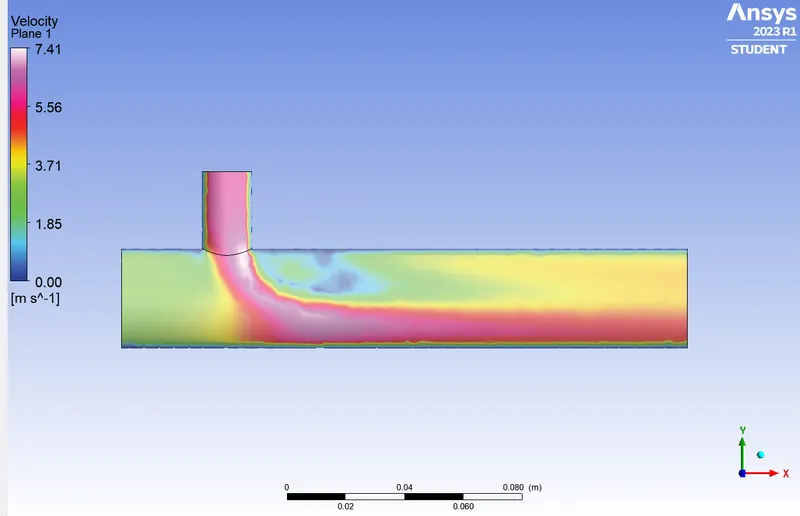
Velocity Contour Along The Pipe
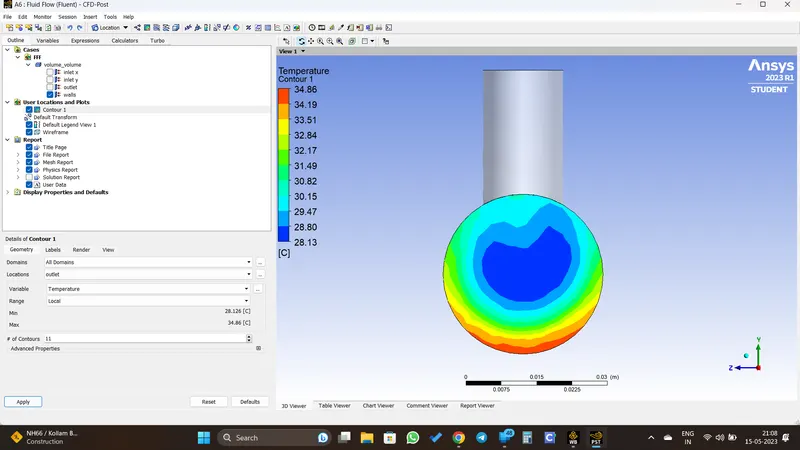
Temperatur Contour Across The Pipe
Velocity Contour Across The Pipe
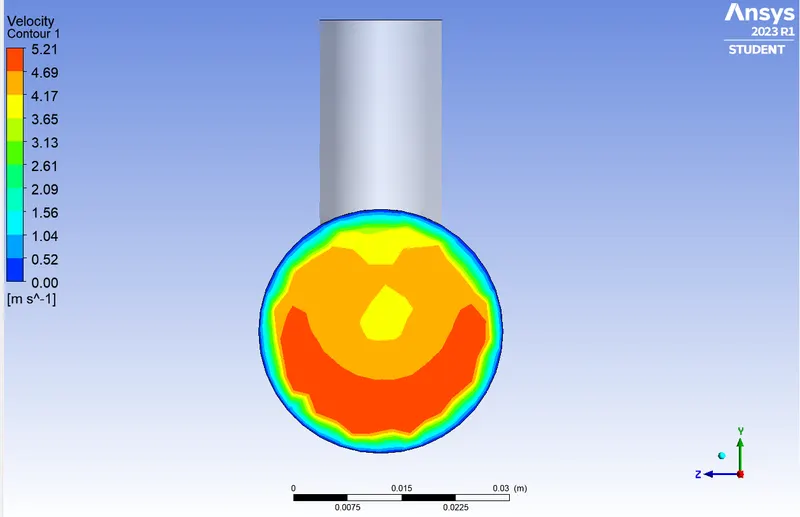
Temperature Line Along The Pipe
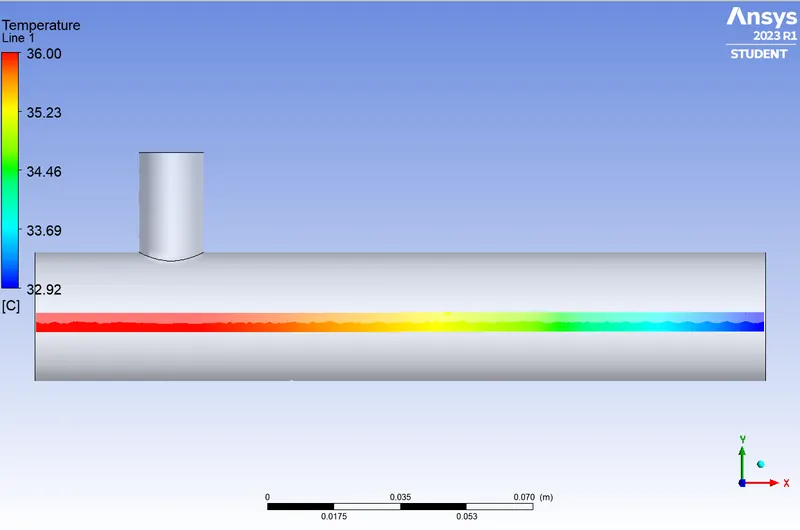
Temperature Line Across The Pipe
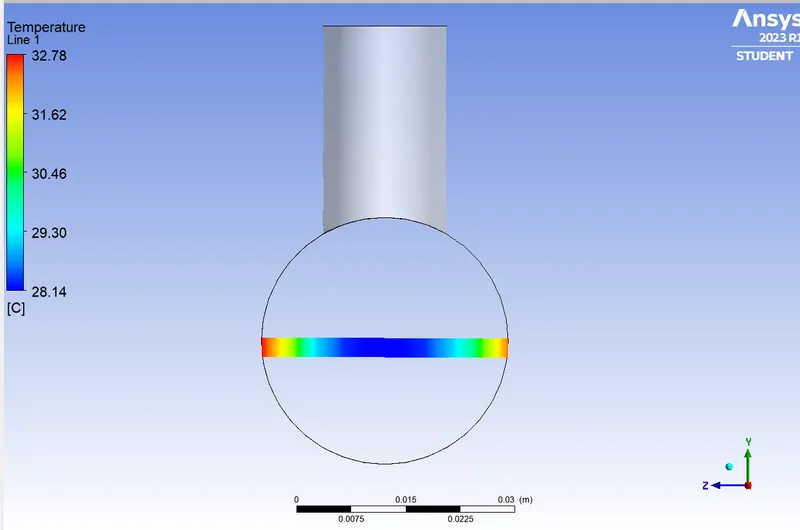
Velocity Line Along The Pipe
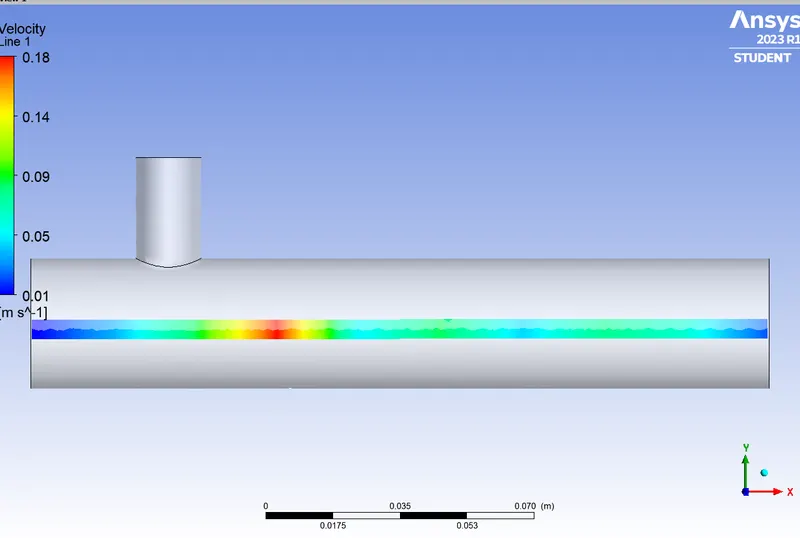
Velocity Line Across The Pipe
k-epsilon vs k-omega
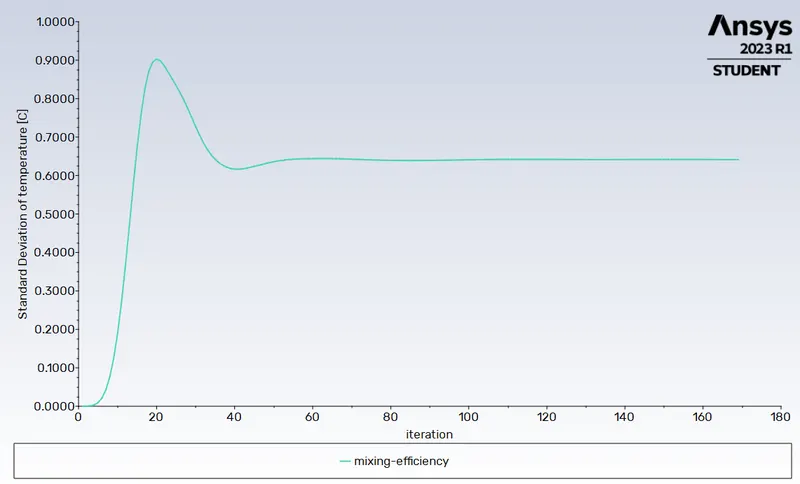
The standard deviation of k-epsilon model is less than k-omega model which shows the better mixing efficiency in k-epsilon model.
Also;
- k-epsilon give better predictions of turbulence behaviour
- k-epsilon is well suited for wall bounded flow as well as simple geometry
- k-epsilon requires less computational resources
Considering all there factors , we can use the k-epsilon realizable for further cases.
CASE 1.2.1
- Short mixing tee.
- Momentum ratio 4.
- Cold inlet velocity 12 m/s.
- Turbulence Model : k-epsilon
The meshed model is opened in setup window and the above parameters are given using the same way as the previous one and run the model for 300 iterations.
Results
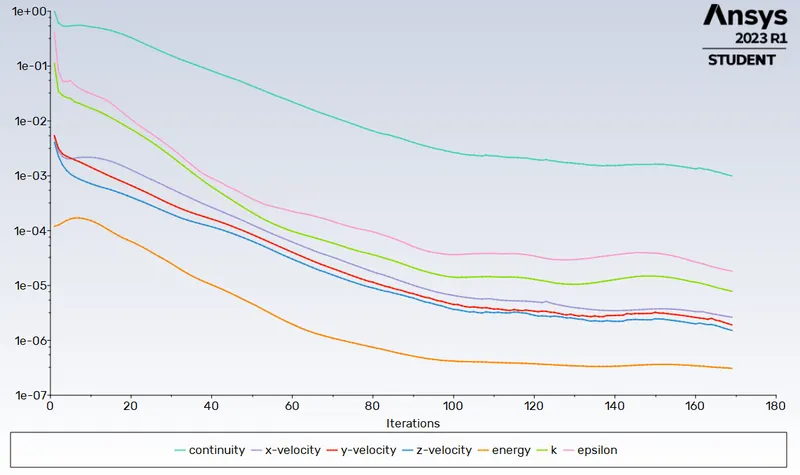
Residual Plot
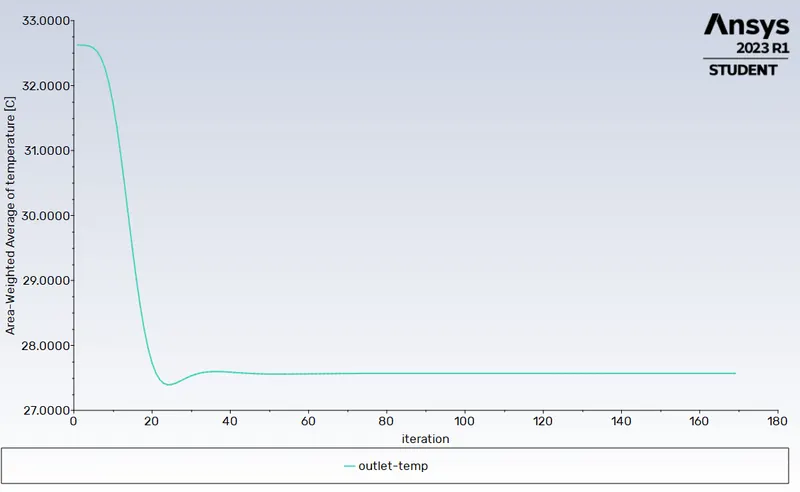
Outlet Temperature
Mixing Efficiency
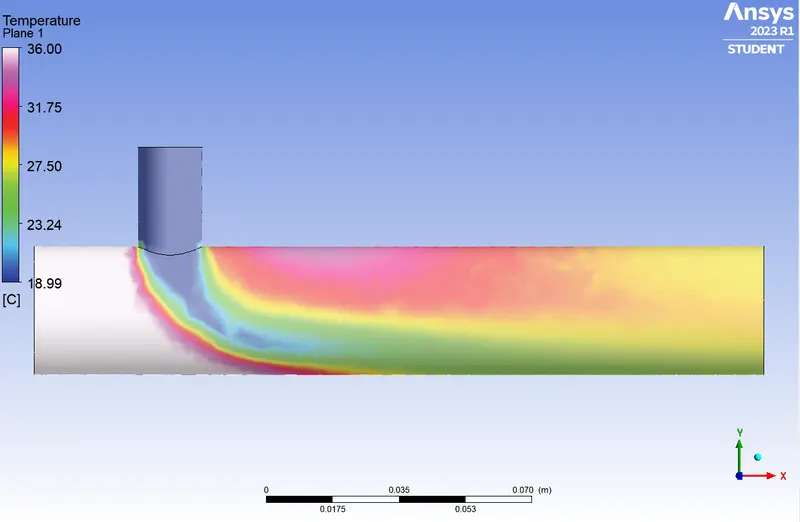
Temperature Conture Along The Pipe
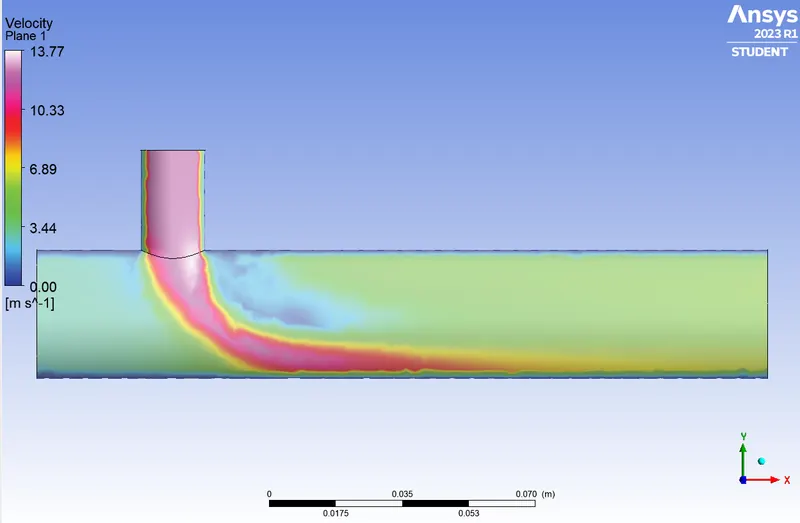
Velocity Conture Along The Pipe
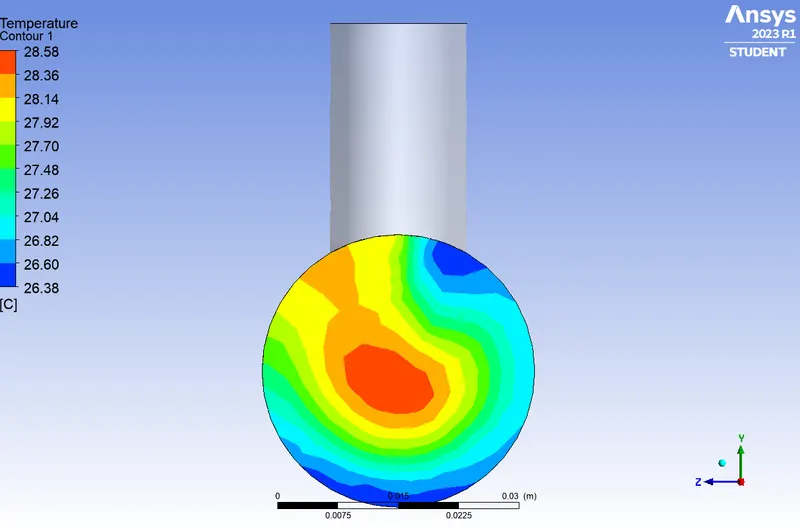
Temperature Conture Across The Pipe
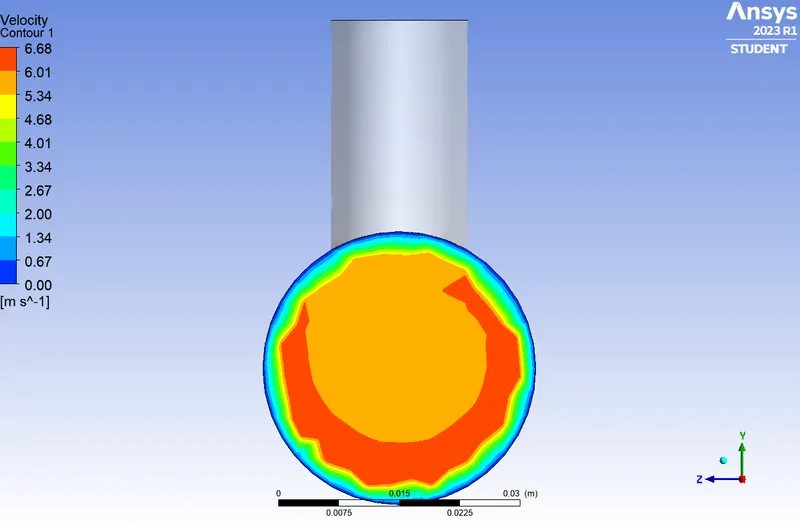
Velocity Conture Across The Pipe
Temperature Line Along The Pipe
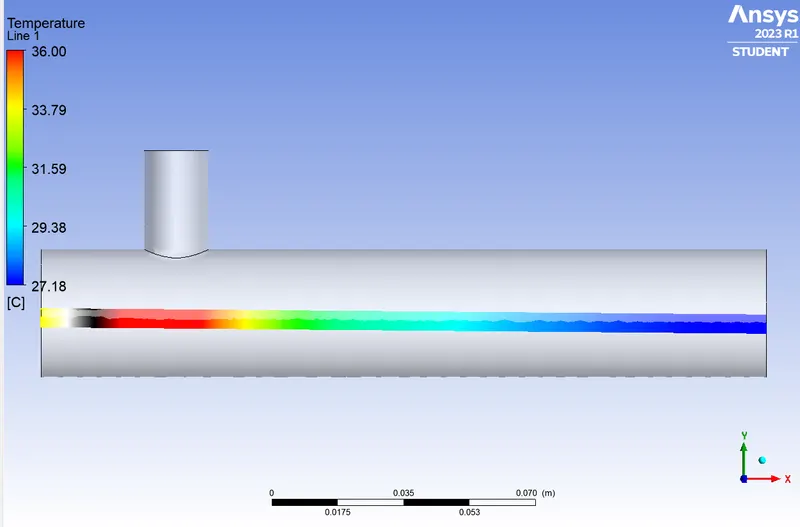
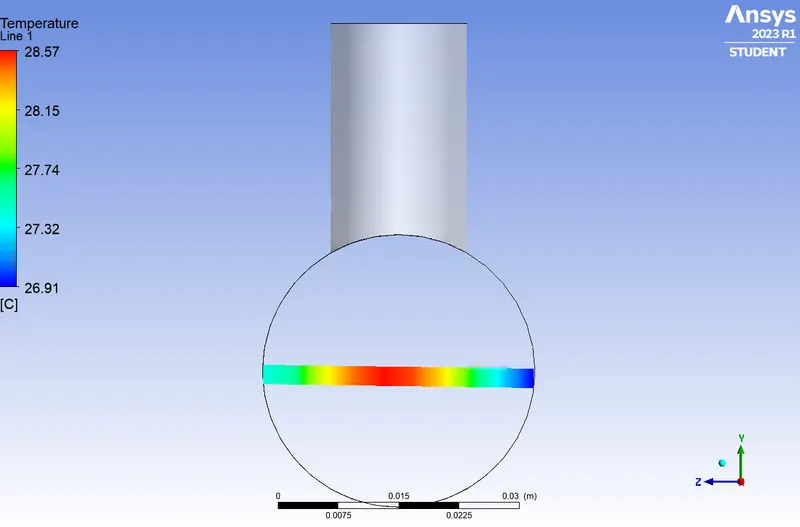
Temperature Line Across The Pipe
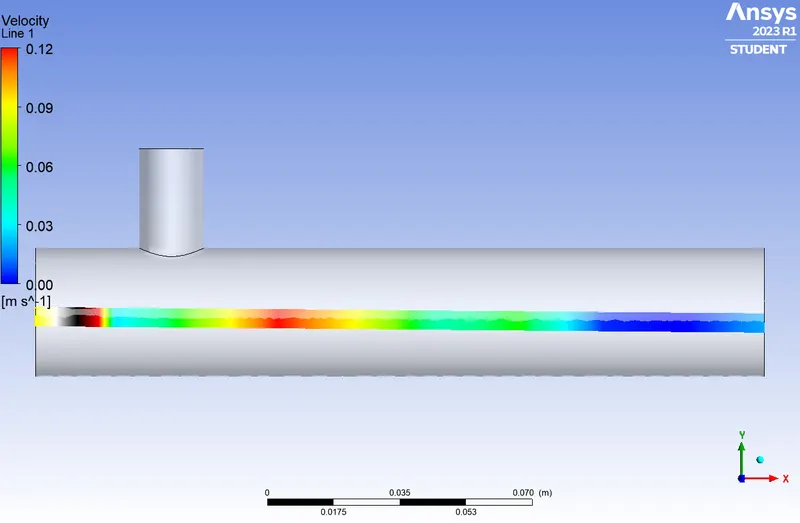
Velocity Line Along The Pipe
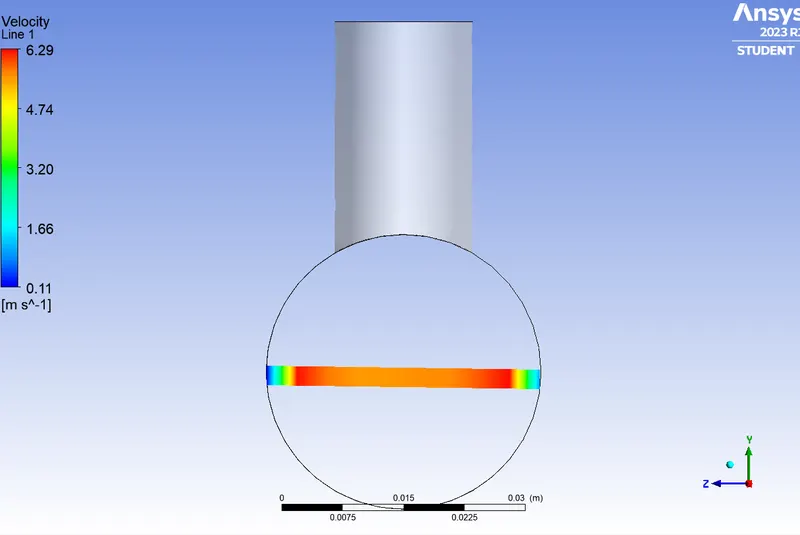
Velocity Line Across The Pipe
CASE 2
- Long mixing tee
- Momentum ratio of 2, 4.
The model is opened in space claim and removed all the external faces same as in the case of short tee
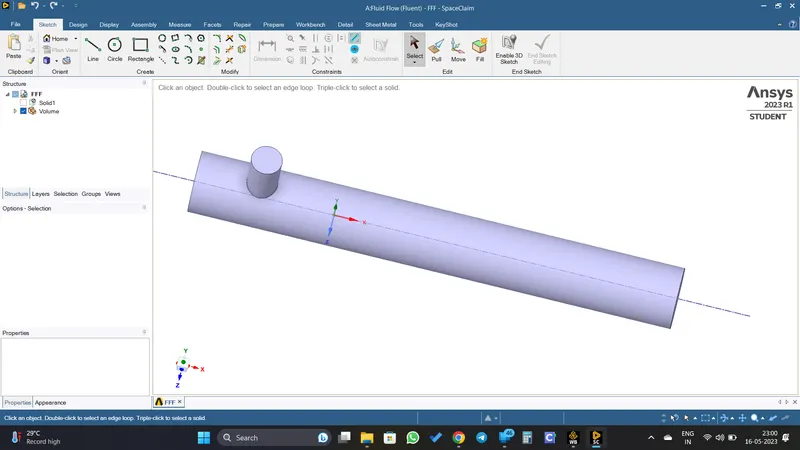
Then the model is opened in Mesh window and name the faces and done the meshing using the generate mesh option.
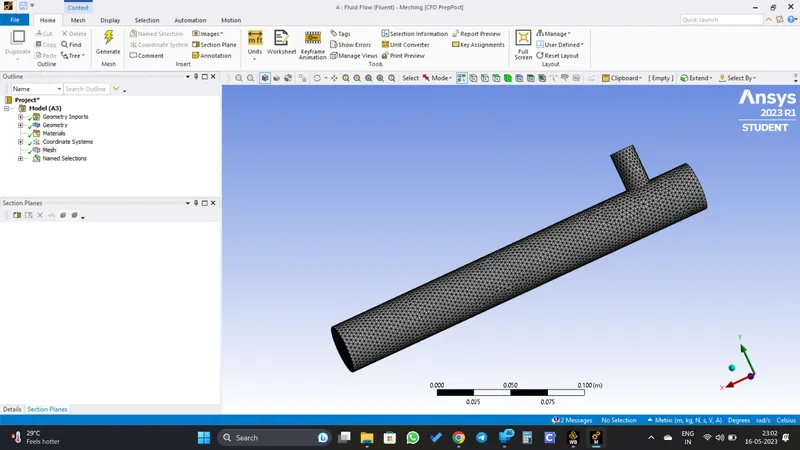
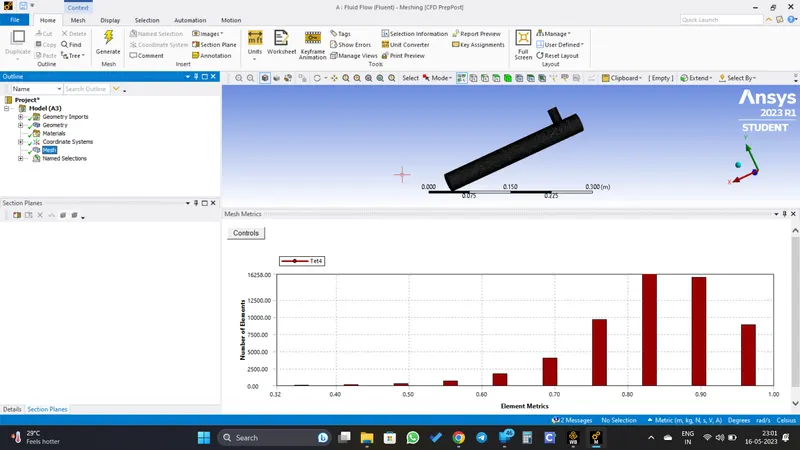
The element quality should not be less than 5%. But here it is above 35%, so we can proceed.
CASE 2.1
- Long mixing tee.
- Momentum ratio 2.
- Cold inlet velocity 6 m/s.
- Turbulence Model : k-epsilon
The meshed model is opened in setup window and the flow parameters are defined.
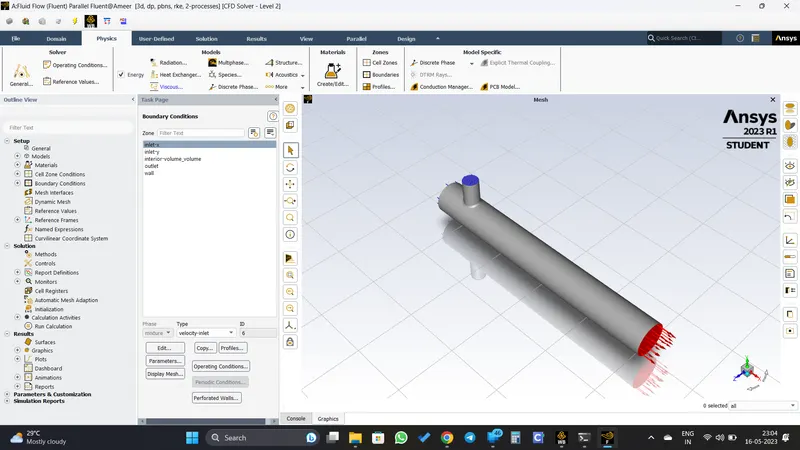
Initialize and run it for 300 iterations.
Results
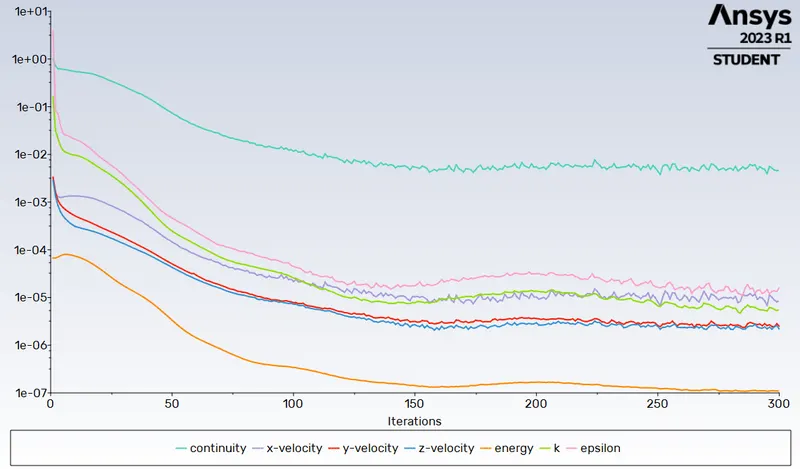
Residual Plot
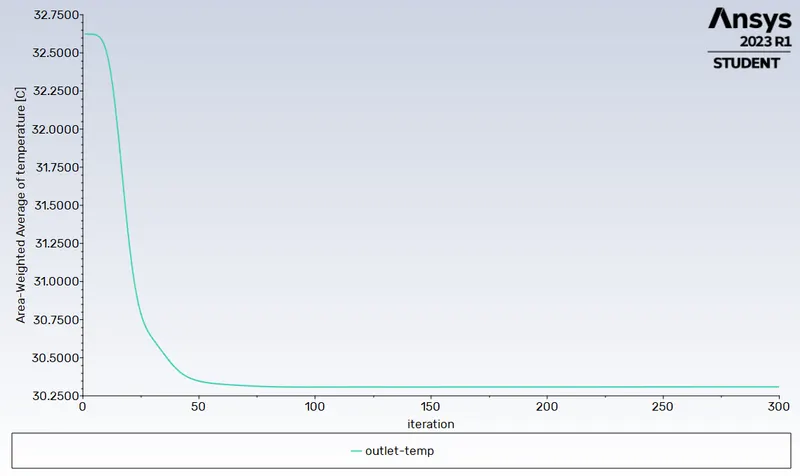
Outlet Temperature
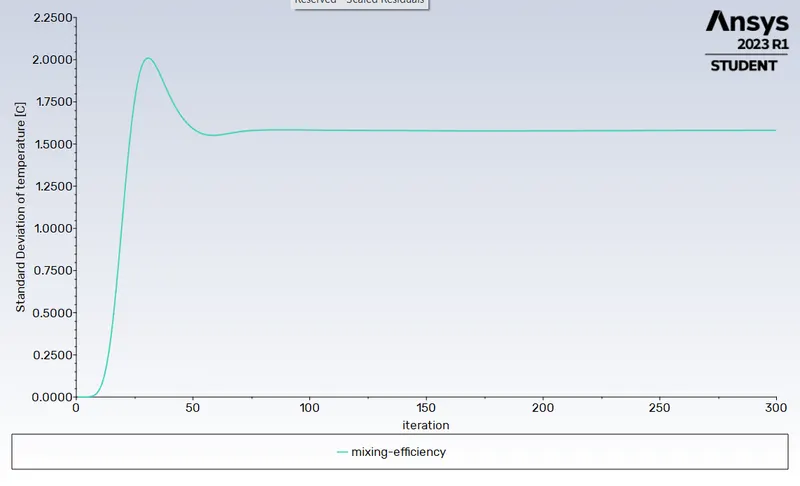
Mixing Efficiency
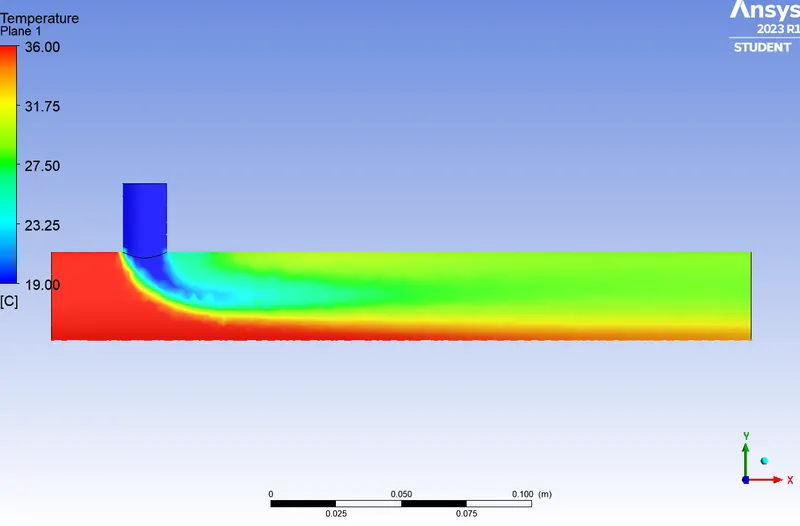
Temperature Contour Along The Pipe
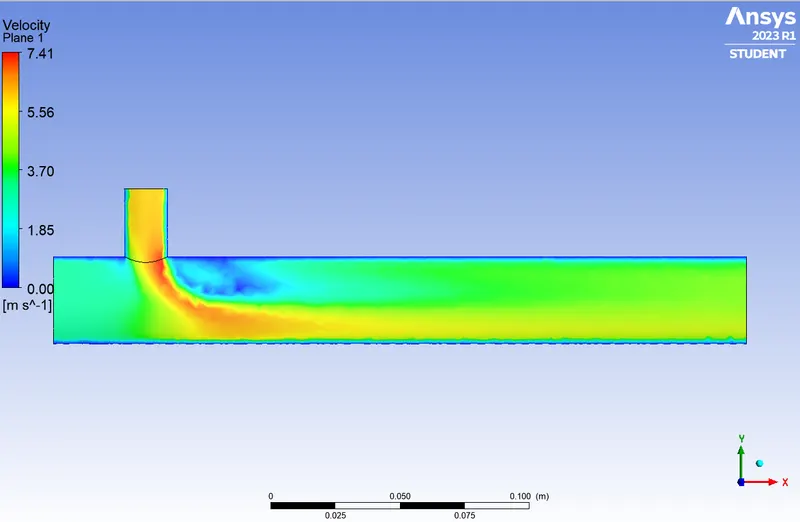
Velocity Contour Along The Pipe
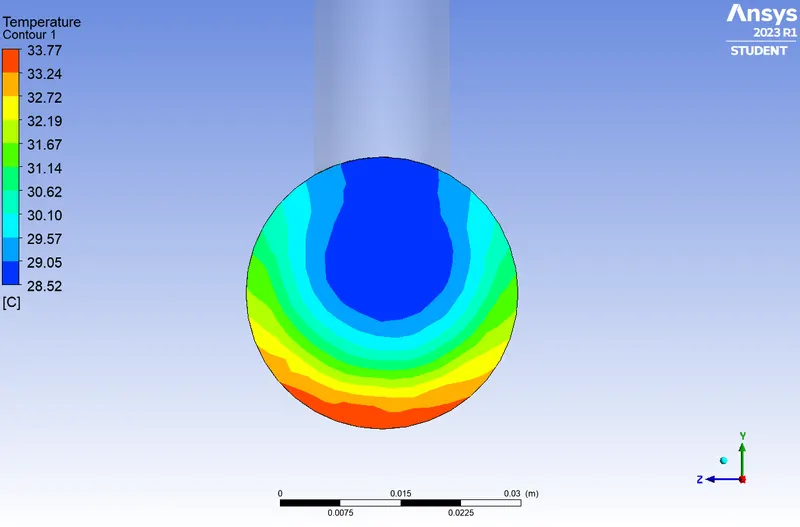
Temperature Contour Across The Pipe
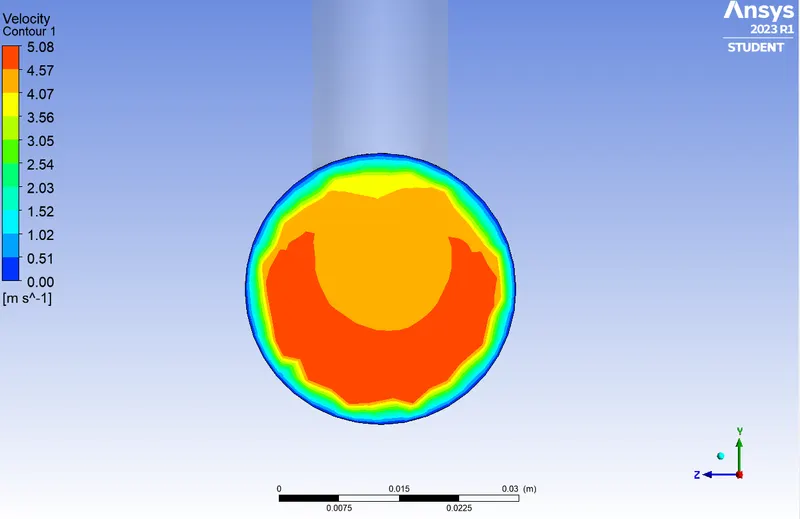
Velocity Contour Across The Pipe
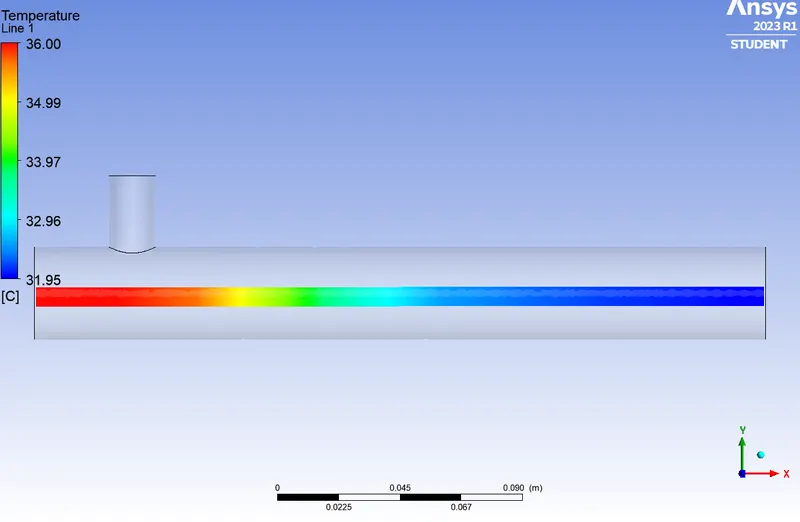
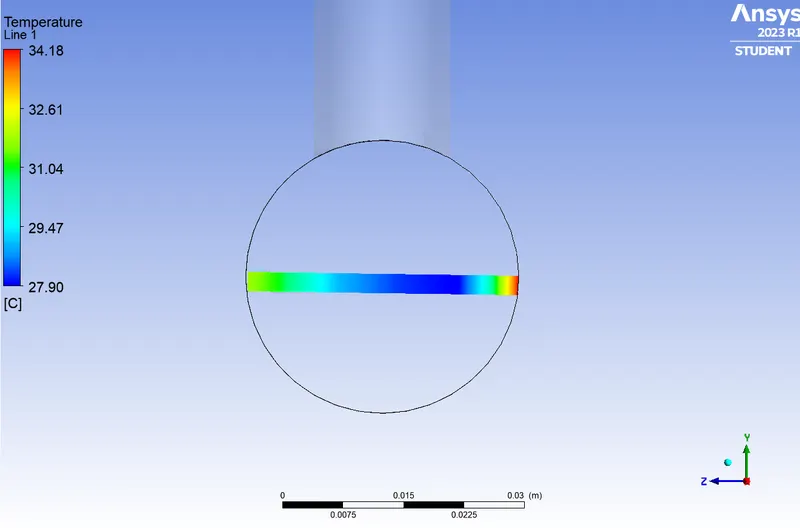
Temperature Line Along The Pipe
Temperature Line Across The Pipe
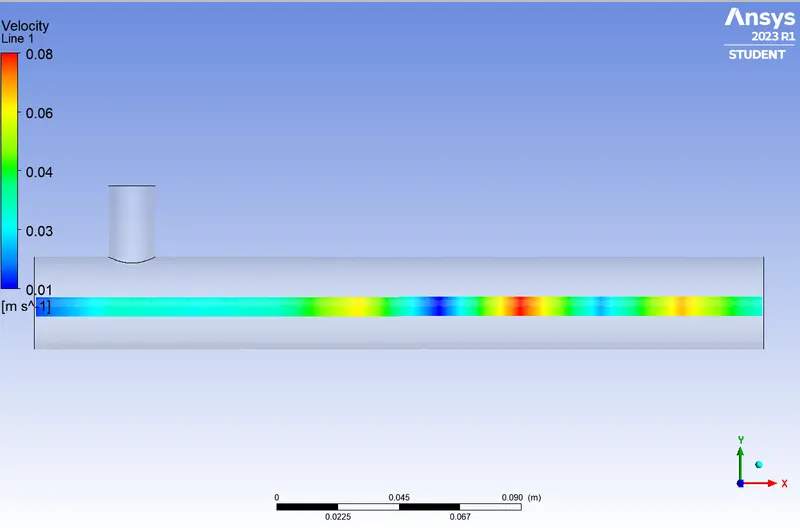
Velocity Line Along The Pipe
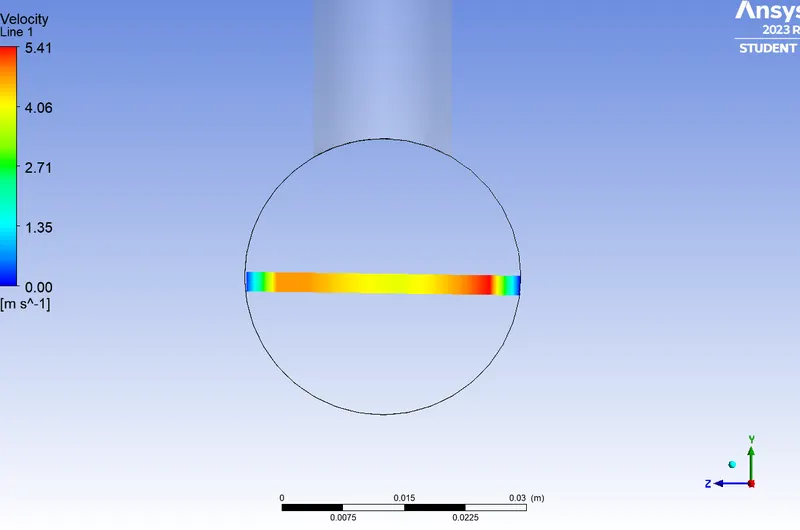
Velocity Line Across The Pipe
CASE 2.2
- Long mixing tee.
- Momentum ratio 4.
- Cold inlet velocity 12 m/s.
- Turbulence Model : k-epsilon
The meshed model is opened in setup window and the flow parameters are defined.
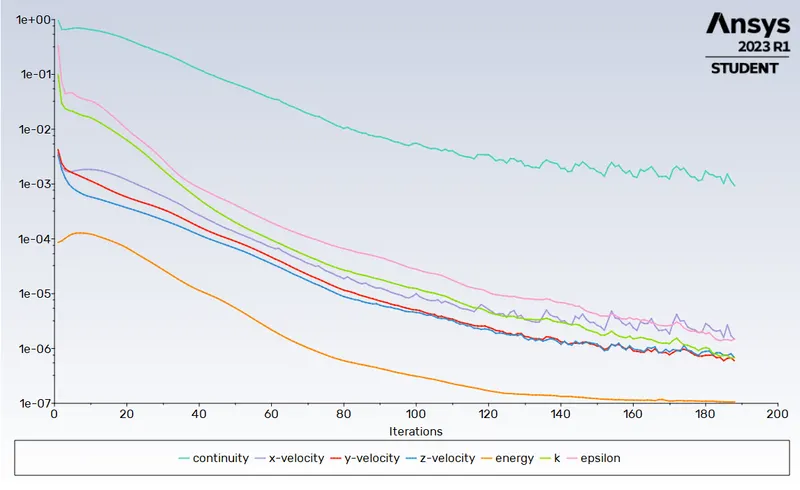
Residual Plot
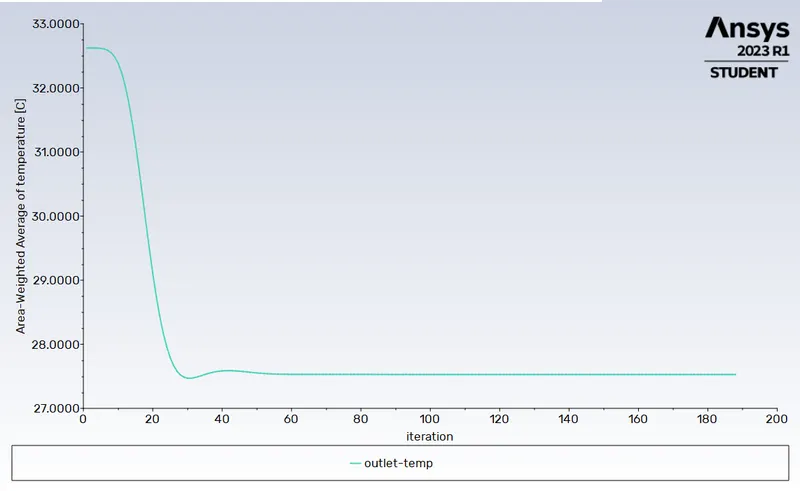
Outlet Temperature
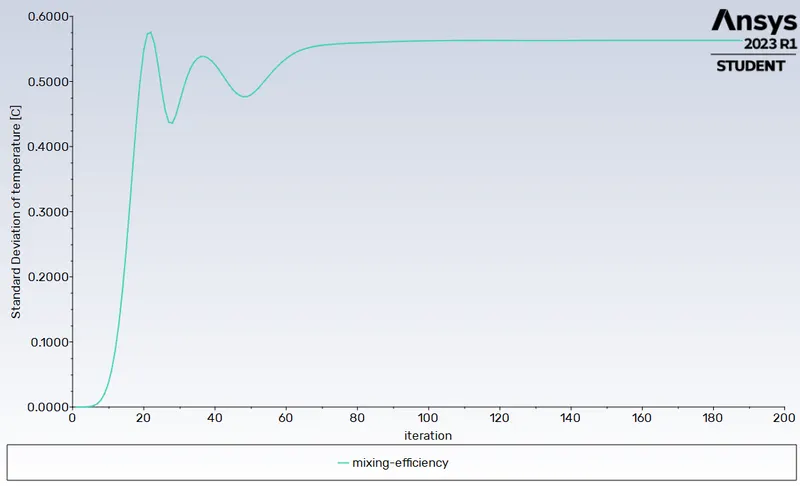
Mixing Efficiency
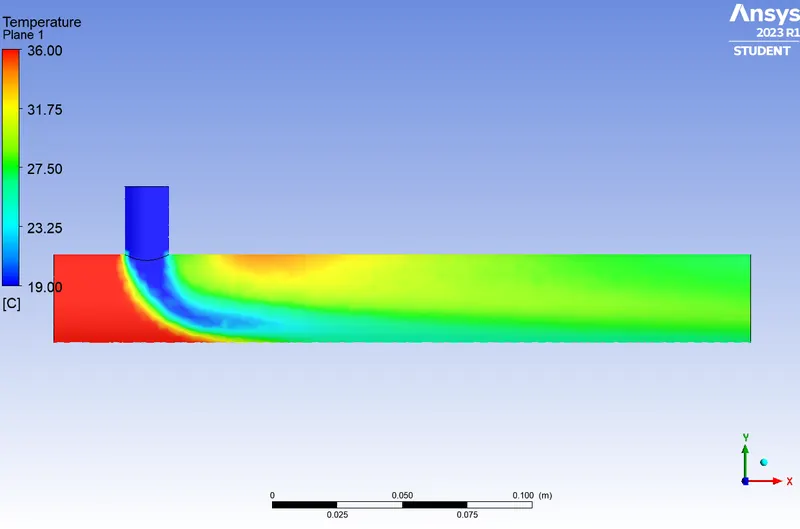
Temperature Contour Along The Pipe
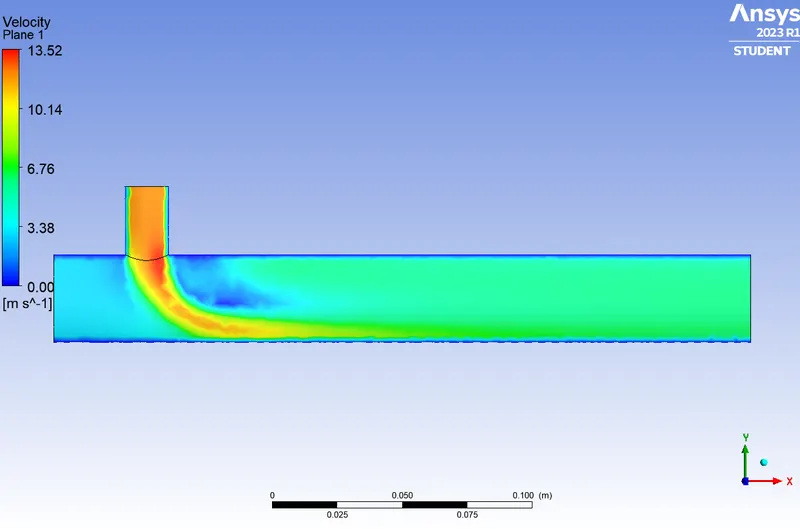
Velocity Contour Along The Pipe
Temperature Contour Across The Pipe
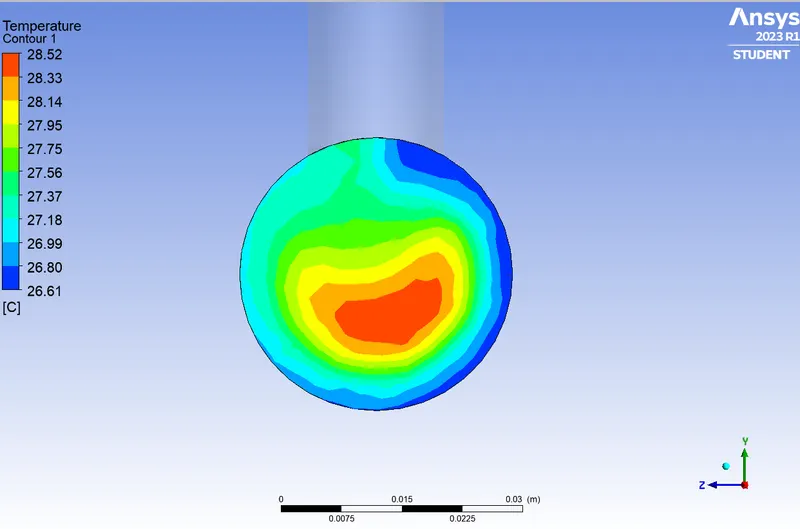
Velocity Contour Across The Pipe
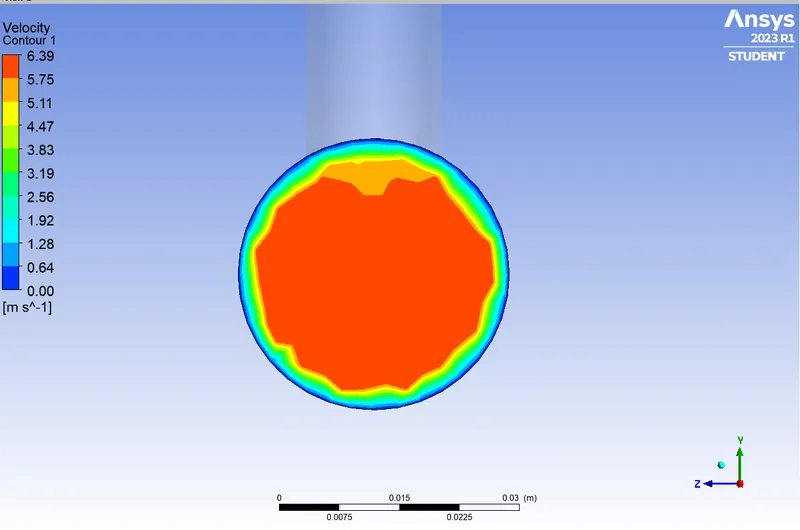
Temperature Line Along The Pipe
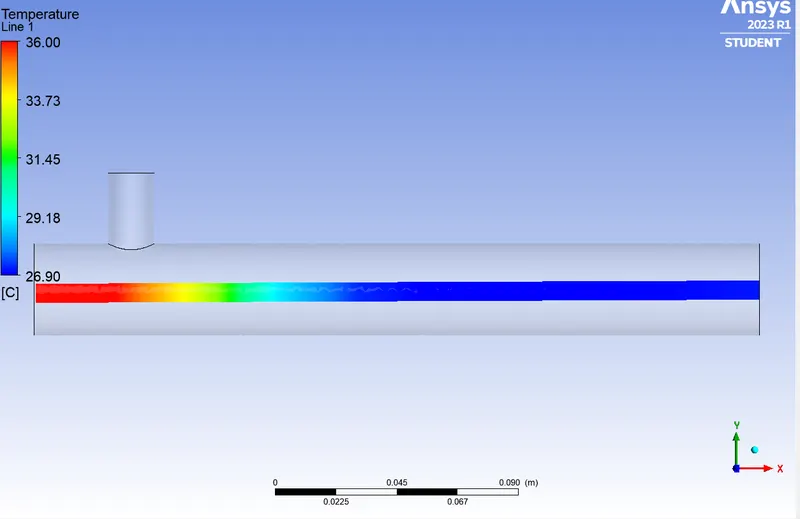
Temperature Line Across The Pipe
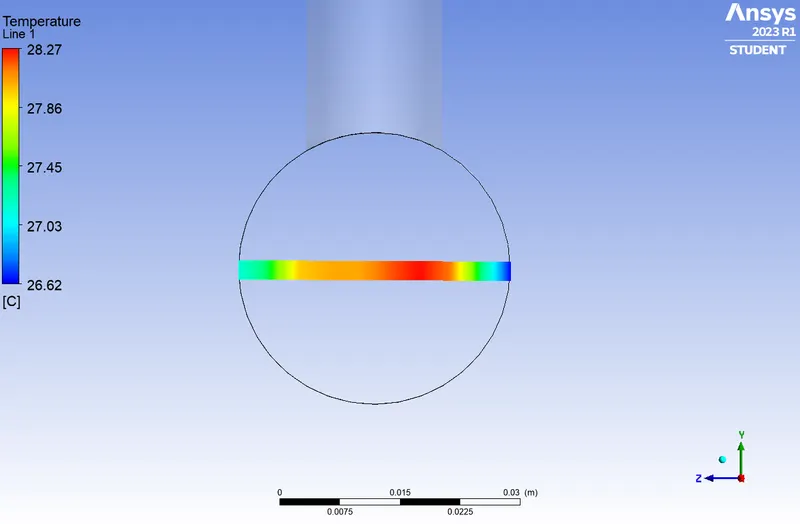
Velocity Line Along The Pipe
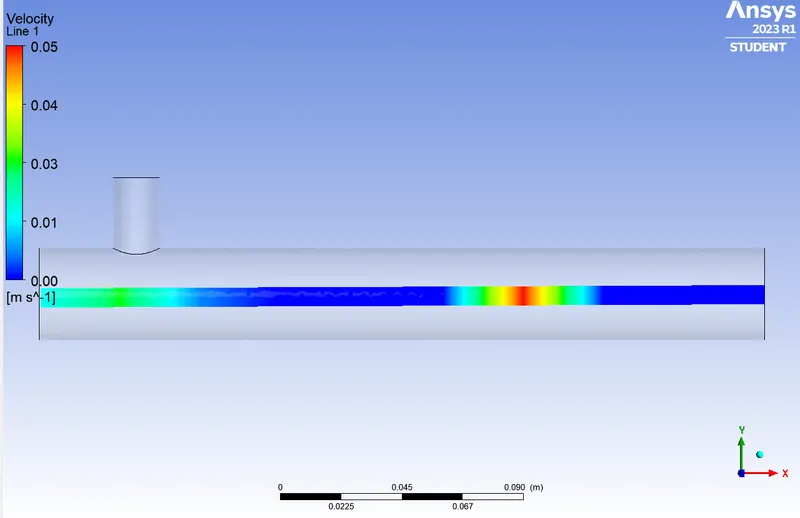
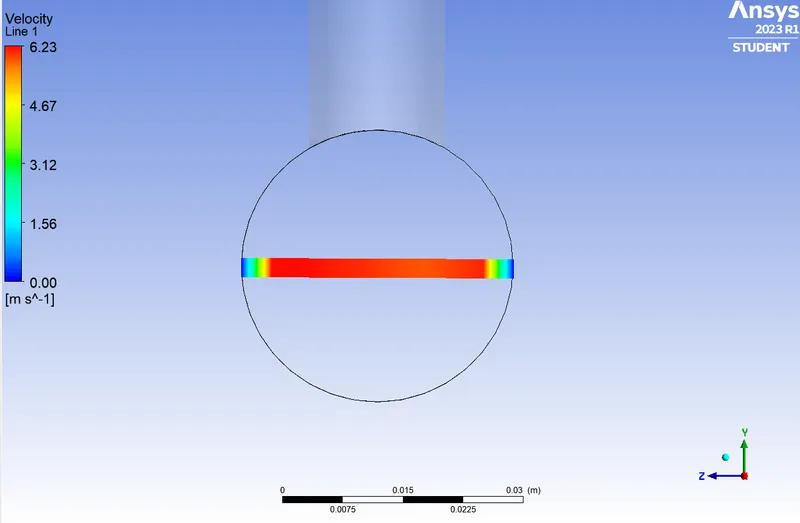
Velocity Line Across The Pipe
COMPARISON OF THE CASES
| CASES | GEOMETRY | MOMENT RATIO | TURBULENCE MODEL | CELL COUNT | AVERAGE OUTLET TEMPERATURE | NO: OF ITERATIONS FOR CONVERGENCE |
| CASE 1.1.1 | SHORT TEE | 2 | k-epsilon | 39721 | 30.25 0C | 300 |
| CASE 1.2.2 | SHORT TEE | 2 | k-omega | 39721 | 30.31 0C | 141 |
| CASE 1.2.1 | SHORT TEE | 4 | k-epsilon | 39721 | 27.50 0C | 169 |
| CASE 2.1 | LONG TEE | 2 | k-epsilon | 56884 | 30.30 0C | 300 |
| CASE 2.2 | LONG TEE | 4 | k-epsilon | 56884 | 27.52 0C | 188 |
MESH INDEPENDENT STUDY
Case 1.1.1 is taken for this study.
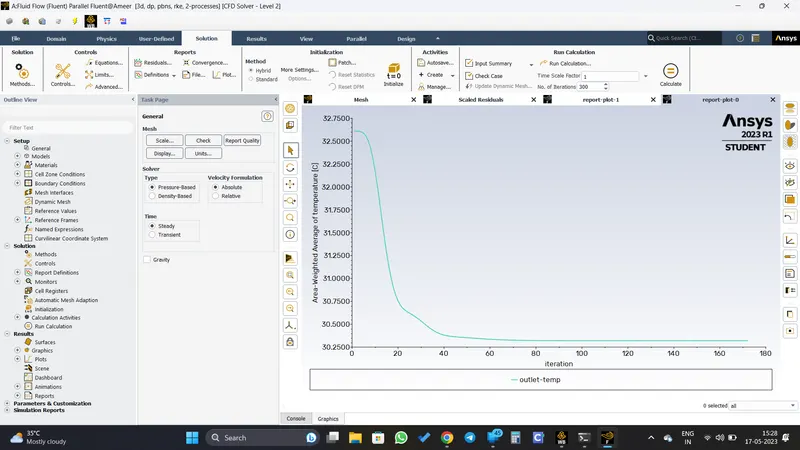
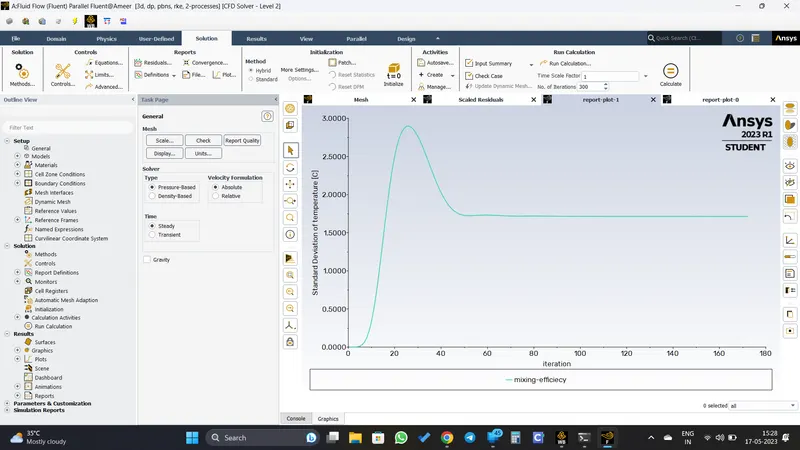
Mesh of element size 2 mm
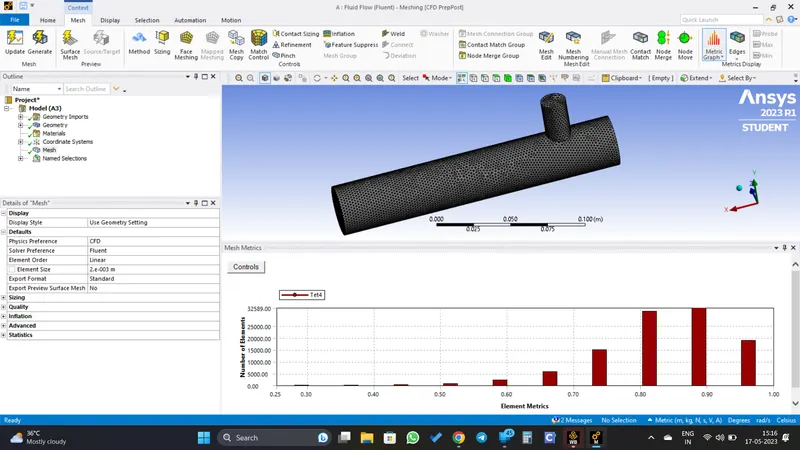
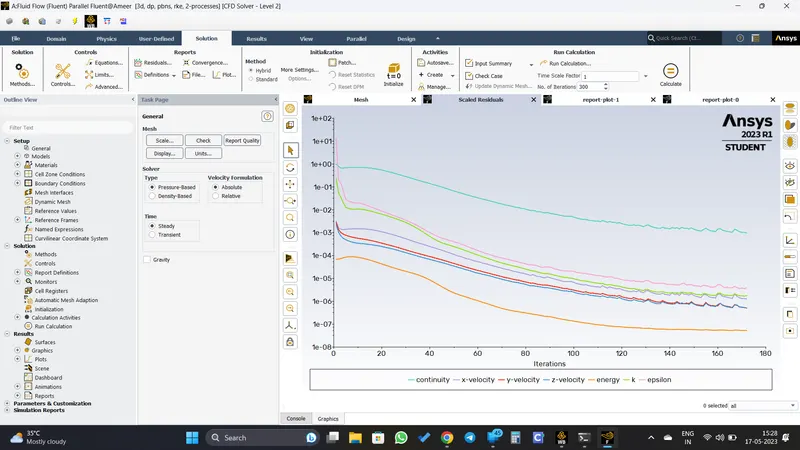
Residula Plot
Outlet Temperature
Mixing Efficiency
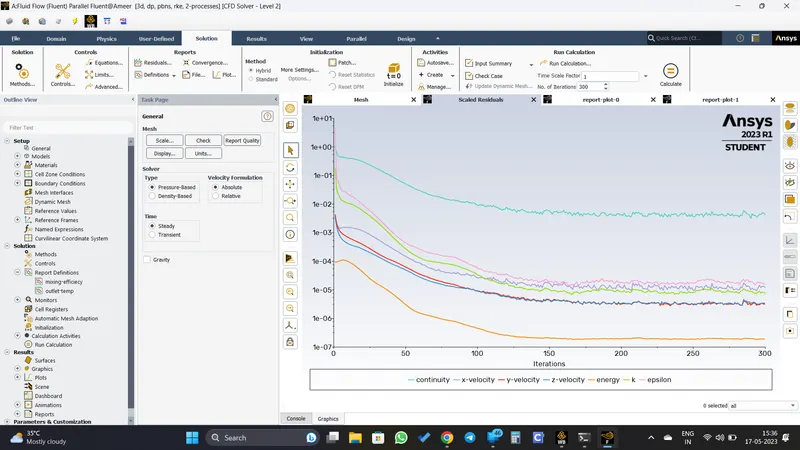
Mesh of element size 3 mm
Residual Plot
Outlet Temperature
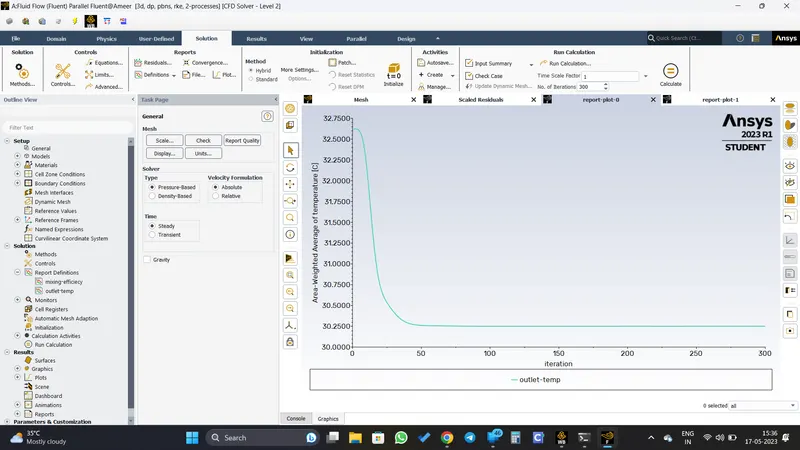
Mixing Efficiency
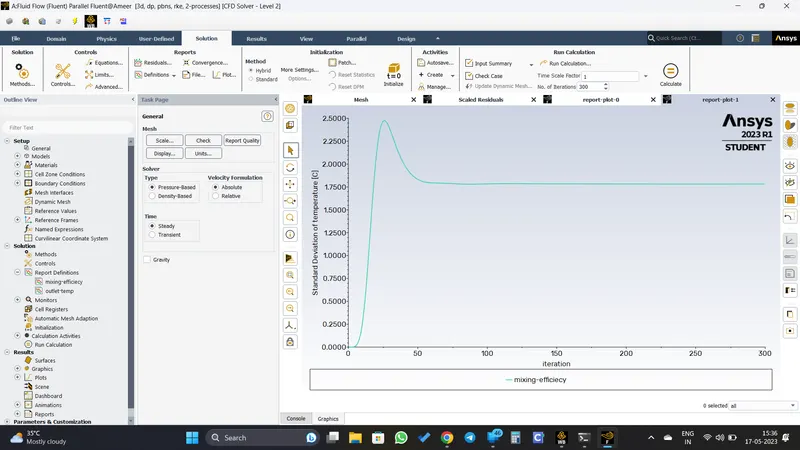
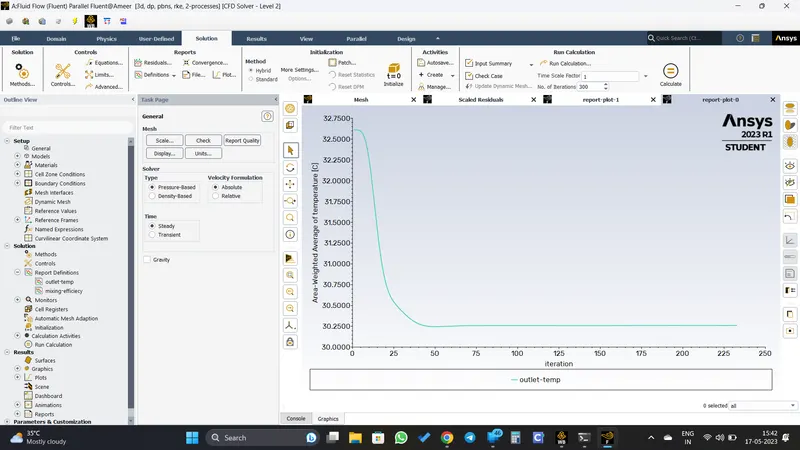
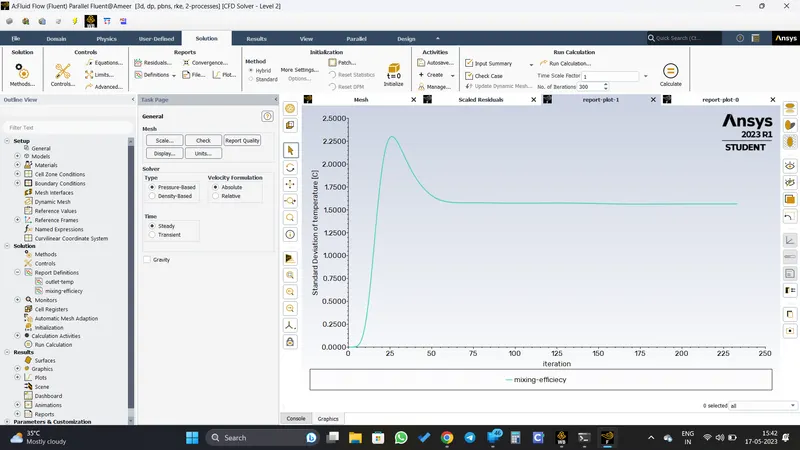
Mesh of element size 4 mm
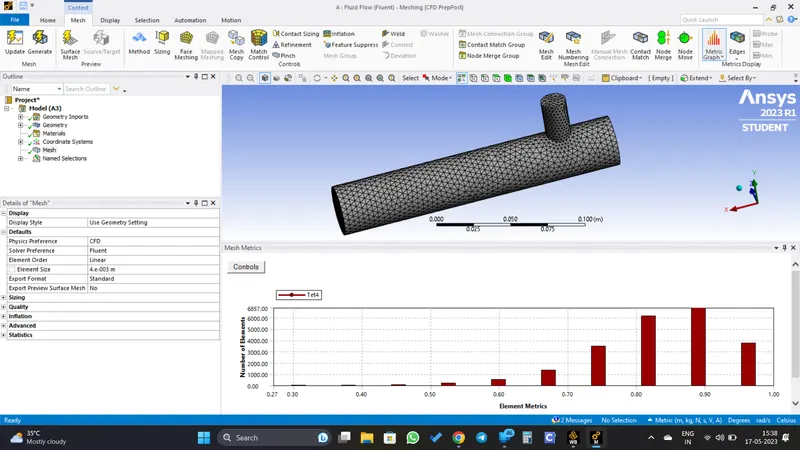
Residual Plot
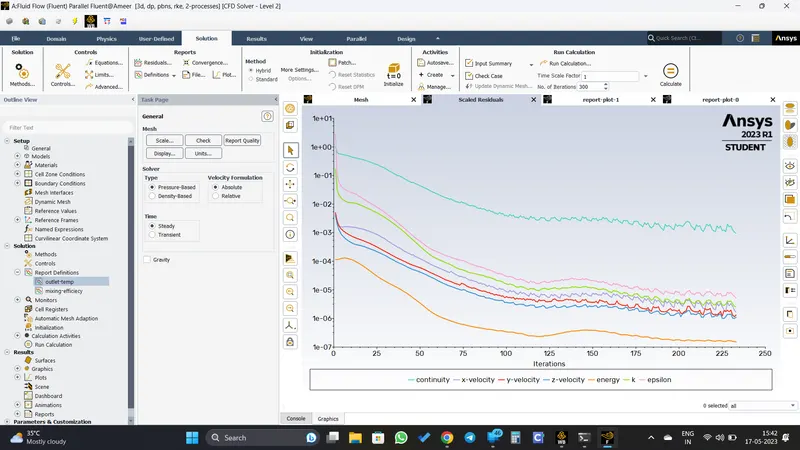
Outlet Temperature
Mixing Efficiency
OBSERVATION
| ELEMENT SIZE | NO: OF ELEMENTS | AVERAGE OUTLET TEMPERATURE | NO: OF ITERATIONS |
| 2 mm | 106253 | 30.30 0C | 172 |
| 3 mm | 39721 | 30.25 0C | 300 |
| 4 mm | 22256 | 30.25 0C | 233 |
CONCLUSION
- Mesh size have significient impact of the numerical result.
- Here as the mesh size is reduced the numerical result approaches the analytical result. Reducing the mesh size further more didn't make any significant change in the result.
- But reducing the mesh size also increases the computational time and need more computational resource.
- Condering all thee factors we can see that 3 mm mesh size is suitabke for this model.
EFFECT OF LENGTH OF PIPE AND MOMENTUM RATIO
EFFECT OF LENGTH OF PIPE
- Generally, a longer mixing tee provides more opportunities for the fluids to mix thoroughly. As the fluids flow through the longer tee, they have a higher likelihood of interacting and exchanging momentum, resulting in enhanced mixing.
- But in this case the length of the mixing tee didn't have significant imoact on the outlet temperature.
- This may be because of the difference in length of the given models is not that much to influence on the mixing of the fluid.
EFFECT OF MOMENT RATIO
HIGH MOMENTUM RATIO
- When the momentum ratio is high, meaning the cold inlet velocity is much greater than the hot inlet velicity, it can result in a more dominant flow from the cold inlet. This can lead to a stronger turbulent mixing of the cold fluid onto the hot fluid, promoting mixing and heat transfer between the two streams.
- It may also cause increased pressure drop and flow separation issues.
- These effects can be seen form the results.
LOW MOMENTUM RATIO
- When the momentum ratio is low, with the hot inlet velocity much greater than the cold inlet velocity, the flow from the hot inlet can dominate, resulting in less effective mixing.
- This may lead to incomplete mixing between the two fluids.
- These effects also can be seen form the results.
Click here for Project Files