Week 3 - External flow simulation over an Ahmed body.
Ahmed Body & its importance:
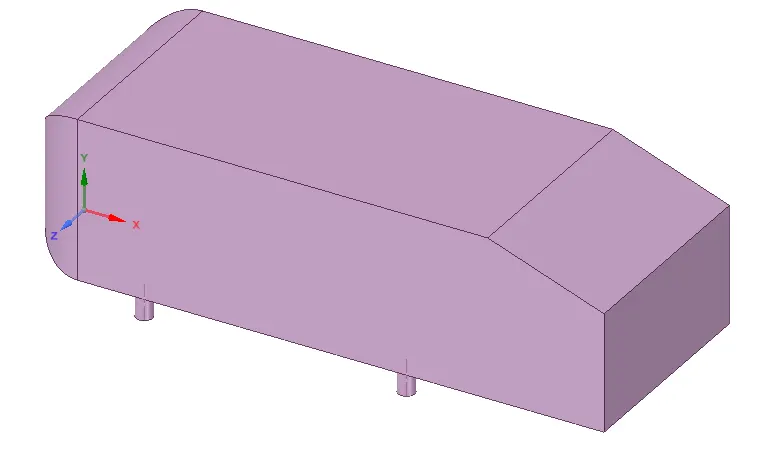
Ahmed body is the simplified version of the automobile body, it is generally the replica of the automobile body. It helps us to understand the dynamics of the automobile body in a simplified way, and also to understand the concept of wake regions generated during the flow. It is generally used to correlate the designer's numerical data with the body's analytical results, which were calculated faster and more efficiently.
Negative Pressure In The Wake Region & Significance of Point of Separation
As the fluid flow over the surface, the particle of fluid gets over the surface layer by layer, the bottom-most point gets attached to the surface a per no-slip condition, and significantly, there is resistance in the upper layer as a resulting boundary gets formed in y+ regions;
Inside the boundary layer, viscous effects get dominated, as a result of which the following three conditions have been generated:
- Forward Flow: In such conditions, a favorable pressure gradient exists, which means pressure gets decreasing and velocity keeps increasing, therefore pressure force assists the flow in the forward direction.
- Point of Separation: In such a condition, the velocity gets zero at the stagnation point, as a result, shear stress gets equal to zero.
- Reverse Flow: In such condition, the unfavorable pressure gradient exit, which means pressure keeps increasing in the flow direction, and velocity keeps decreasing, as a result, fluid has to overcome both above mention resistance points to move forward, which leads to reversal or separation of the boundary layer.
As the following fig. depicts the negative pressure in the rear end of the body (generally in the wake region)
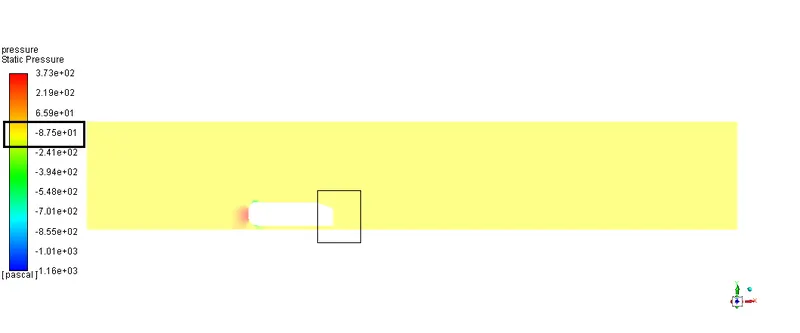
Such incidents mainly occur due to the flow separation in the wake region, which leads to the negative pressure over the such region as a result it leads to the formation of eddies as well over such region. Due to the variable differential pressure over the top and bottom surface, it creates a pressure drag in such regions too, and it further leads to the generation of vibration in such wake regions too.
Geometry:
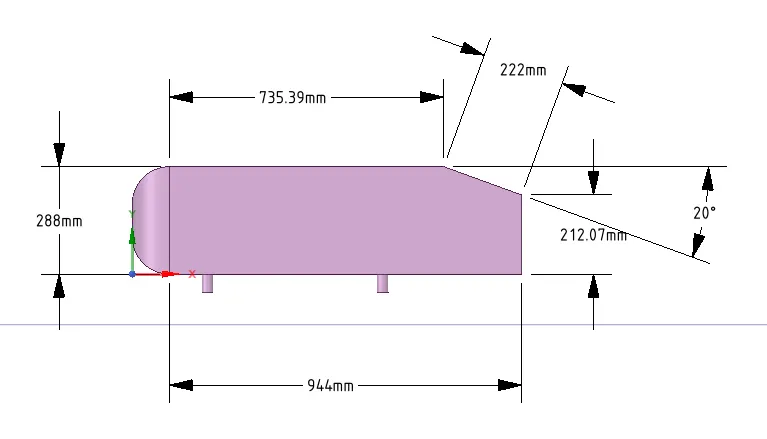
Side View Dimension:
Enclosure Dimensions:
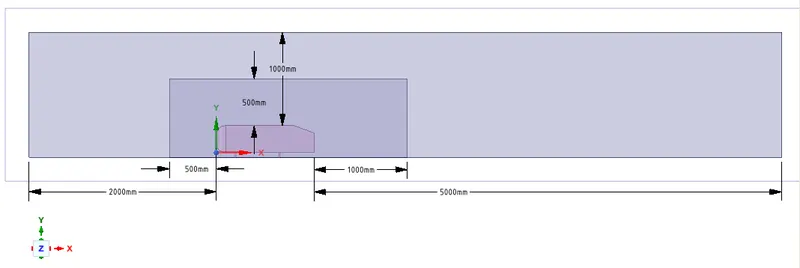
Further Interference were checked via prepare tab (as meshing amoung is enclosure in not alligned as required, therefore to rectify such case, we use such function), and in the properties section share topology is on.
Meshing:
Case 1:
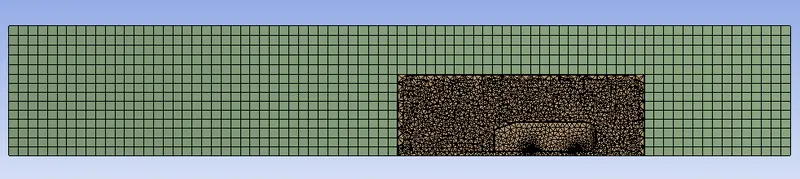
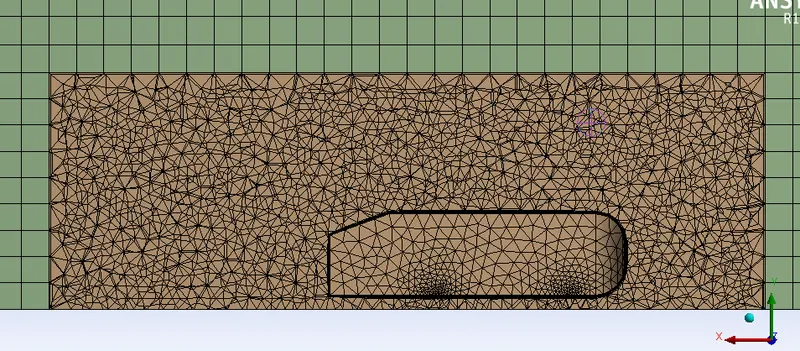
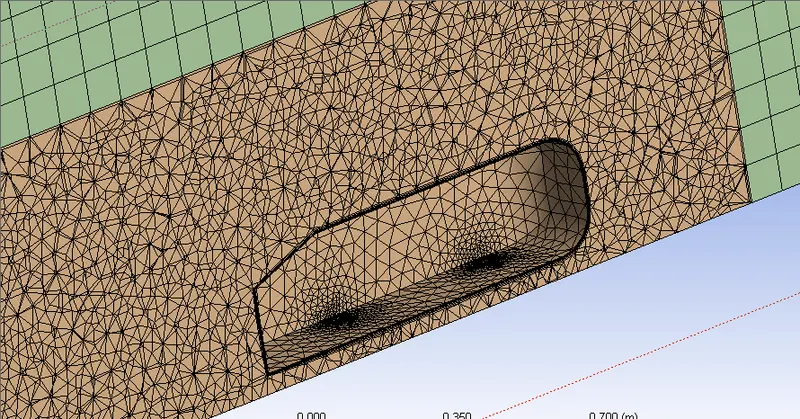
Outer Enclosure: Element Size: 100mm (Hexahedral Mesh)
Inner Enclosure: Element Size: 50mm (triangulation Mesh)
Inflation Layer: 5 (max thickness: 12.5mm)
Total Elements: 188855
Mesh View:
SETUP:
we have use the pressure based steady analysis (as Mach No. comes out to be M<0.3), and choose the K-epsilon viscous model, and material as predefined air, and provide the initial boundary condition at inlet speed to be 25 m/s, and outlet gauge pressure to be zero, as a simulation runs for 1000 iteration, following results were obtained;
Residual Plot:
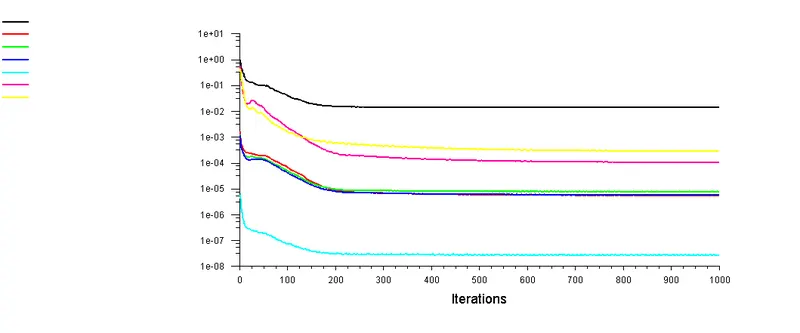
as it get converged around 400 iteration
Velocity Contour:
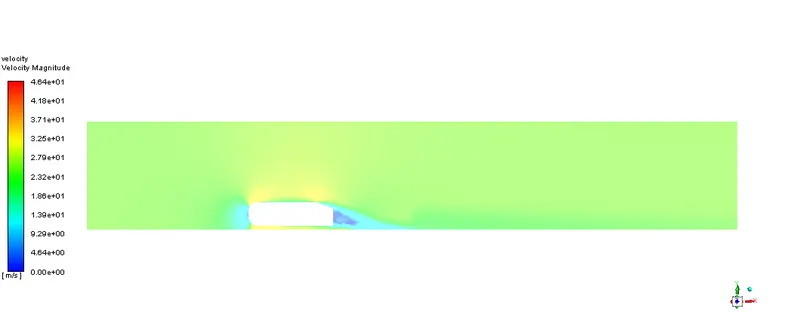
PRESSURE CONTOUR:
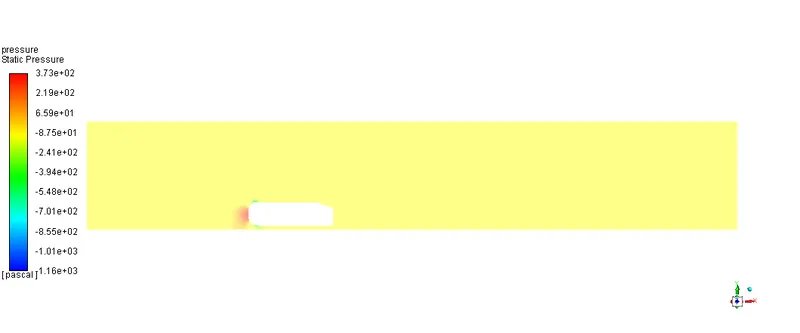
Showing negative pressure in the wake region.
Coefficient Of Drag Plot:
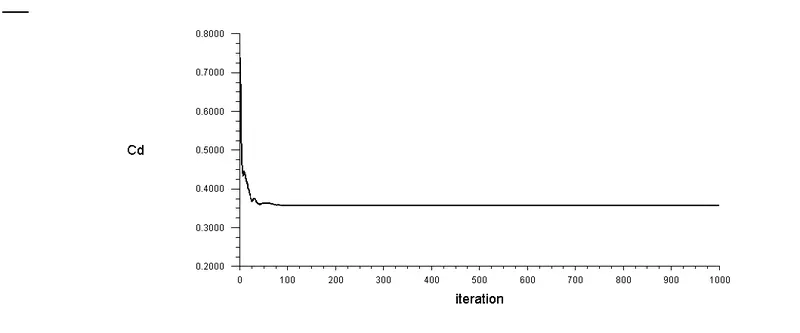
having a value of 0.359092.
Coefficient Of Lift Plot:
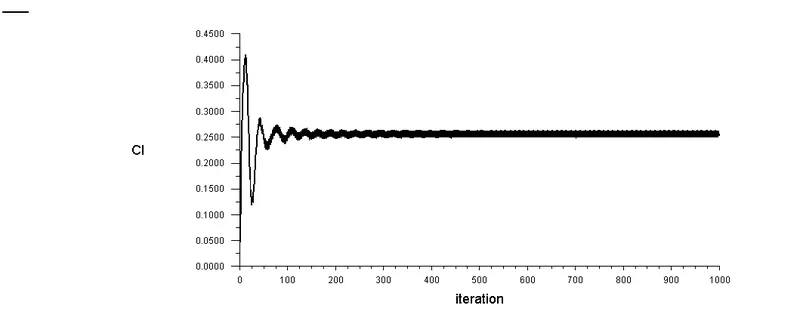
having a value of 0.25361
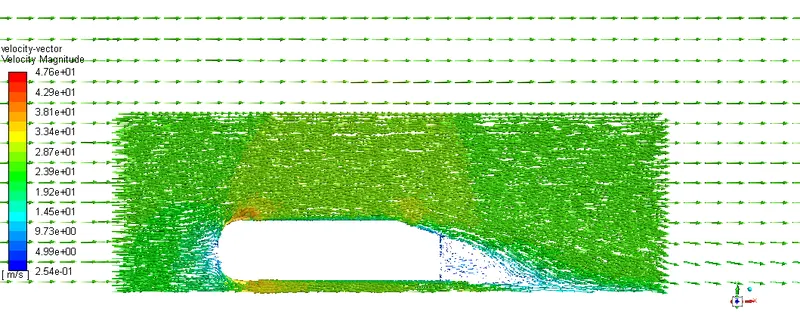
Velocit Vector Plot:
Grid Independency Test:
In such test, we generally alter the element size, to check the proficiency of output result;
We had taken following parameter:
Input Parameter: Outer Enclosure Element Size & Inner Enclosure Element Size
Output Parameter: Coefficient Of Drag, Coefficient Of Lift and Total No. Of Elements
| Outer Enclosure Element Size | Inner Enclosure Element Size | Co-efficient Of Drag | Co-efficient Of Lift | Total No. Of Elements |
| 100 | 50 | 0.35909389 | 0.25347523 | 188855 |
| 90 | 45 | 0.34326676 | 0.23462481 | 239301 |
| 80 | 40 | 0.34306658 | 0.24668047 | 320705 |
| 70 | 35 | 0.33312614 | 0.25030179 | 444637 |
| 60 | 30 | 0.31961725 | 0.24276537 |
679933 |
The following is the plot between Coefficient of Drag V/s Total no. of elements:
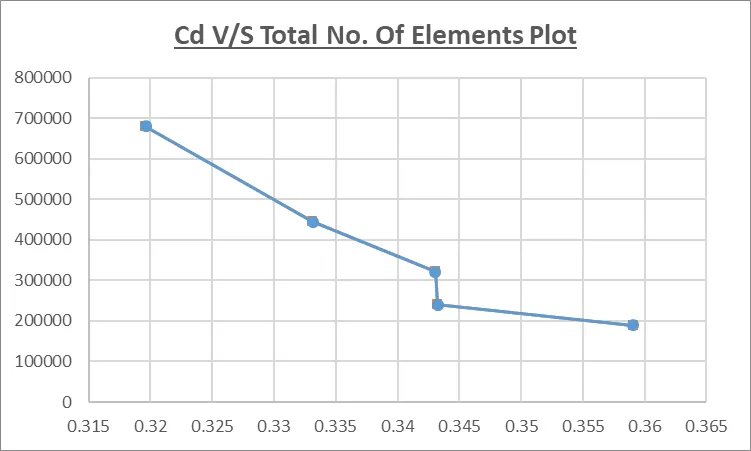
As the size of the Inner & Outer Enclosure elements decreasing, as a result, the coefficient of drag keeps getting decreasing, and the total number of elements keeps getting increased due to the finer mesh arrangement. Therefore we can conclude that for finer mesh, we get the decreasing and well defined value of coefficient of drag, but at the expense of computation time (since finer mesh takes longer time to execute, but gives good result, as compared to coarser mesh)