Week-3 Challenge: ADVISOR Tool
Introduction
ADVISOR tool, developed in November 1994 by the National Renewable Energy Laboratory (NREL), allows users to simulate and analyze conventional, advanced, light, and heavy vehicles, including hybrid electric and fuel cell vehicles. The tool allows users to assess the effect of changes in vehicle components (such as motors, batteries, catalytic converters, climate control systems, and alternative fuels) and other modifications that might affect fuel economy, performance, or emissions.
OBJECTIVE :-
- To simulate the drive cycle using ADVISOR TOOL in SIMULINK.
- To simulate the gradeability test for the TOYOTA PRIUS vehicle using ADVISOR TOOL in SIMULINK.
THEORY :-
ADVISOR, NREL’s ADvanced VehIcle SimulatOR, is a set of model, data, and script text files for use with MATLAB and Simulink. It is designed for rapid analysis of the performance and fuel economy of conventional, electric, and hybrid vehicles. ADVISOR also provides a backbone for the detailed simulation and analysis of user defined drivetrain components, a starting point of verified vehicle data and algorithms from which to take full advantage of the modelling flexibility of Simulink and analytic power of MATLAB.
The benefit of using ADVISOR
- Estimate the fuel economy of vehicles that have not yet been built
- Learn about how conventional, hybrid or electric vehicles use (and lose) energy throughout their drivetrains
- Compare relative tailpipe emissions produced on a number of cycles
- Evaluate an energy management strategy for your hybrid vehicle’s fuel converter
- Optimize the gear ratios in your transmission to minimize fuel use or maximize performance, etc.
How To start ADVISOR Tool
- Launch MATLAB and first set default location folder to the advisor.
- Now in the command window of MATLAB type “advisor” and press enter.
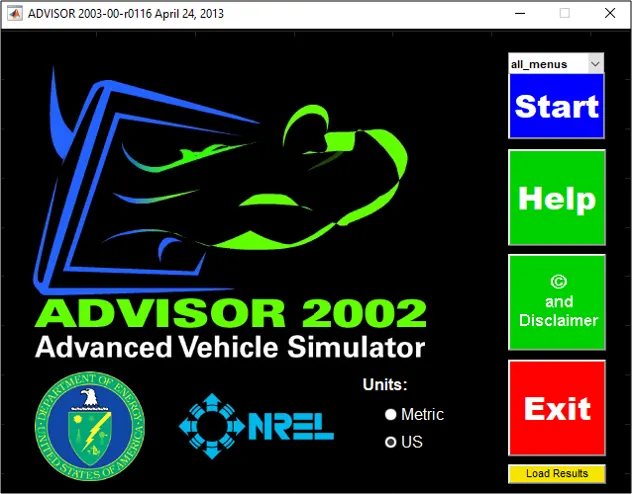
- A new window will open and then set “metric” for unit and start ADVISOR.
- It will launch in a new window.
Advisor tools have 3 windows:
1. Vehicle Input window
2. Simulation Parameter window
3. Results window
SIMULATIONS :-
1) For EV_defaults_in file, if cargo mass is 500 kg with all other default conditions, can the vehicle travel for 45 km with FTP drive cycle.
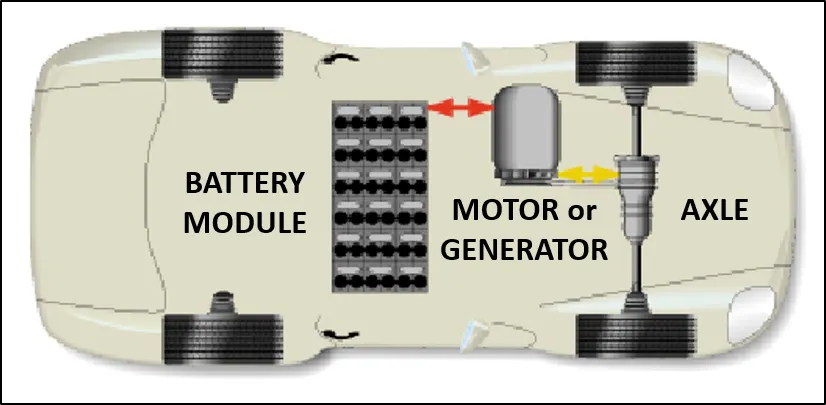
The EV Default vehicle is a pure EV (Electric Vehicle) where it’s completely driven by battery as power source.
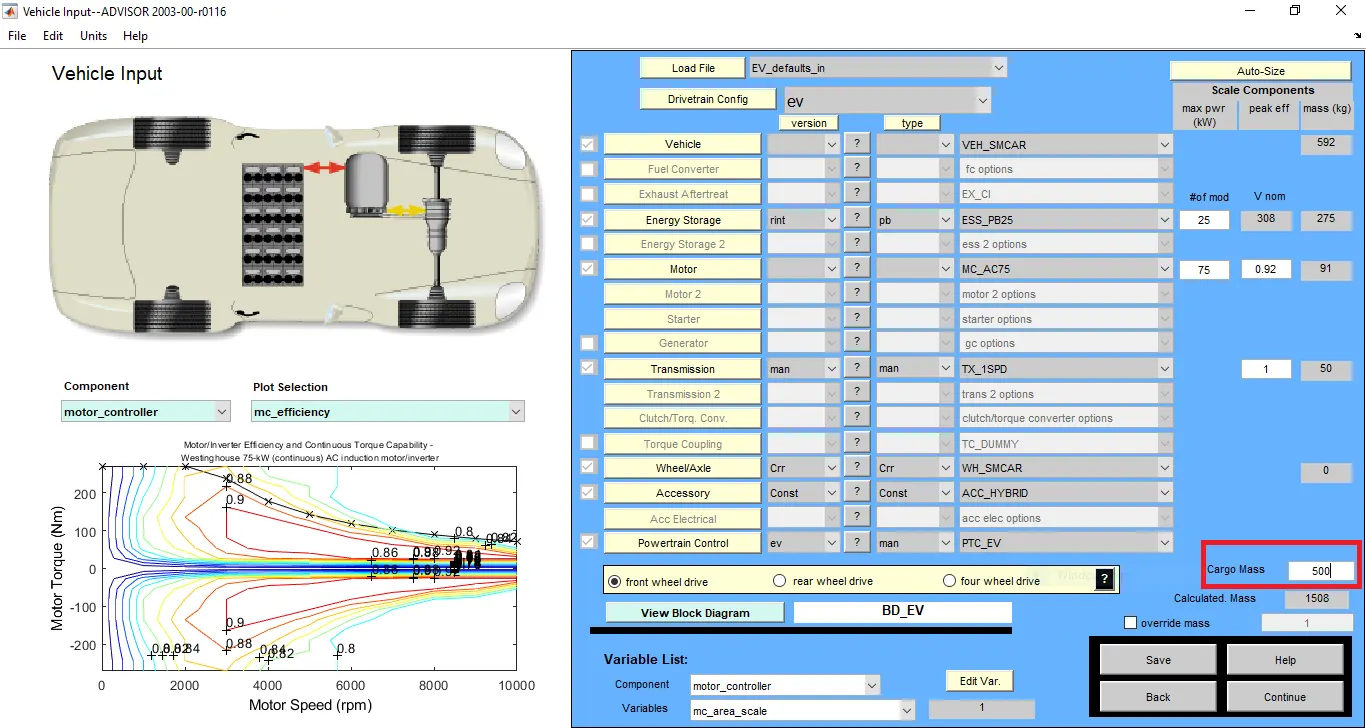
The cargo mass is changed to 500 kg from the default value of 136 kg,
- In Simulation Parameter window change drive cycle to CYC_FTP by selecting the drop-down menu.
- Below that we will see of cycles from here we can set our drive cycle.
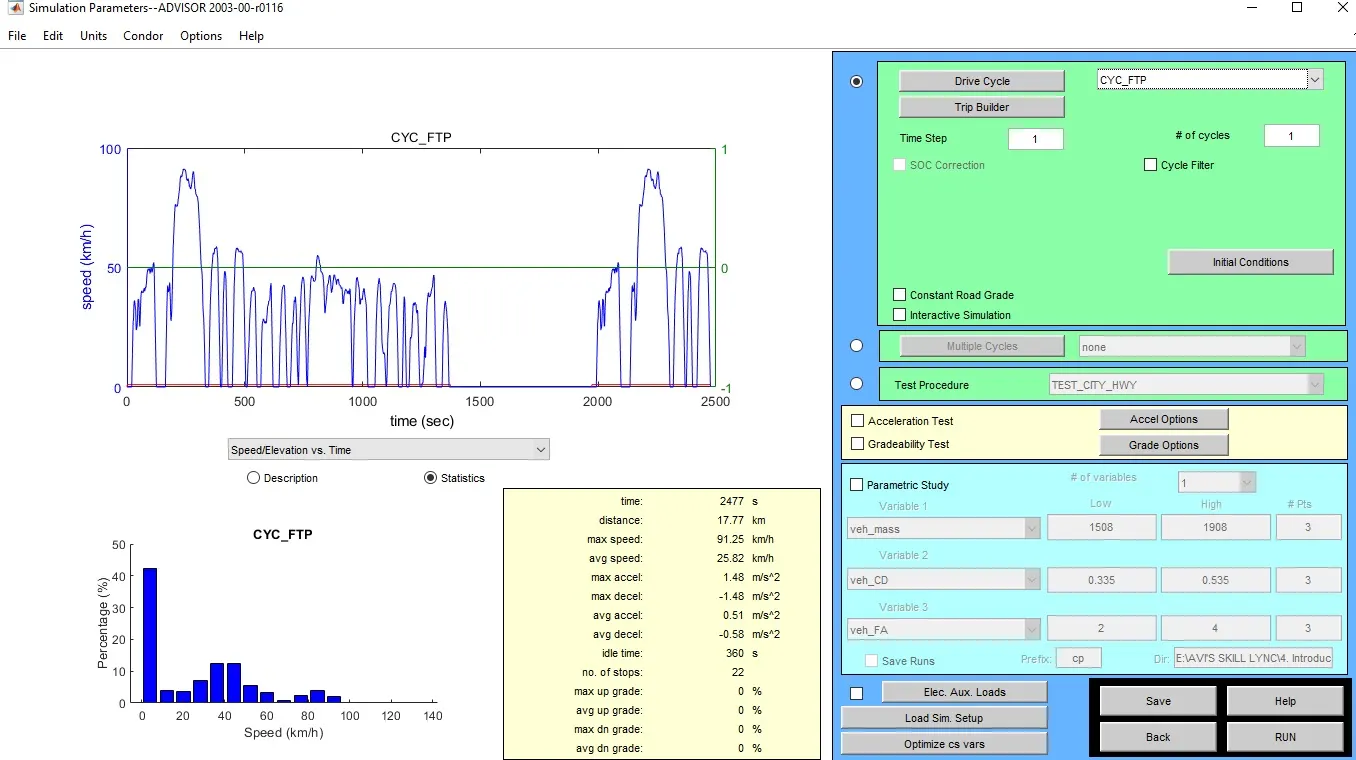
- After pressing the RUN button, the simulation will start and it will show results in a new window.
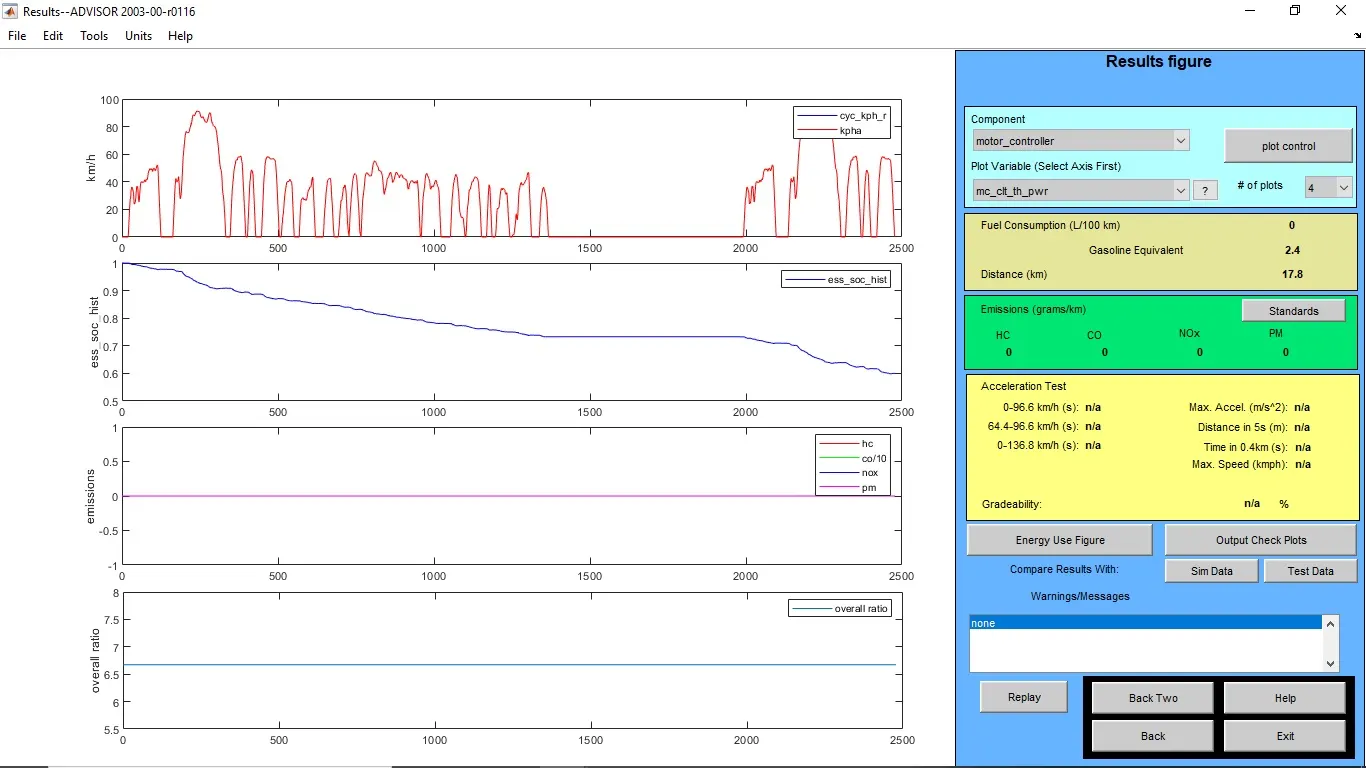
The distance traveled by the vehicle in 1 drive cycle is 17.8km. Used almost 40% SOC.
Increasing no. of drive cycles to 2.
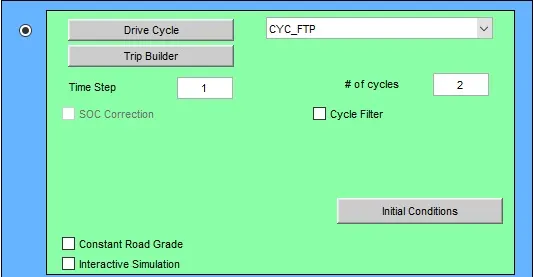
Result with 2 drive cycles.
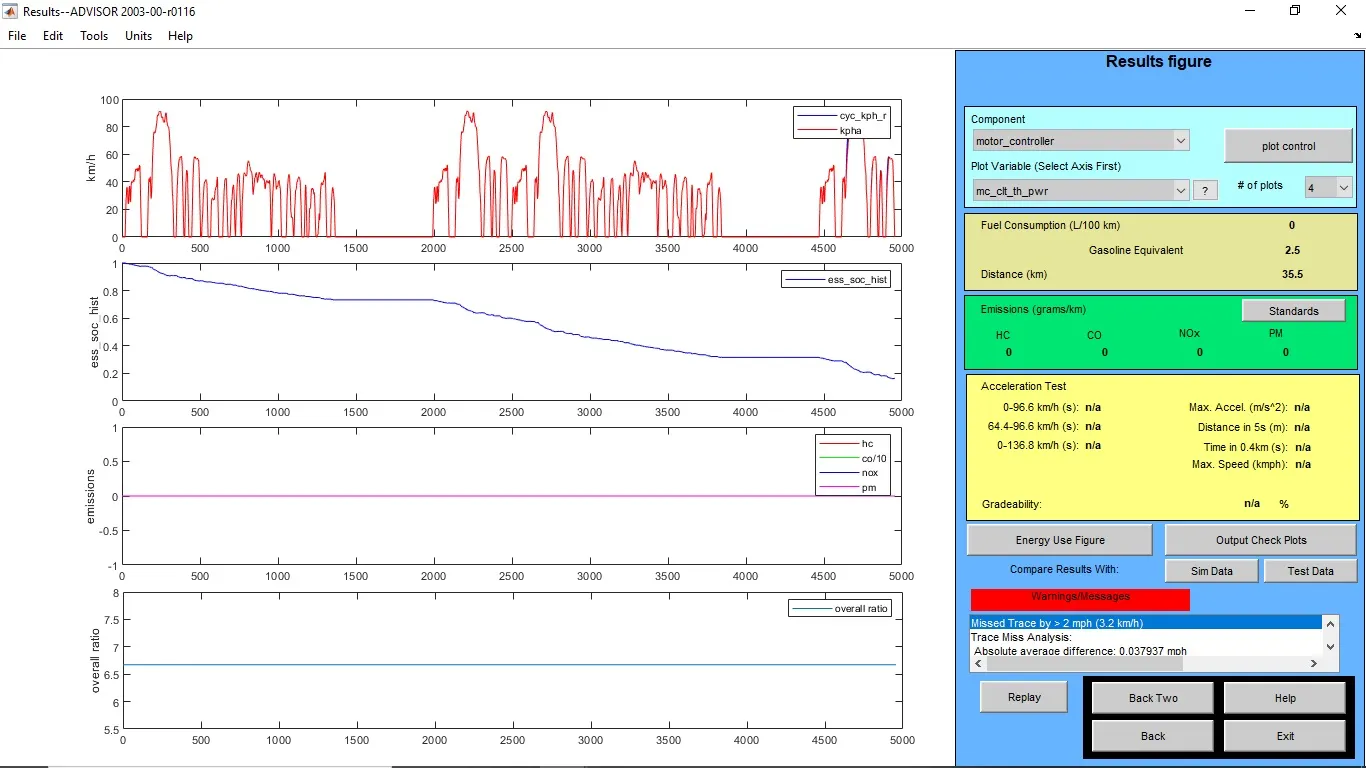
The distance traveled by the vehicle in 2 drive cycles is 35.5km. Used almost 81% SOC.
Increasing no. of drive cycles to 3.
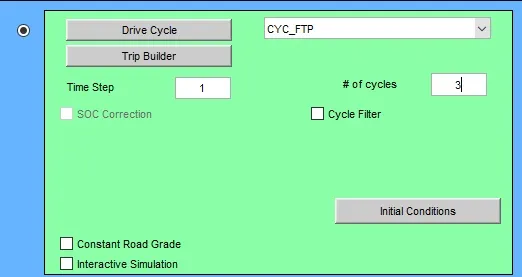
Result with 3 drive cycles.
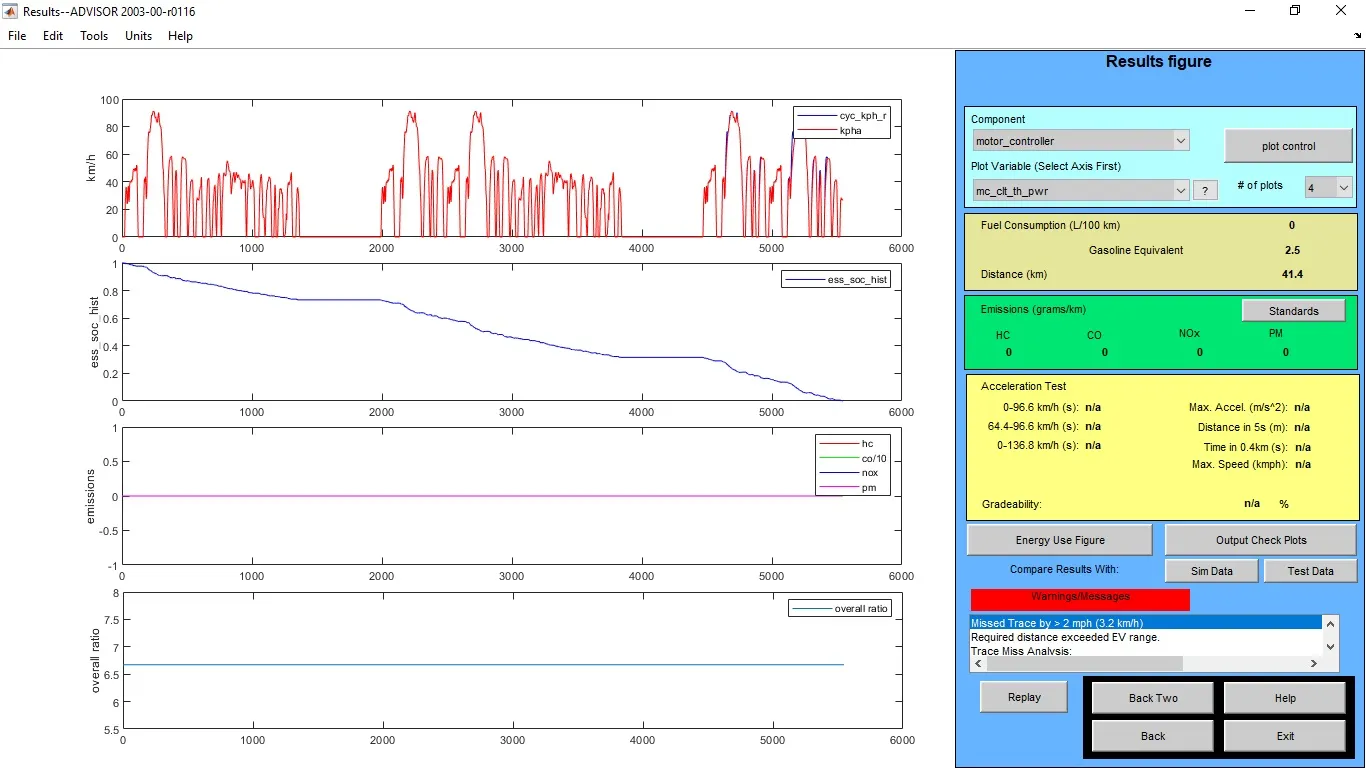
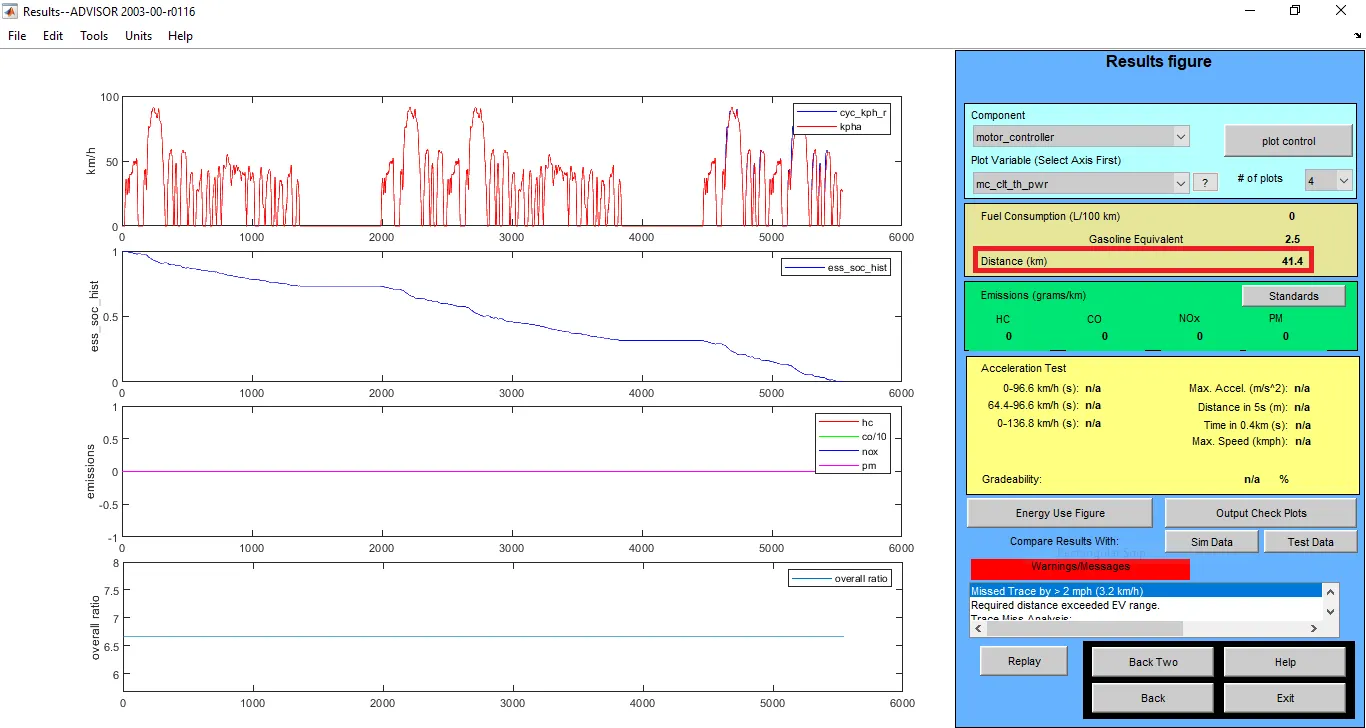
The distance traveled by the vehicle in 2 drive cycles is 41.4km. Used completely 100% SOC.
|
No. of Drive cycles |
Distance covered in kms |
|
1 |
17.8 |
|
2 |
35.5 |
|
3 |
41.4 |
The minimum distance travel by car is 17.8 km with drive cycle CYC_FTP – 1 whereas the maximum distance travel by car is 41.4 which consumes 100% of battery in 3 Drive cycles.
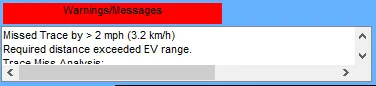
Warning,
CONCLUSION :-
From the simulation we can understand that the vehicle didn’t run for distance of 45.135 km and there is an error popping out that the required distance exceeded the EV range. So, in order to achieve the required distance we need to increase the battery capacity.
Q2. In the above case, try changing the battery capacity and repeat the simulation.
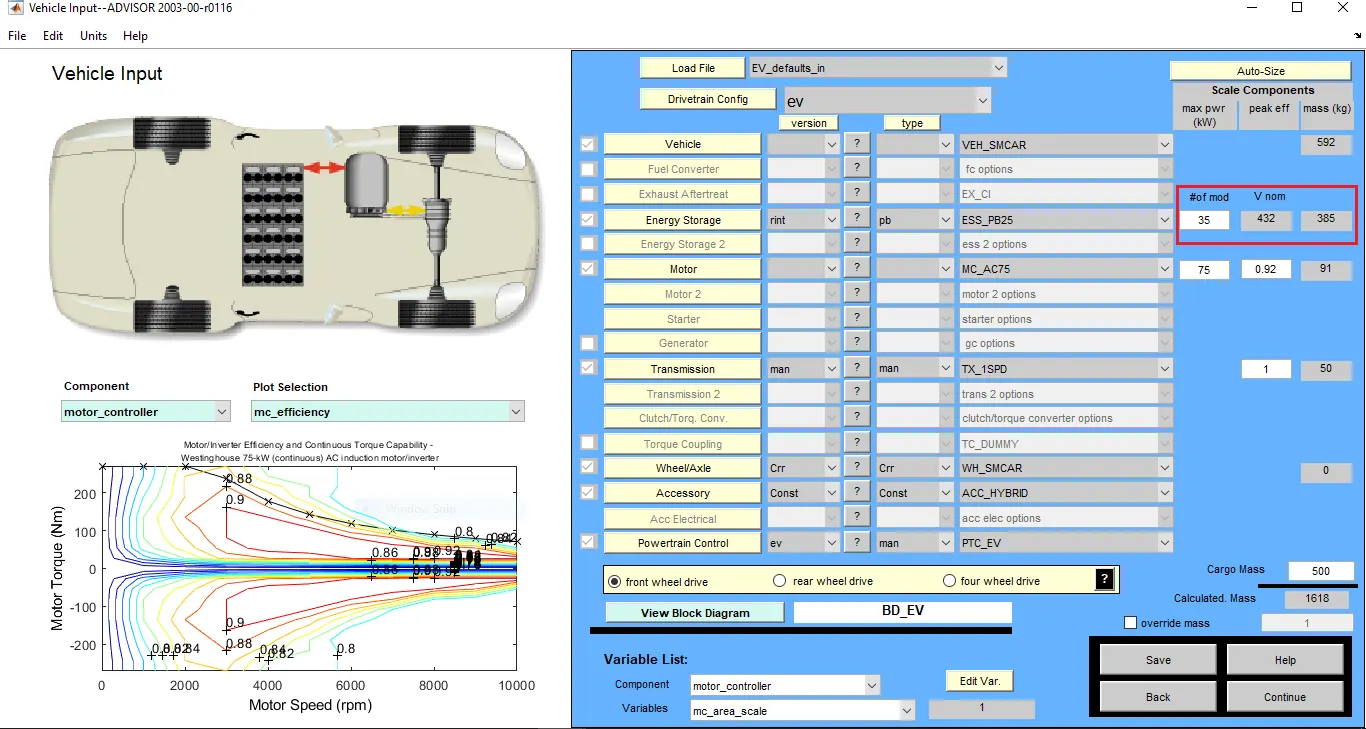
- In-Vehicle Input window we will change the capacity of battery form energy storage which will be open in 1st
- of mod V nom” describes the battery capacity, so we will change the module number of batteries from the first box and we will see that changes in voltage and weight of the battery.
A new Simulation Parameter window will open, here we will change the drive cycle to 2 or 3, one at the time and run the simulation.
- After completing of simulation, we will see the result window where we observe the change in distance of vehicle travel.
- We can repeat this simulation by changing the battery module and the drive cycle.
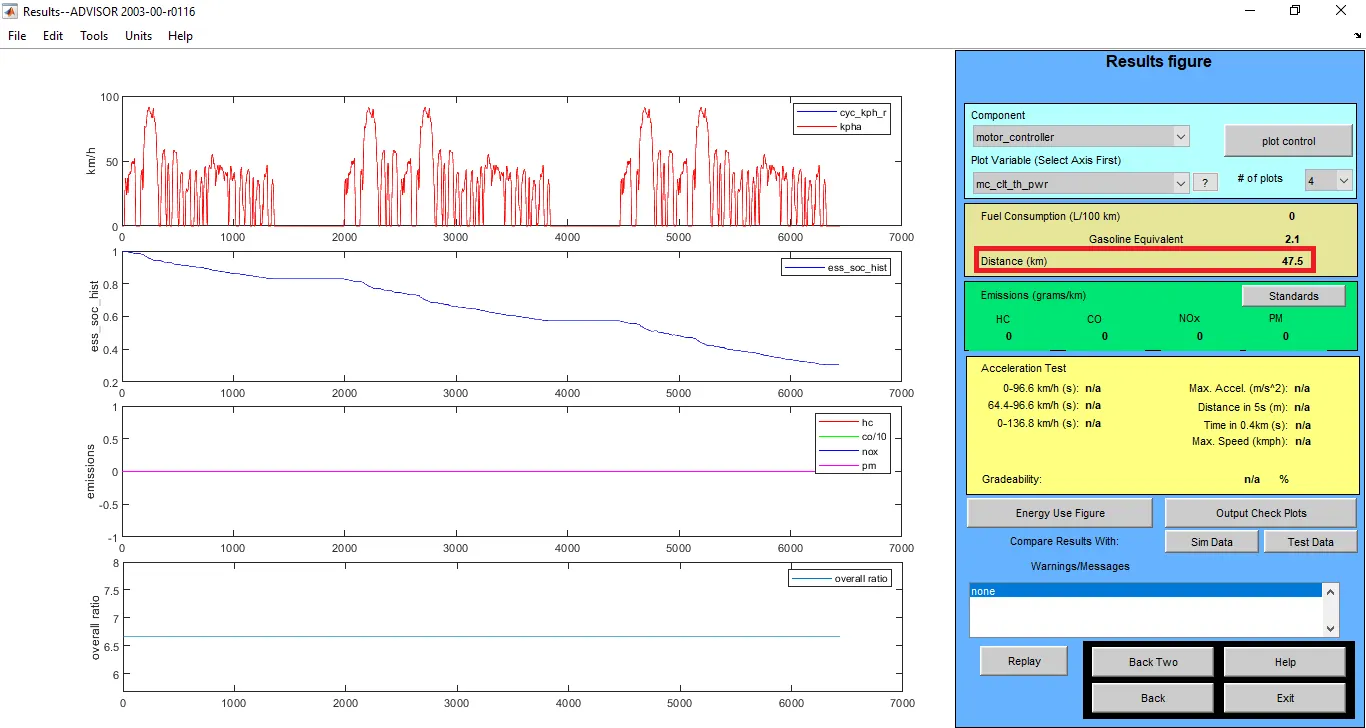
The battery module is being increased to give more power for further distance of the vehicle from 25 modules to 35 modules,
After increasing in the battery capacity the vehicle is able to run for the required distance,
CONCLUSION :-
-
From this simulation we can conclude that the required distance (45 Km) is being achieved by increasing the battery modules for extra power required to run the vehicle above 41.4 Km.
Q3. Perform gradeability test with PRIUS_Jpn_defaults_in file. Compare your results in the table and conclude.
3) Gradeability Test for Toyota Prius :-
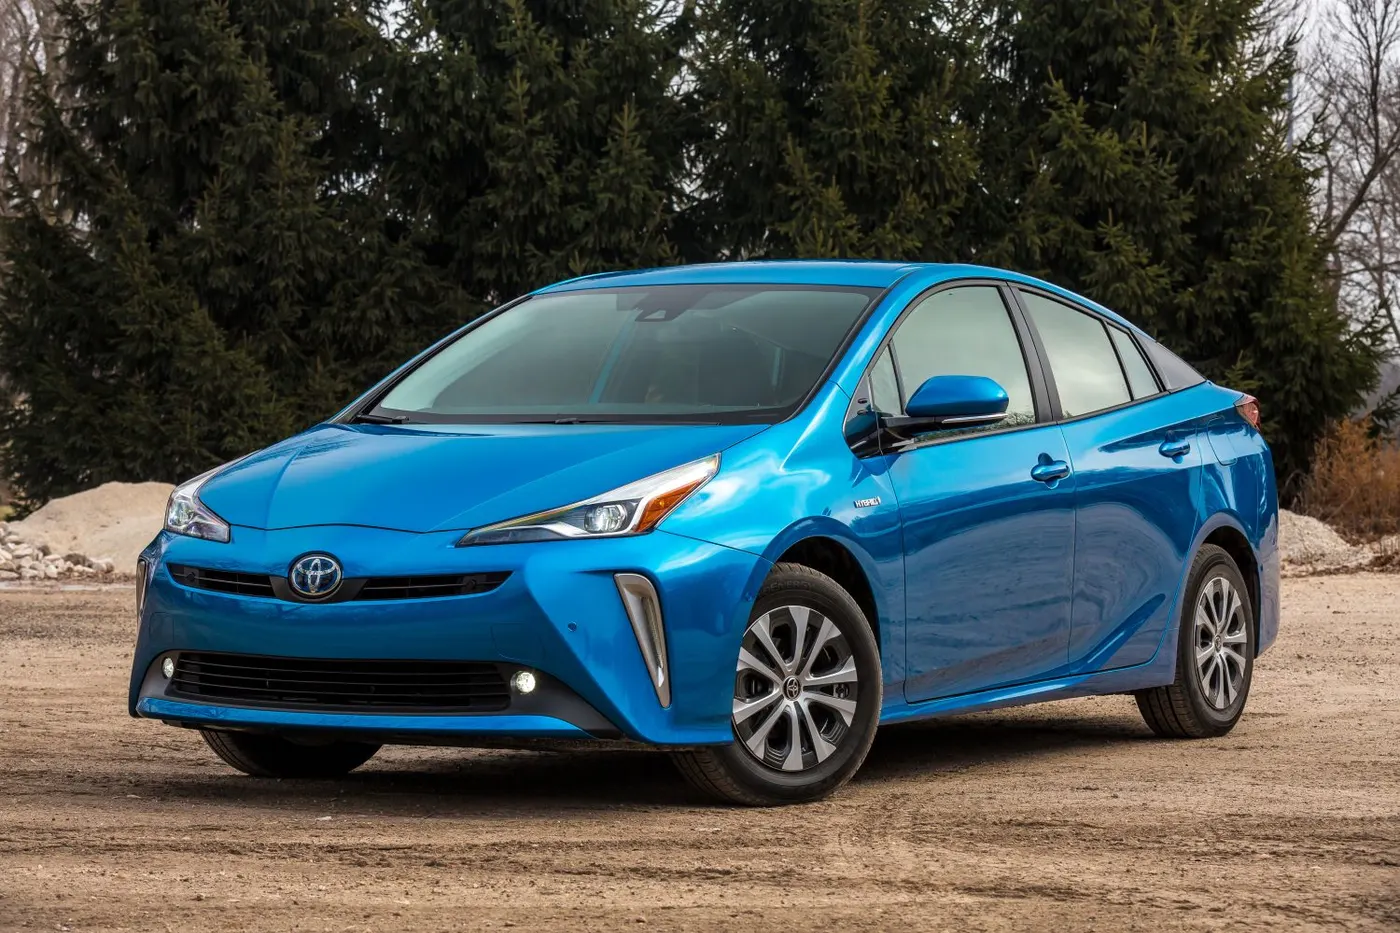
The Toyota Prius is Hybrid vehicle which has both IC (Internal Combustion and Motor) drive systems,
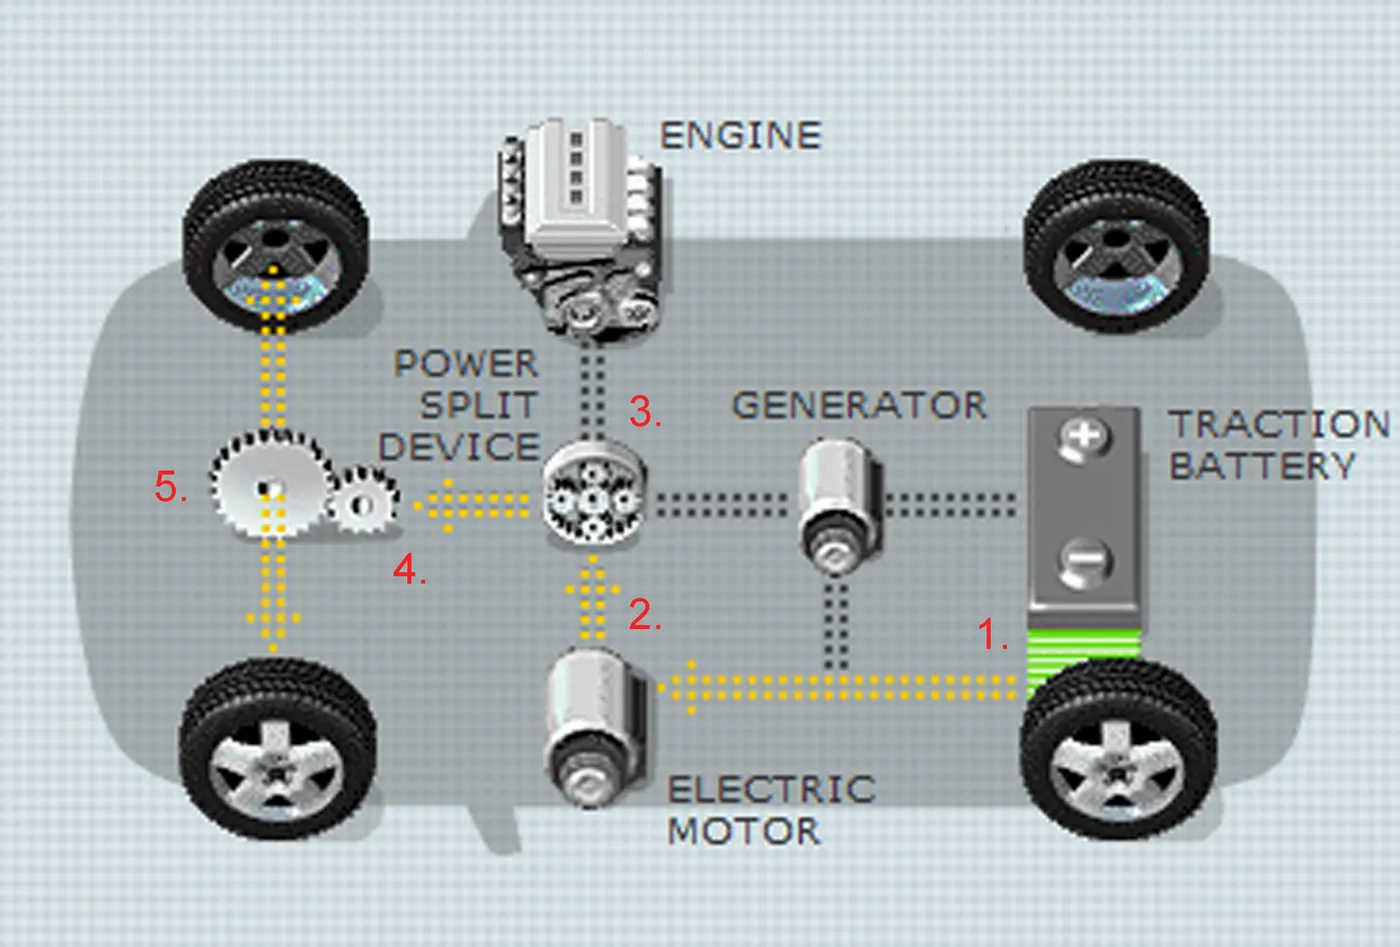
The gradeability test is being performed by increasing the speed of the vehicle for constant duration of 40 sec,
- In ADVISOR tool Vehicle Input window select PRIUS_Jpn_default model.
- Continue to the next window.
- Simulation Parameter window will open.
- Select the gradeability test and click on the grade Option box, a new dialogue box will open.
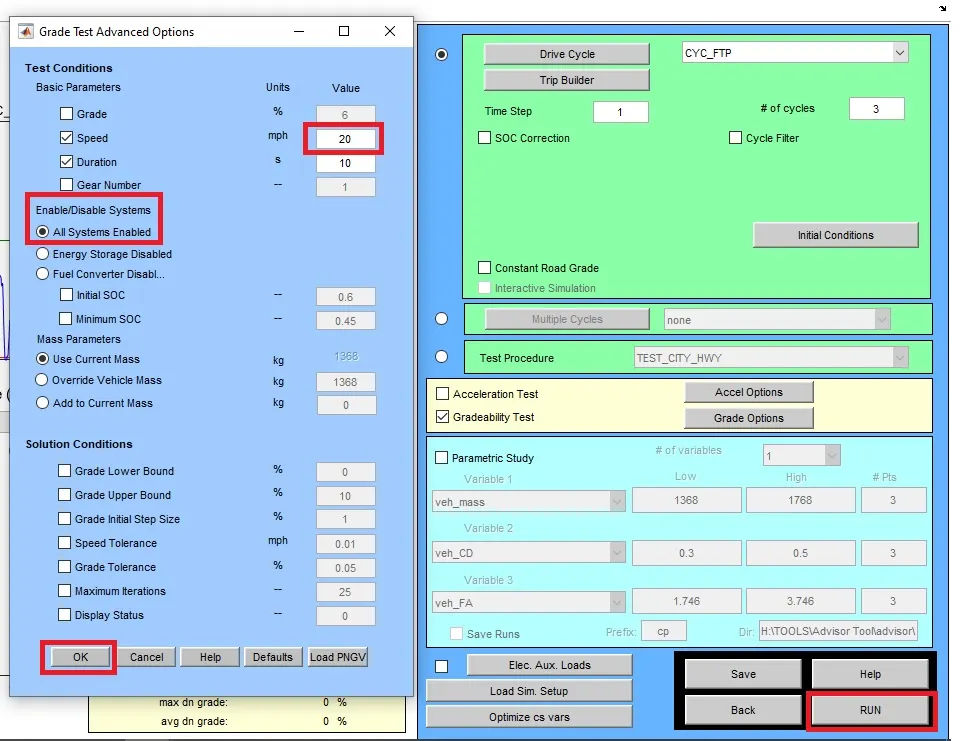
- In grade option box we can change speed or duration with respect to our simulation.
- So, for this simulation, I change speed one time and duration another time.
- Click on All system enabled.
- Also, click on constant road grade.
- Click Ok and run the simulation and a Result window will open showing different results depend upon input data.
Results for the duration - 10sec
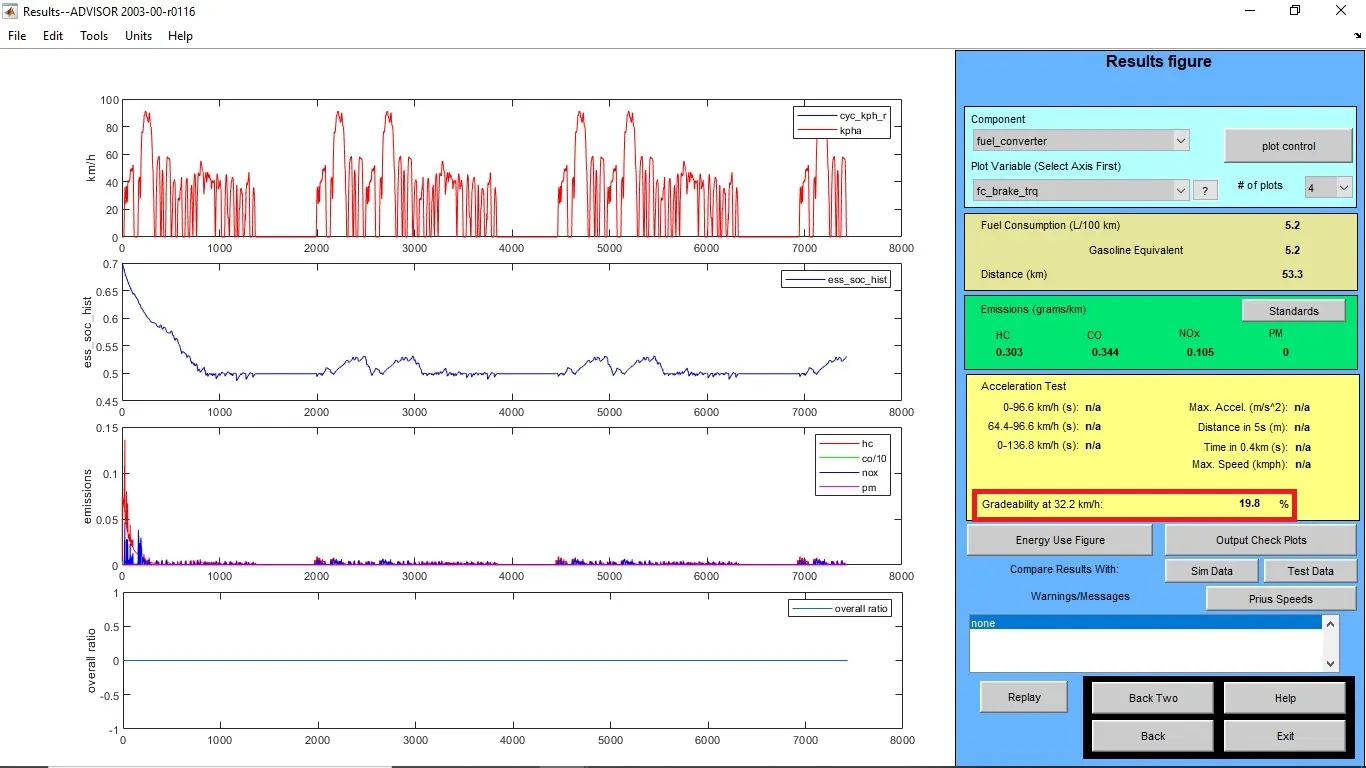
i) Speed - 20 miles/h or 32.2 kmph
Gradeability = 19.8%
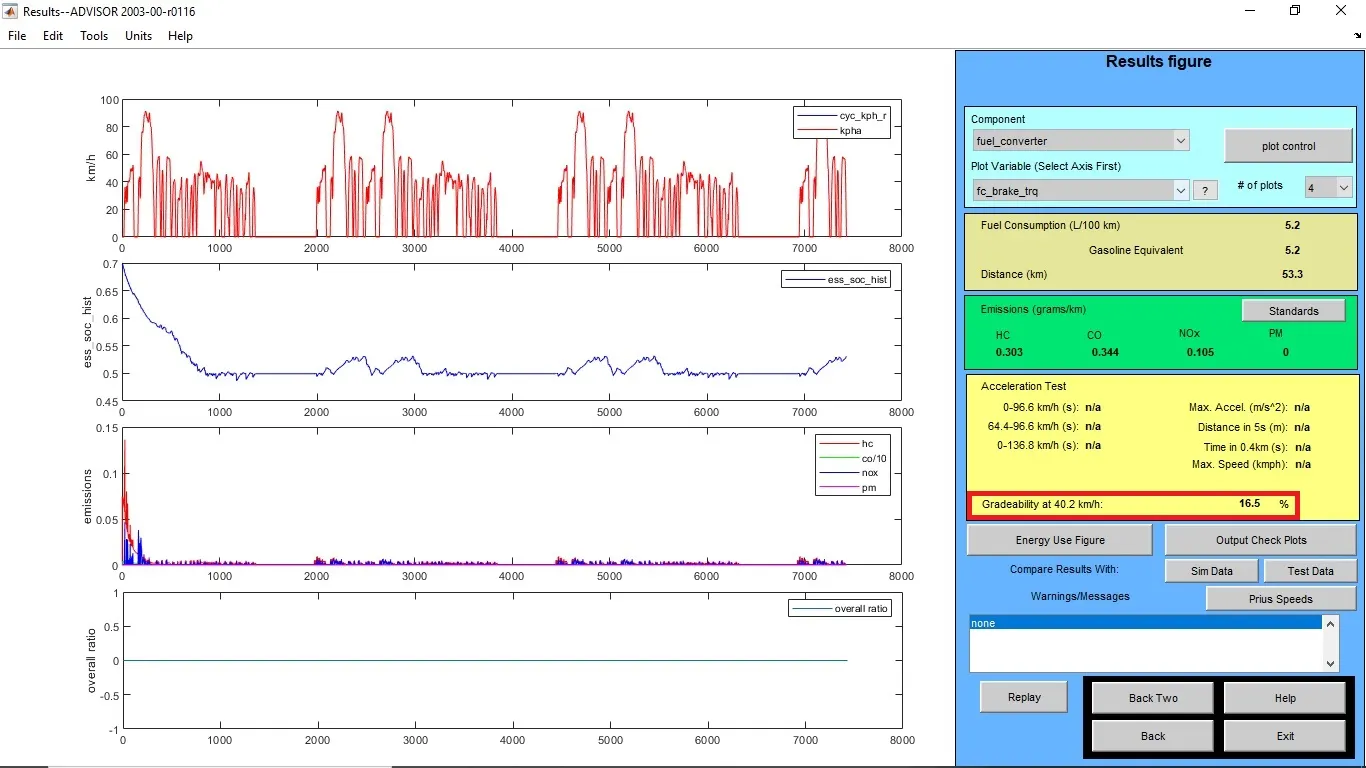
ii) Speed - 25 miles/h or 40.2 kmph
Gradeability = 16.5%
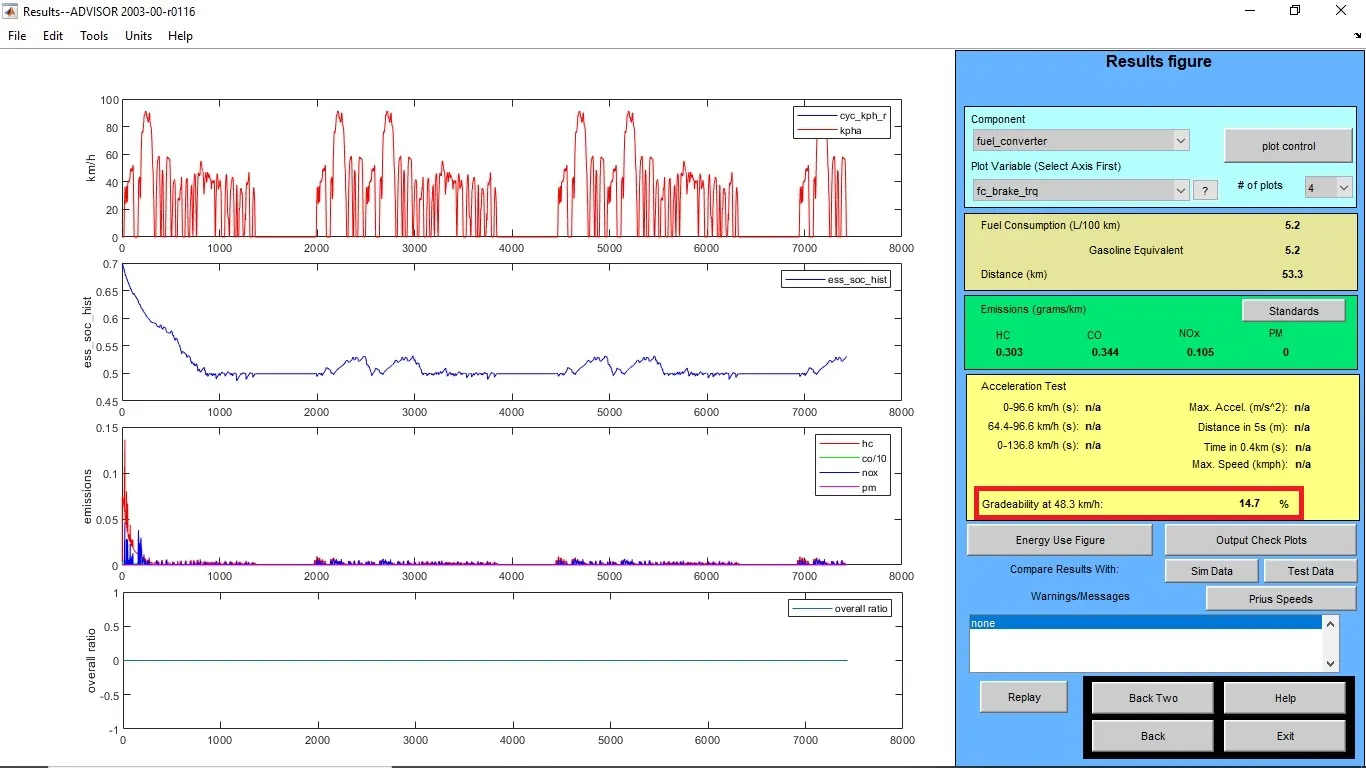
iii) Speed - 30 miles/h or 48.3 kmph
Gradeability = 14.7%
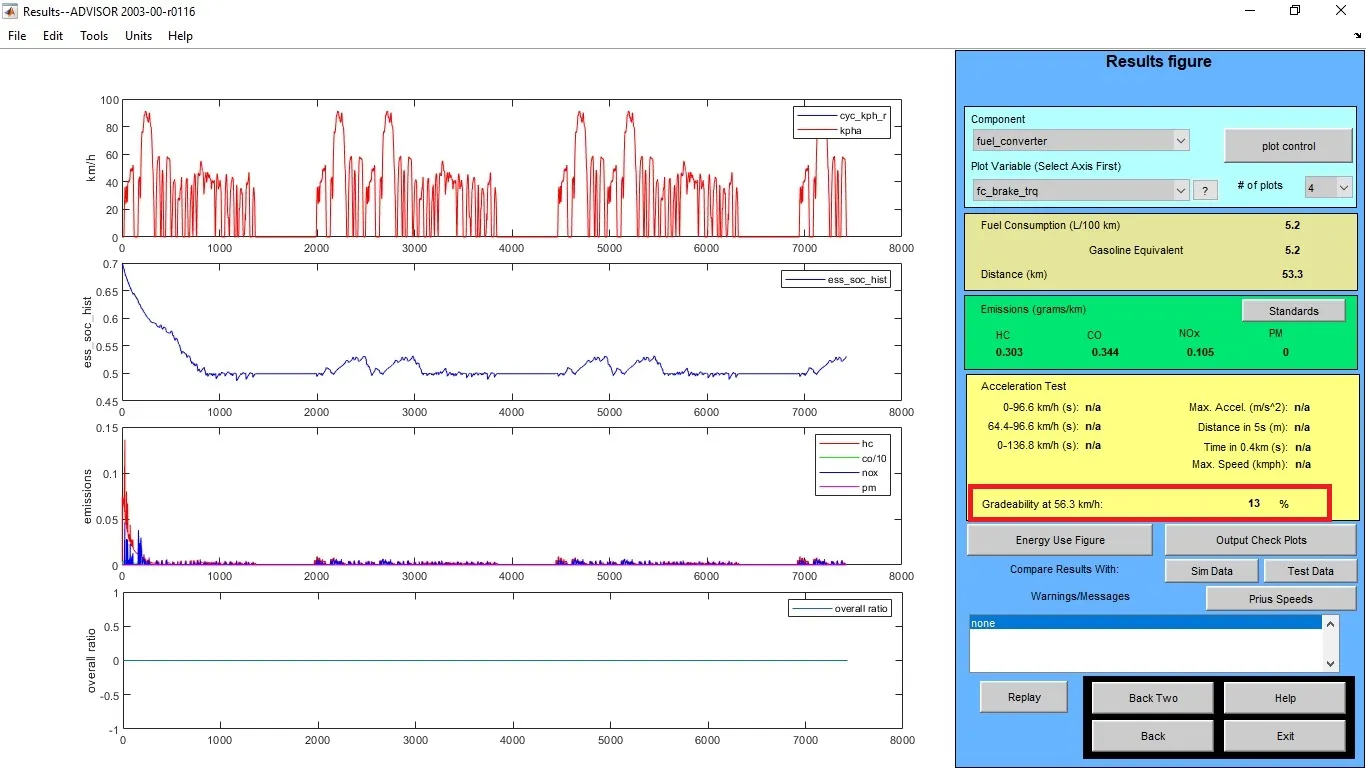
iv) Speed - 35 miles/h or 56.3 kmph
Gradeability = 13%
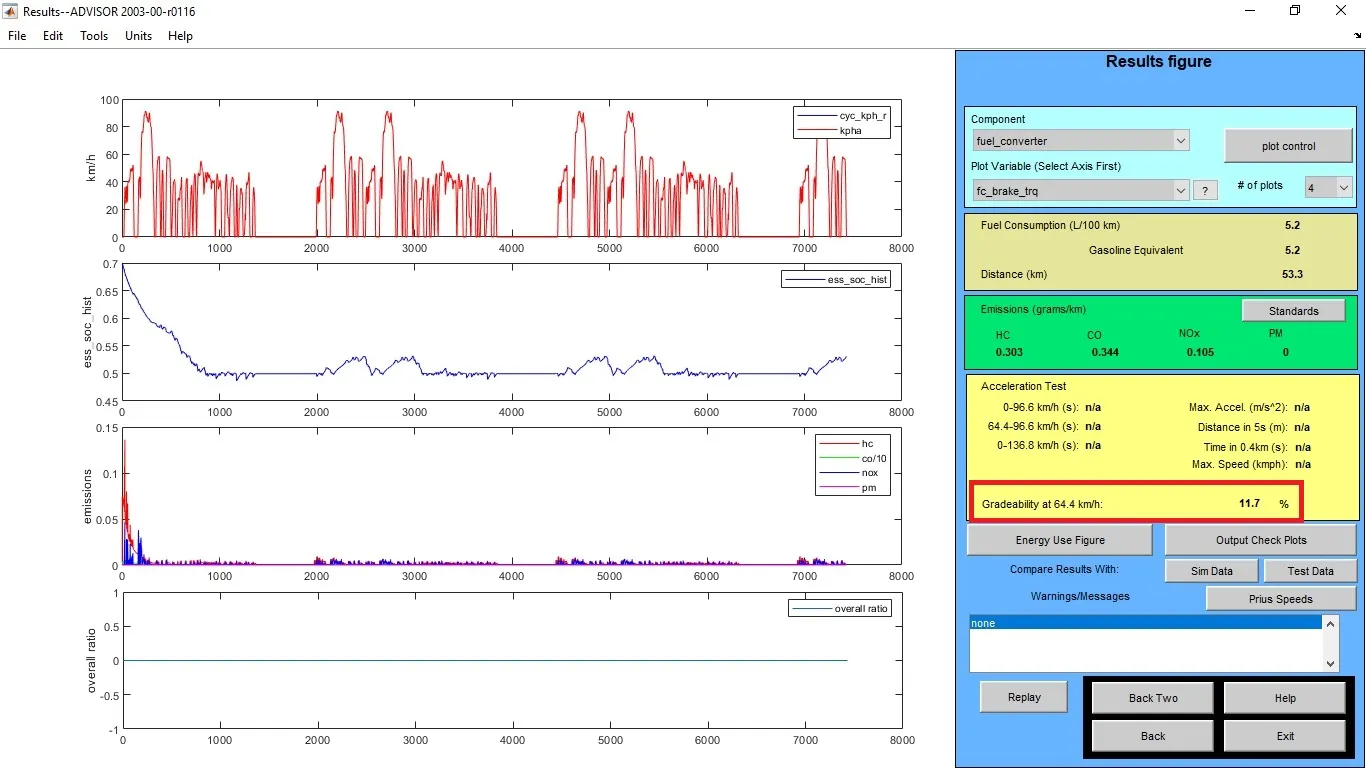
 v) Speed - 40 miles/h or 64.4 kmph
Gradeability = 11.7%
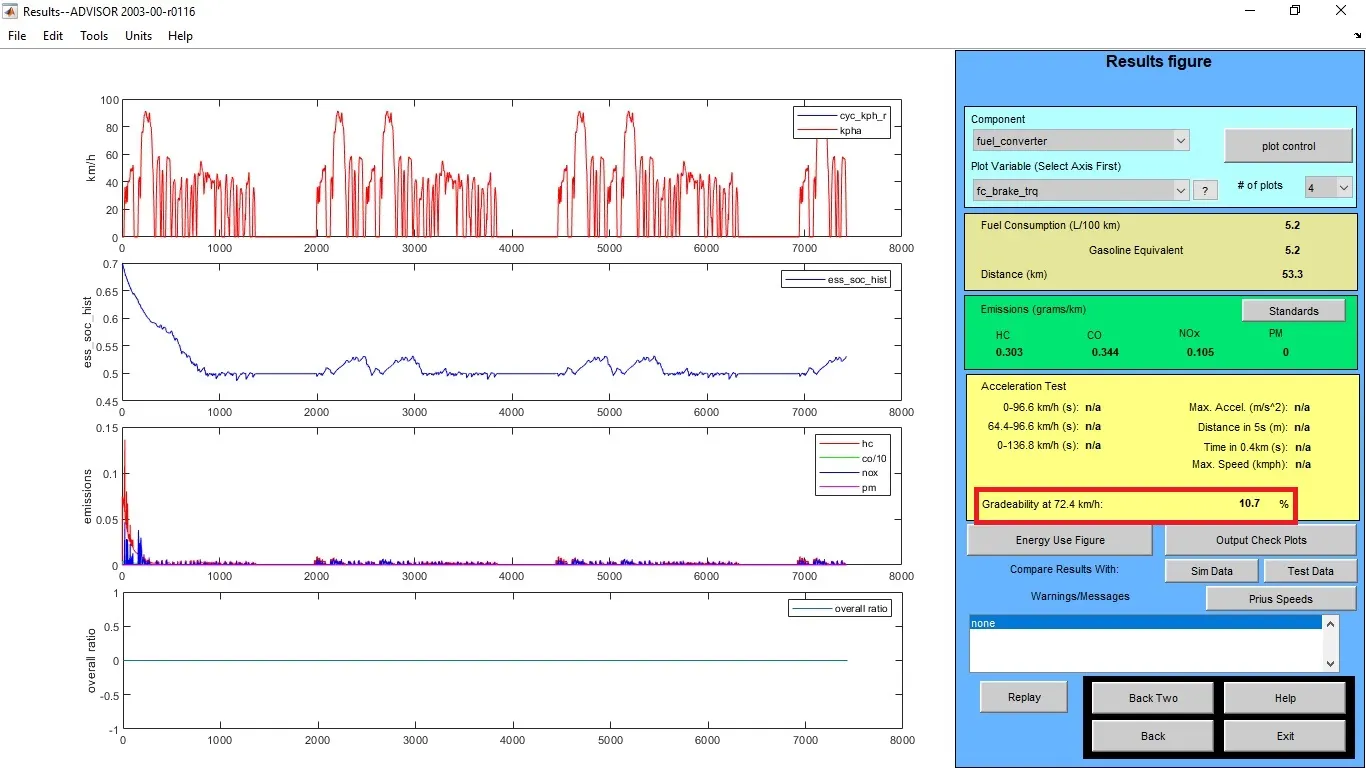
vi) Speed - 45 miles/h or 72.4 kmph
Gradeability = 10.7%
For duration - 10sec
S.No
Vehicle Speed mph
Vehicle Speed kmph
Gradeability %
1 20
32.2
19.8 %
2 25
40.2
16.5 %
3 30
48.3
14.7 %
4 35
56.3
13.0 %
5 40
64.4
11.7 %
6 45
72.4
10.7 %
Results for the duration - 20sec
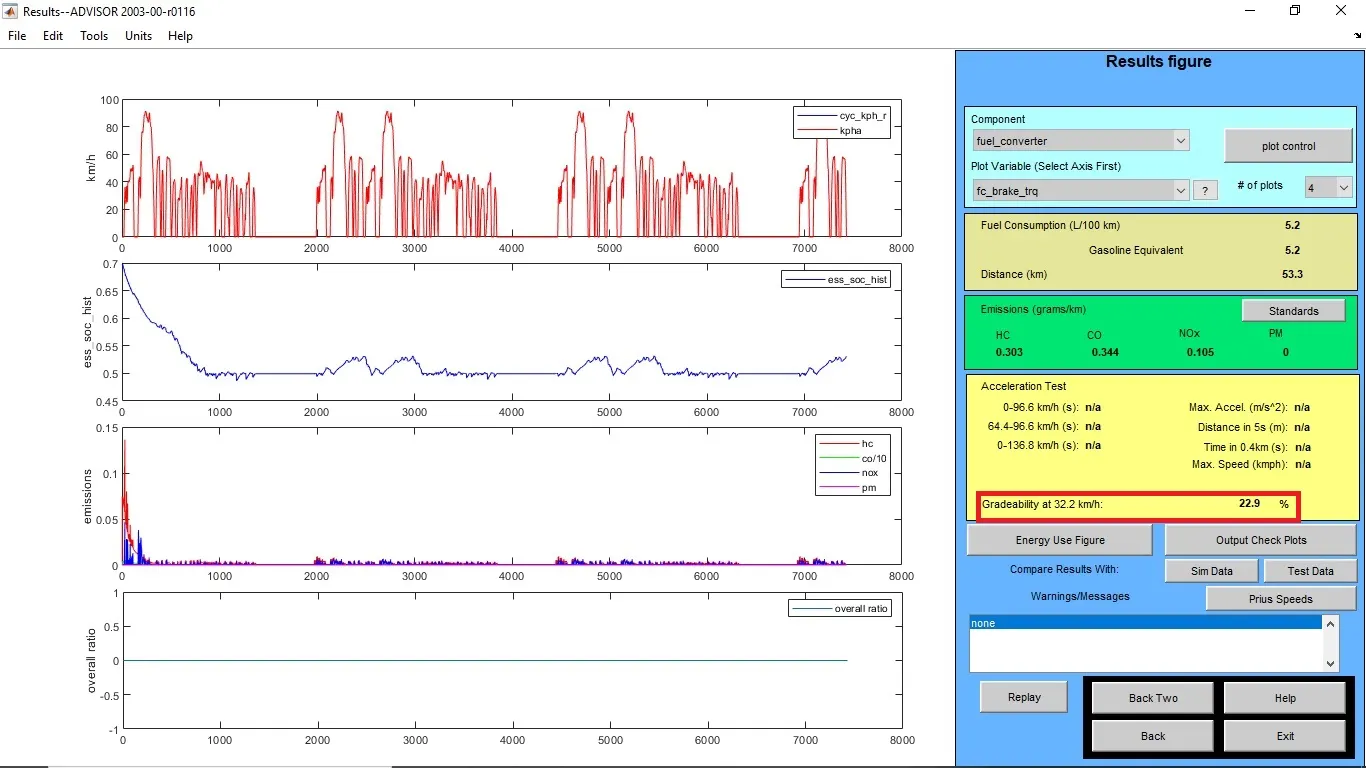
i) Speed - 20 miles/h or 32.2 kmph
Gradeability = 22.9%
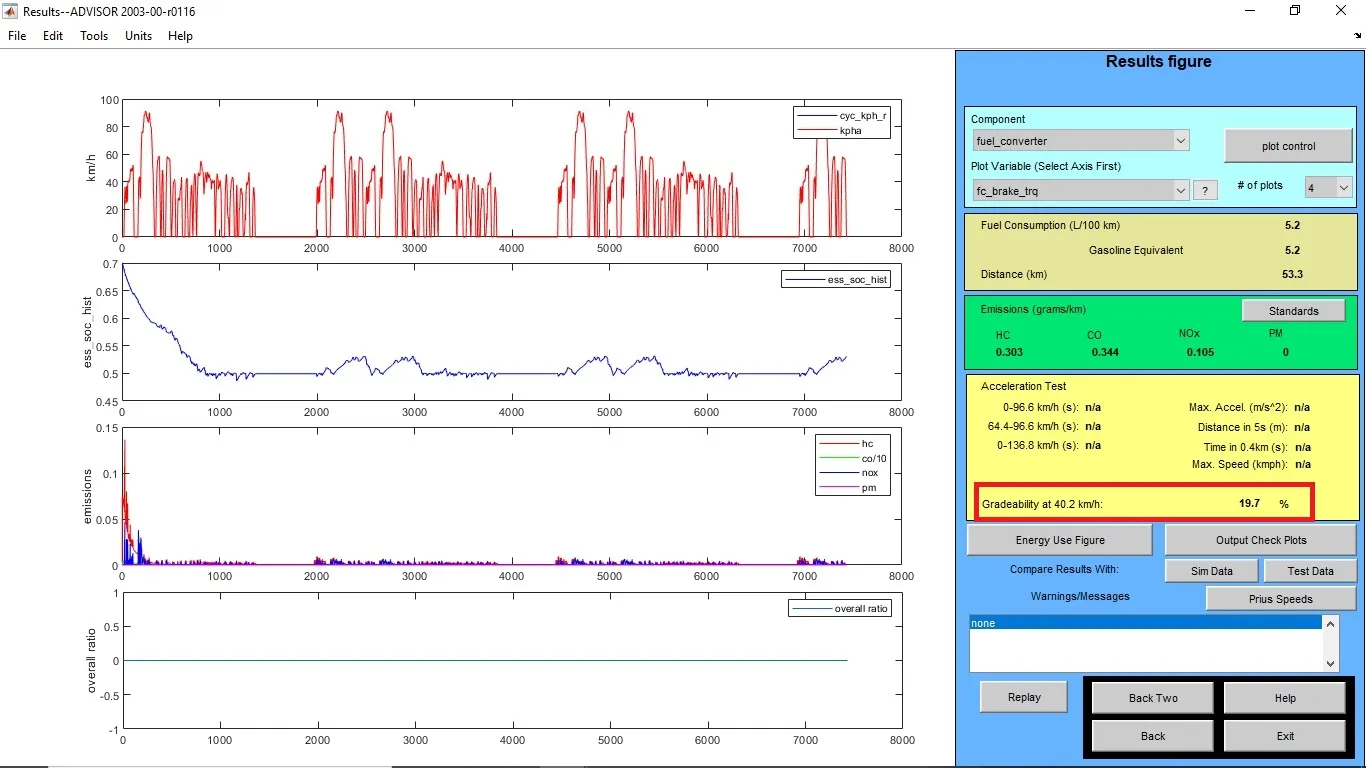
ii) Speed - 25 miles/h or 40.2 kmph
Gradeability = 19.7%
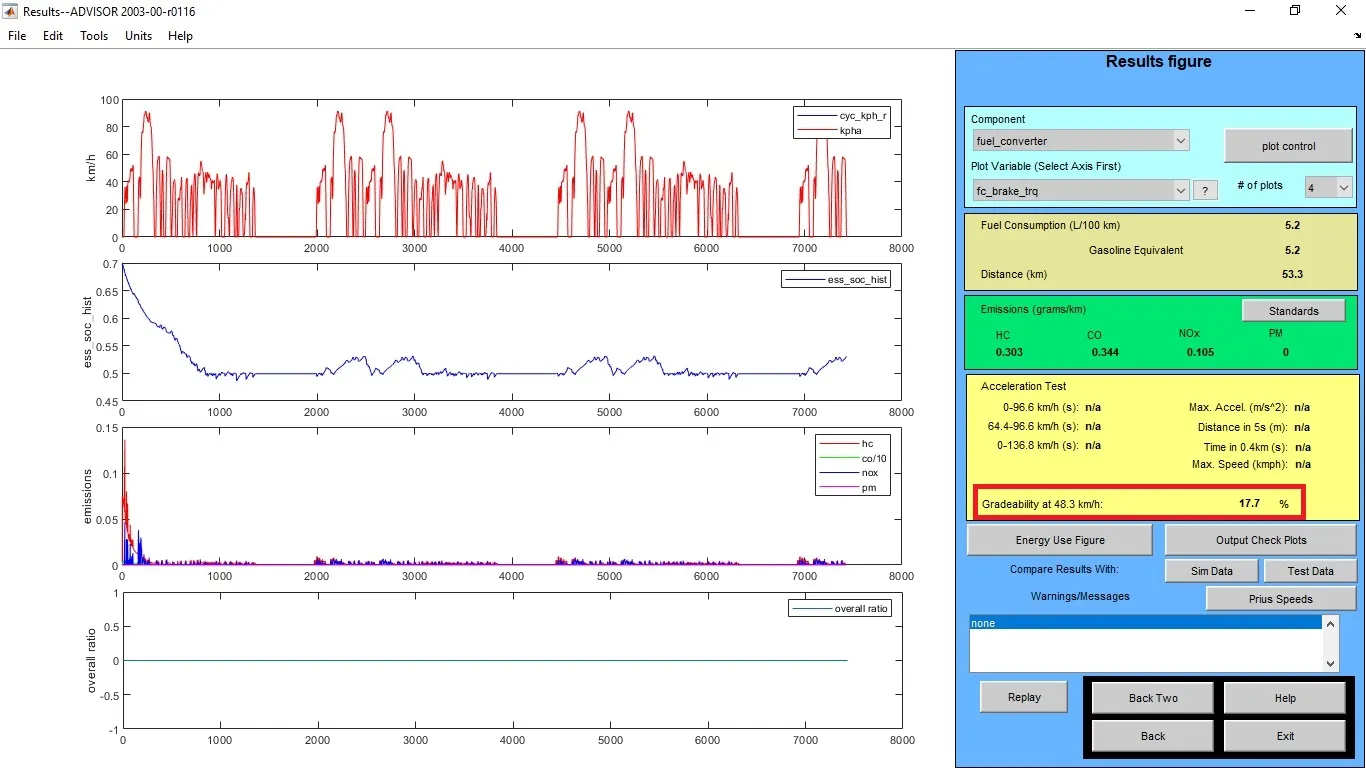
iii) Speed - 30 miles/h or 48.3 kmph
Gradeability = 17.7%
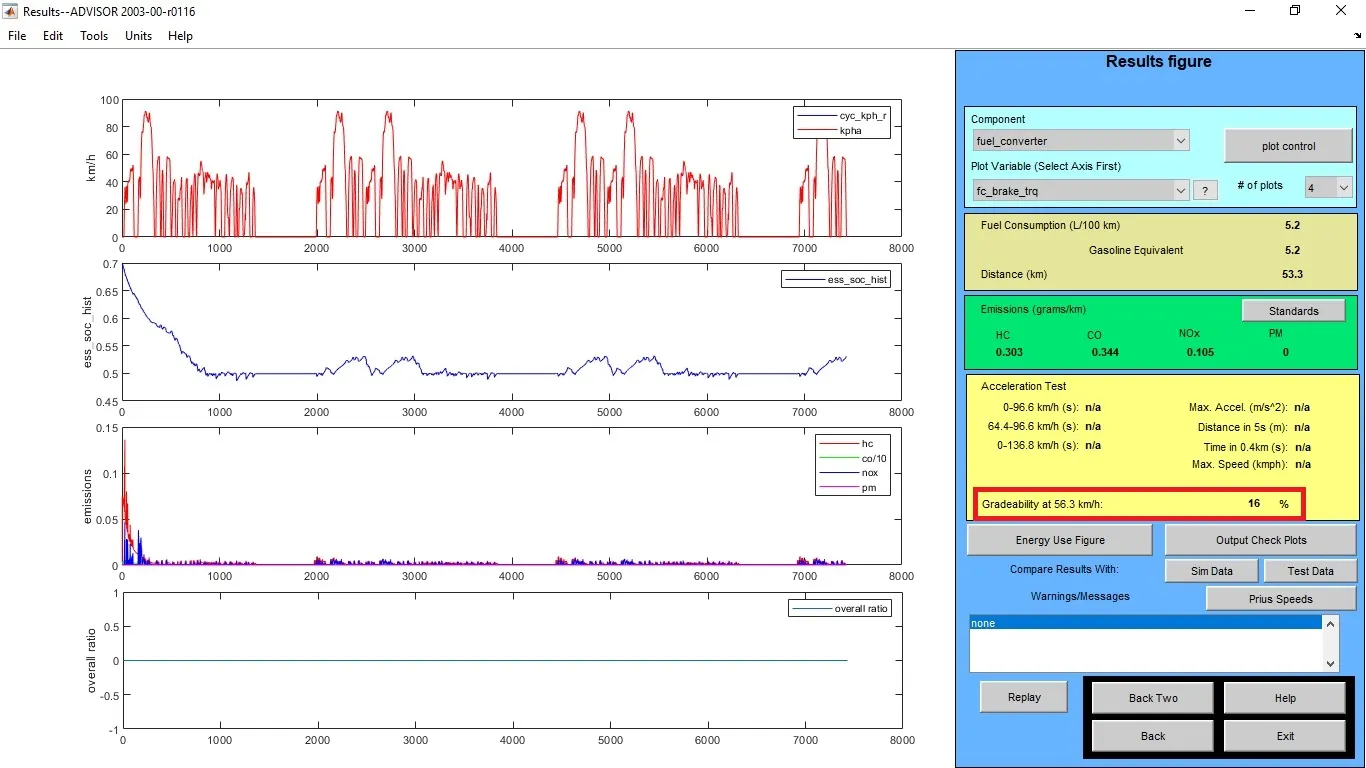
iv) Speed - 35 miles/h or 56.3 kmph
Gradeability = 16%
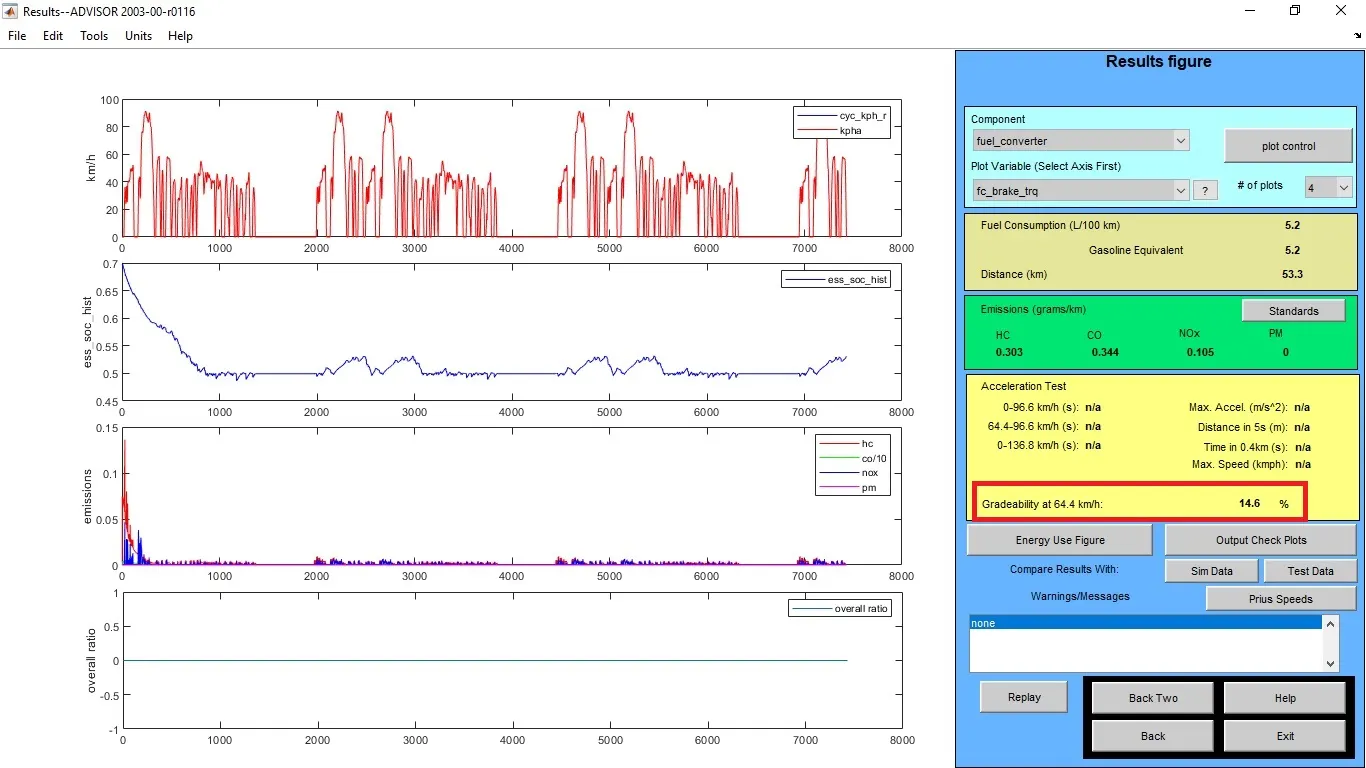
v) Speed - 40 miles/h or 64.4 kmph
Gradeability = 14.6%
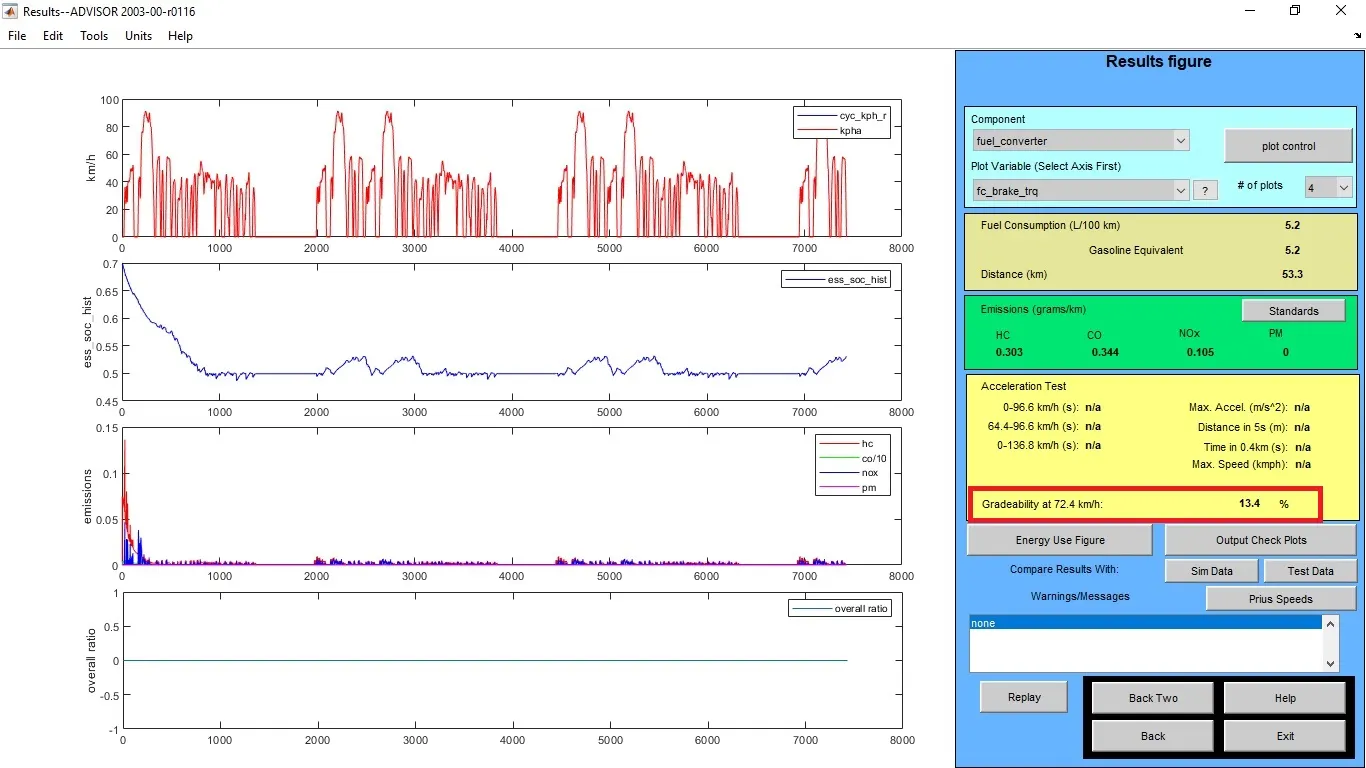
vi) Speed - 45 miles/h or 72.4 kmph
Gradeability = 13.4%
For Duration - 20sec
S.No
Vehicle Speed mph
Vehicle Speed kmph
Gradeability %
1 20
32.2
22.9 %
2 25
40.2
19.7 %
3 30
48.3
17.7 %
4 35
56.3
16.0 %
5 40
64.4
14.6 %
6 45
72.4
13.4 %
From the above tables, it can be seen that when vehicle speed increases there is a decrease in gradeability for both 10sec and 20sec duration. when vehicle speed increases there is a decrease in gradeability.