Week-3 Challenge: ADVISOR Tool
ADvanced VehIcle SimulatOR (ADVISOR):
One of the most widely used computer simulation tools for HEVs is the ADvanced VehIcle SimulatOR (ADVISOR) developed by the National Renewable Energy Laboratory. This program is flexible enough to operate on most platforms in the popular MATLAB/SIMULINK programming environment. The structure of ADVISOR makes it ideal for interchanging a variety of components, vehicle configurations, and control strategies. Its modern graphical user interface allows for easy manipulation of various inputs and outputs. Also, the capability to quickly perform parametric and sensitivity studies for specific vehicles is a unique and invaluable feature of ADVISOR.
However, no simulation tool is complete without being validated against measured vehicle data so as to ensure the reliability of its predictions. ADVISOR has been tested using data from a number of student-built HEVs from the top engineering colleges and universities around the country. As ADVISOR evolves to meet the changing needs of the vehicle design teams, this testing continues to ensure that ADVISOR maintains its usefulness as a simulation tool.
Benefit from using ADVISOR:
- estimate the fuel economy of vehicles that have not yet been built
- learn about how conventional, hybrid, or electric vehicles use (and lose) energy throughout their drivetrains
- compare relative tailpipe emissions produced on a number of cycles
- evaluate an energy management strategy for your hybrid vehicle’s fuel converter
- optimize the gear ratios in your transmission to minimize fuel use or maximize performance, etc.
The models in ADVISOR are:
- mostly empirical, relying on drivetrain component input/output relationships measured in the laboratory, and
- quasi-static, using data collected in steady state (for example, constant torque and speed) tests and correcting them for transient effects such as the rotational inertia of drivetrain components.
Use ADVISOR tool and simulate the following
Que1. For EV_defaults_in file, if cargo mass is 500 kg with all other default conditions, can the vehicle travel for 45 km with FTP drive cycle? Conclude your observations.
Ans:
A)For EV_defaults_in file, cargo mass is 500 kg with all other default conditions:
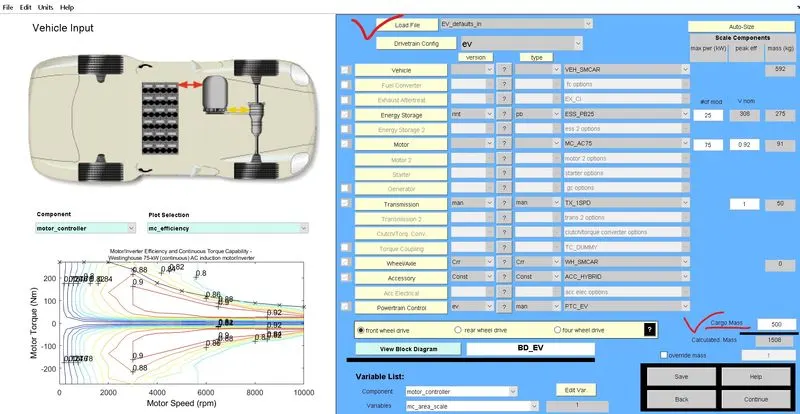
Then click on -> Continue.
B)the vehicle travel for 45 km with FTP drive cycle:
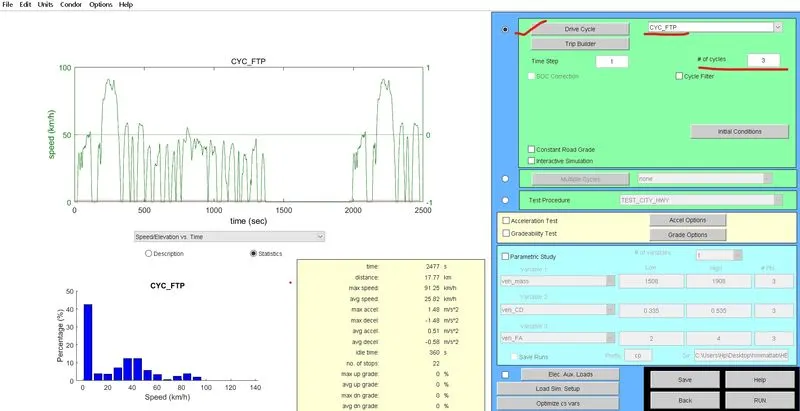
After that Click on -> Run.
Result Figure:
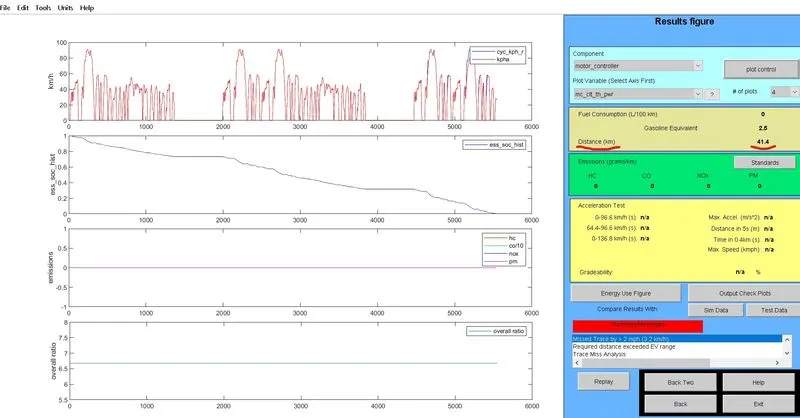
Conclusion:From above simulation it is observed that, if we select CYC_FTP drive cycle then vehicle can only drive upto 17.77km distance in one cycle, so we have taken/selected 3 no. of cycle then vehicle travels 41.4km distance & further increase in no. of cycle from 3 to 4, still no change observe in distance cover by vehicle , because battery get discharge completely.
2. In the above case, try changing the battery capacity and repeat the simulation.
Ans:
Changing the battery capacity:
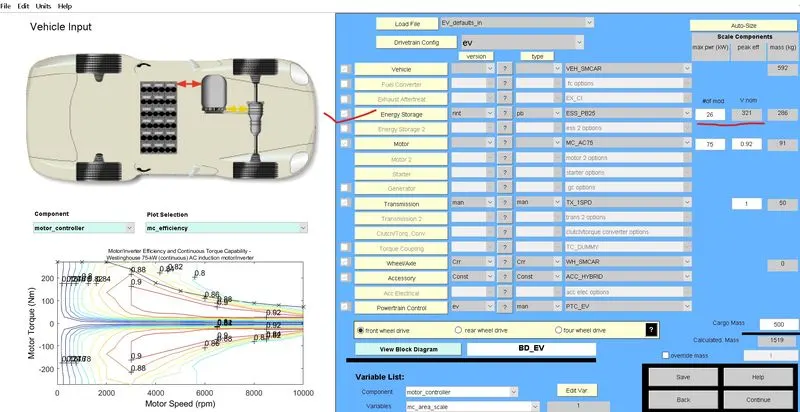
1)For 26 battery module the battery voltage becomes 321V.
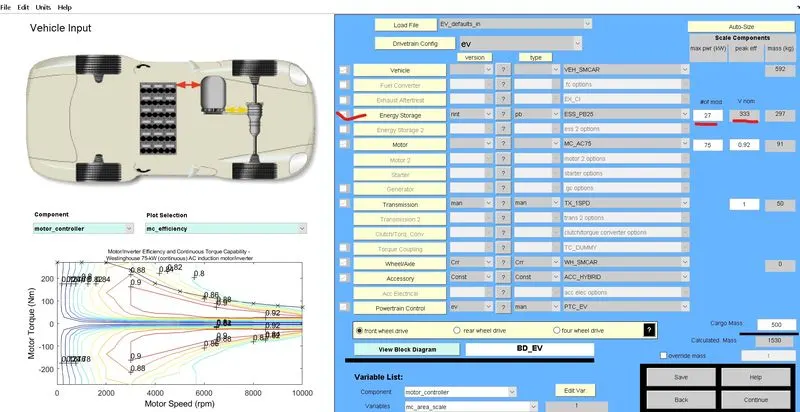
2)For 27 battery module the battery voltage becomes 333V.
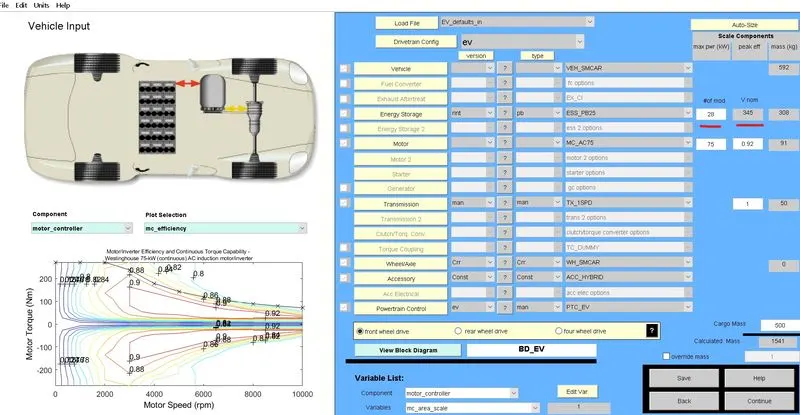
3)For 28 battery module the battery voltage becomes 345V.
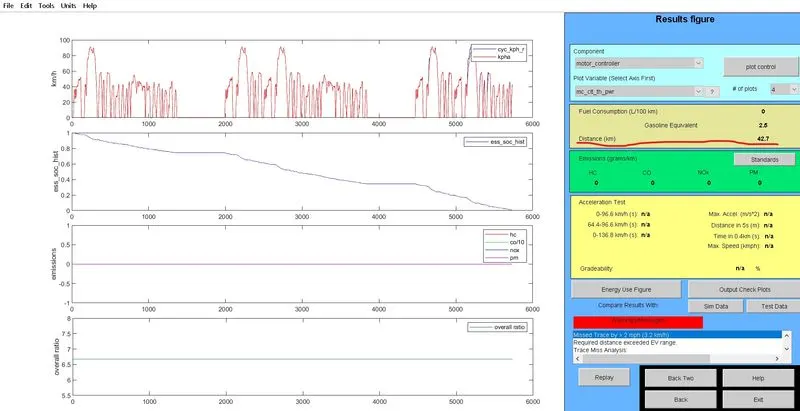
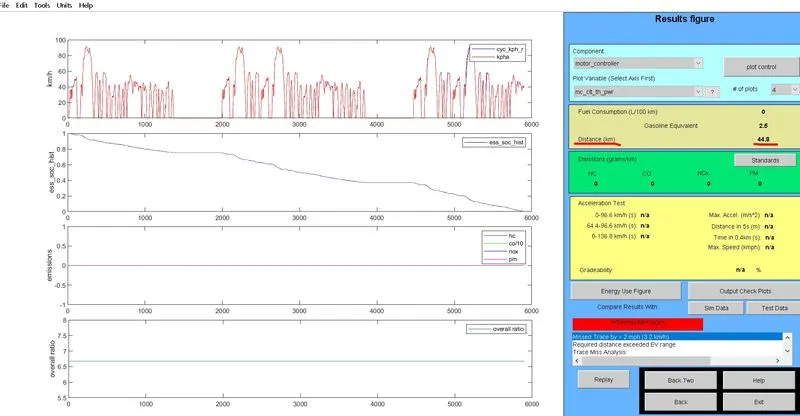
Result Figure: For the same drive cycle & no. of cycle i.e. CYC_FTP & 3 respectively.
1) For 26 battery module: Distance cover is 42.7km.
2) For 27 battery module: Distance cover is 44.8km.
3) For 28 battery module: Distance cover is 46.3km.
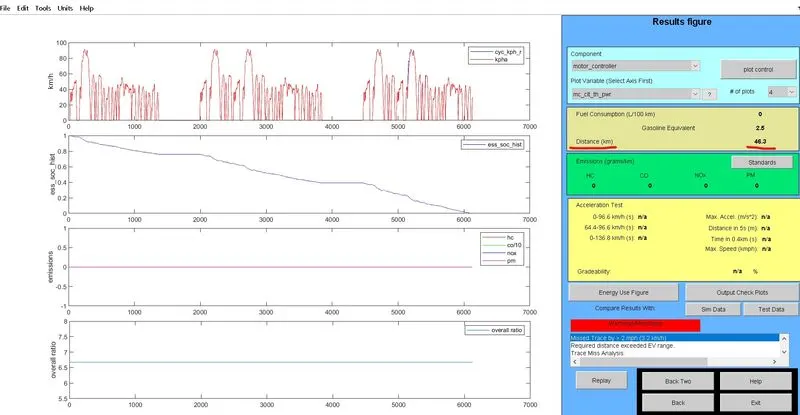
Conclusion:From above simulation it is observed that as we increase no. of battery module,the battery capacity increases, so by this, vehicle can cover more distance &vice versa.So from above data it is observed that to cover 45km distance, we need at least 28 battery module.
3. Perform gradeability test with PRIUS_Jpn_defaults_in file. Compare your results in table and conclude.
Ans:
Gradeability test with PRIUS_Jpn_defaults_in file:
Step1:
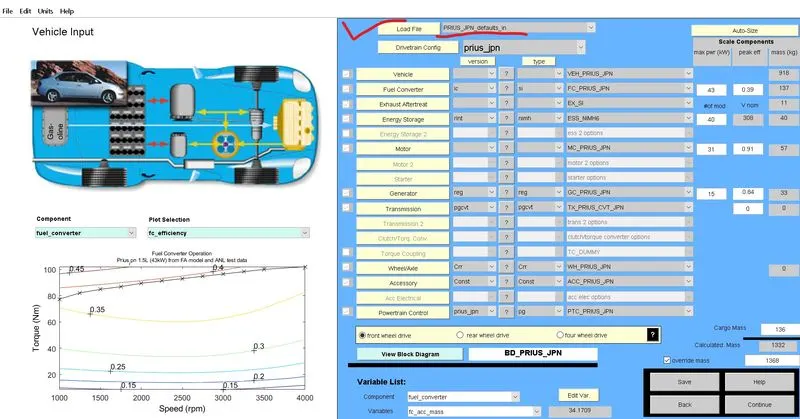
Then click on -> Continue.
Step2:
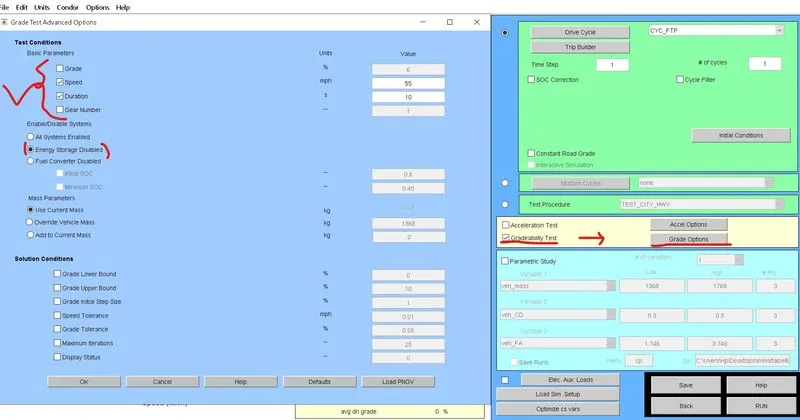
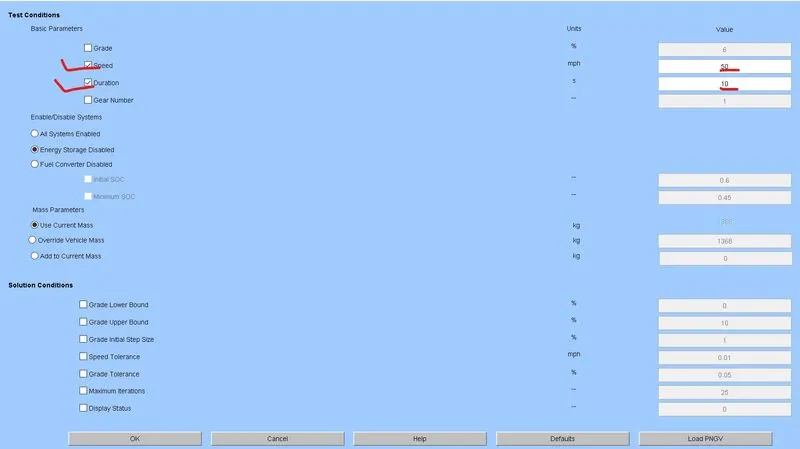
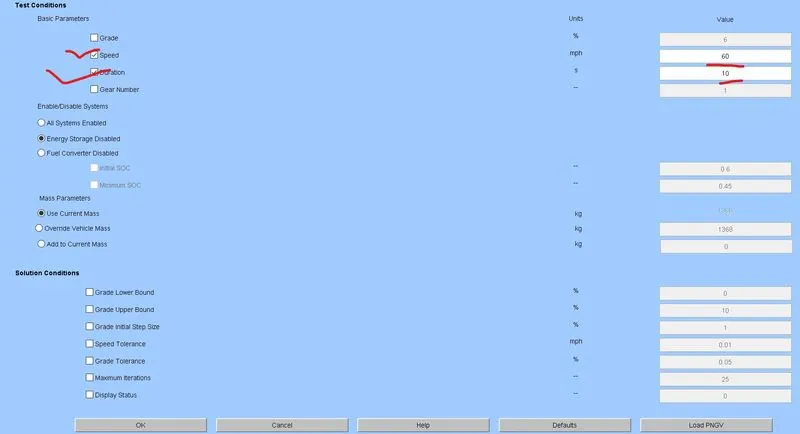
Select Cycle -> Click on -> Gradeability test -> Grade Options -> Test Condition -> Basic Parameters -> Select Speed & Duration -> ok -> Run.
Observations:
A) for 10 sec duration:
1)for 50mph speed:
Result fig:
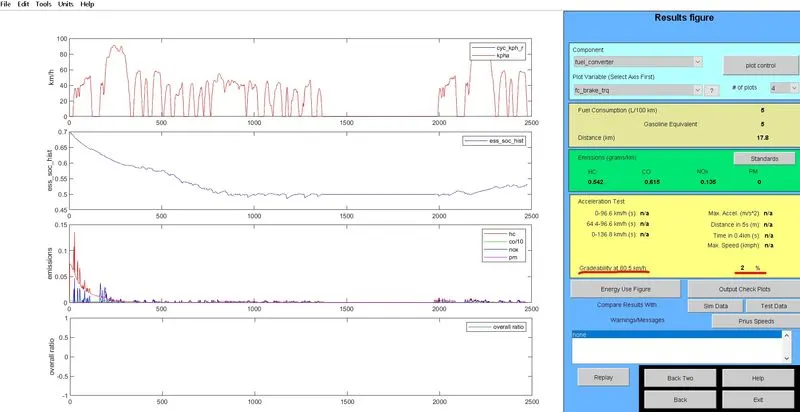
Gradeability found to be 2%.
2)For 60mph speed:
Result fig:
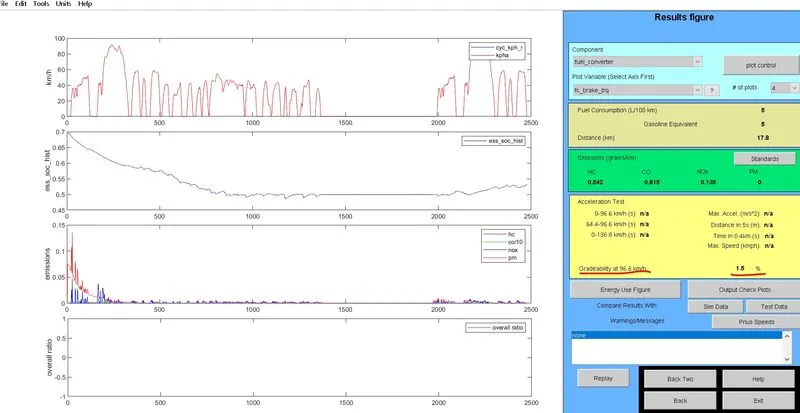
Gradeability found to be 1.5%.
3)For 70mph speed:
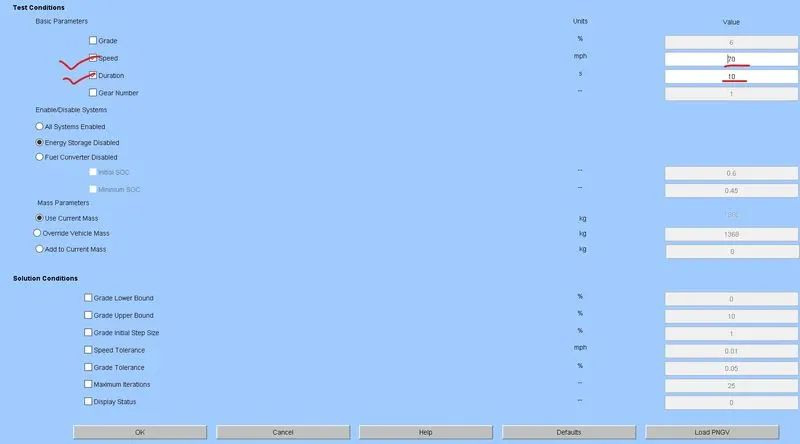
Result fig:
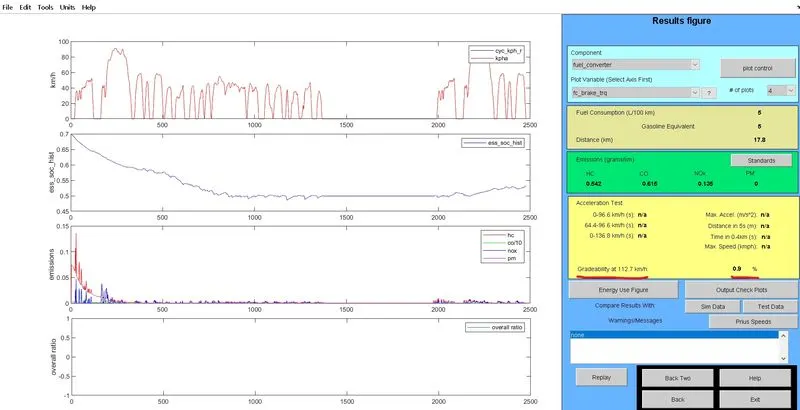
Gradeability found to be 0.9%.
B)For 20 sec duration:
1)for 50mph speed:
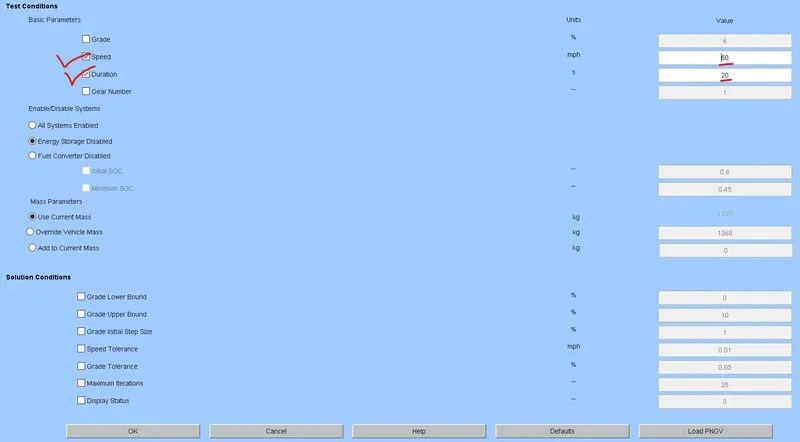
Result fig:
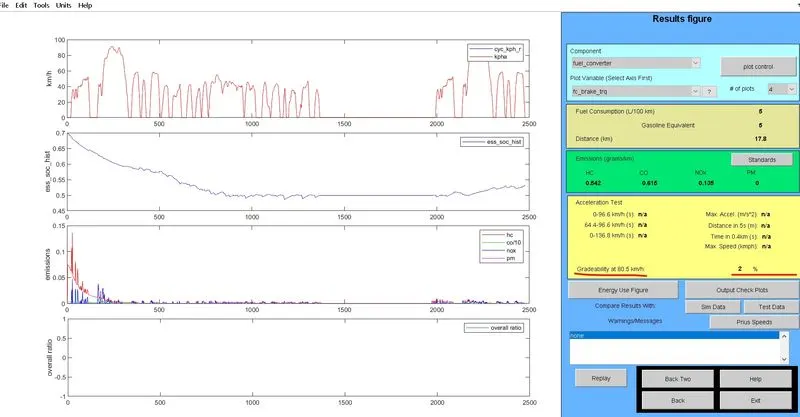
Gradeability found to be 2%.
2)For 60mph speed:
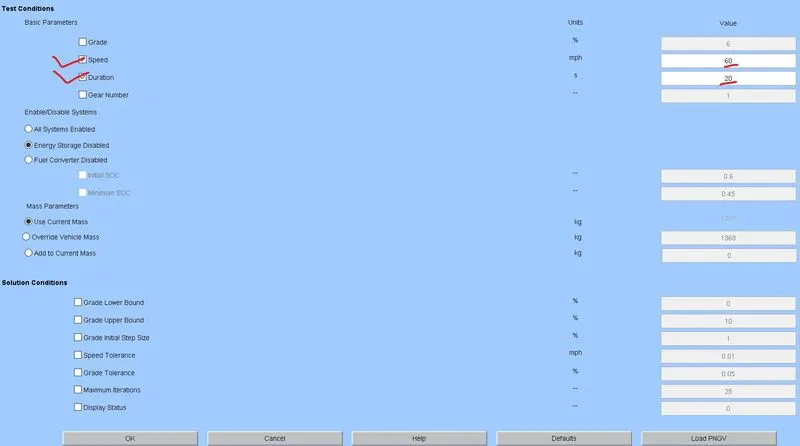
Result fig:
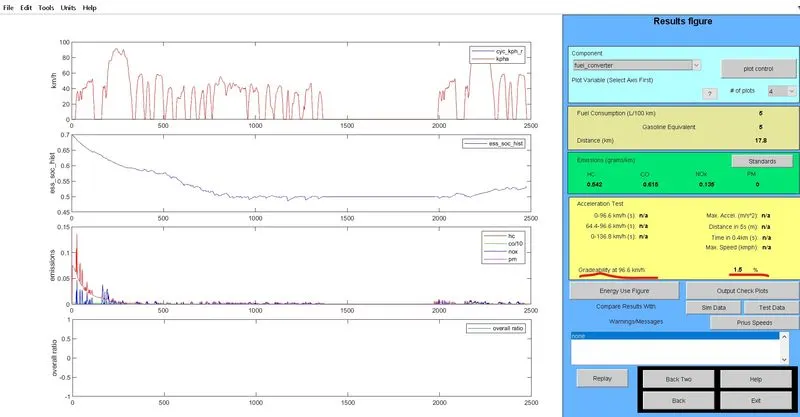
Gradeability found to be 1.5%.
3)For 70mph speed:
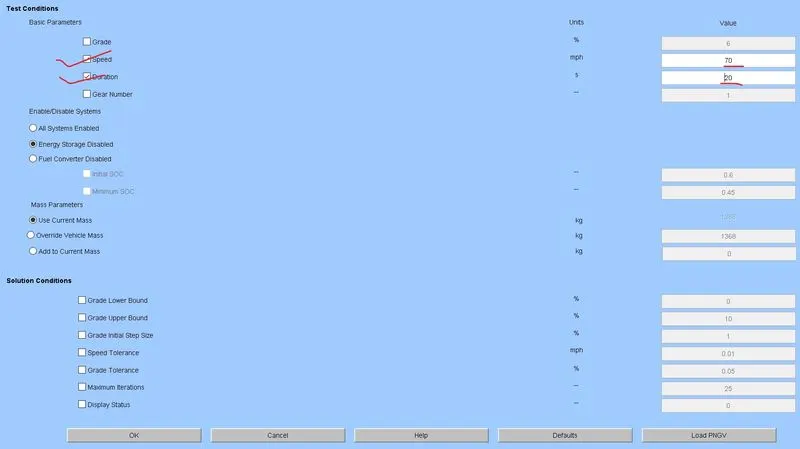
Result fig:
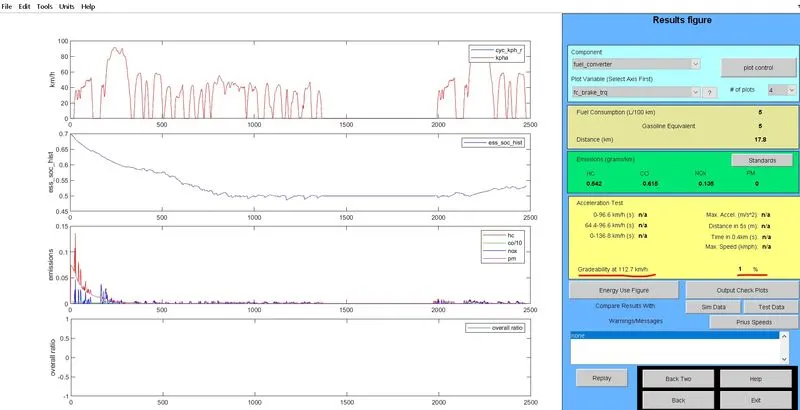
Gradeability found to be 1%.
Conclusion:
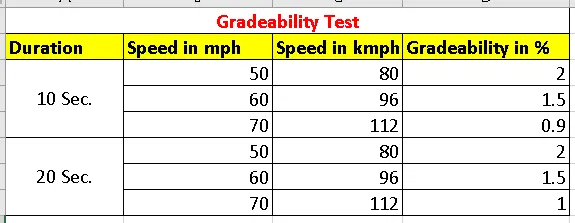
From above Simulation result it is observed that gredeability is affected by both variation of speed & time duration. Higher the speed lesser the gradeability & higher the hill climbing capabilities & vice versa.