Week-3 Challenge: ADVISOR Tool
ADVISOR Tool
Aim:- Using ADVISOR Tool Simulate Given Parameters.
Introduction:-
The ADVISOR Tool means Advance Vehicle Simulator Tool. It is created by NREL [National Laboratory for Renewable Energy] in year betwwen 1994-2004. It gives rapid analysis of the performance and fuel economy of conventional vehicle, electric vehicle and hybrid electric vehicle. It use backward flow means driving cycle to energy storage.The vehicle models are mostly experiential, relying on drivetrain component input or output relationship measured in the laboratory. In this only look-up tables are used no built in MATLAB models. It is used to construct models that are use macro statistics from duty cycles and cycle averaged efficiencies of components of near instatneous prediction of fuel consumption and performance.
Interface of ADVISOR Tool:-
Here are many options are available like start, help, exit and one of important is unit. Two units are available
1) Metric
2) US
so in india use metric means KMph amd in US arte used miles.
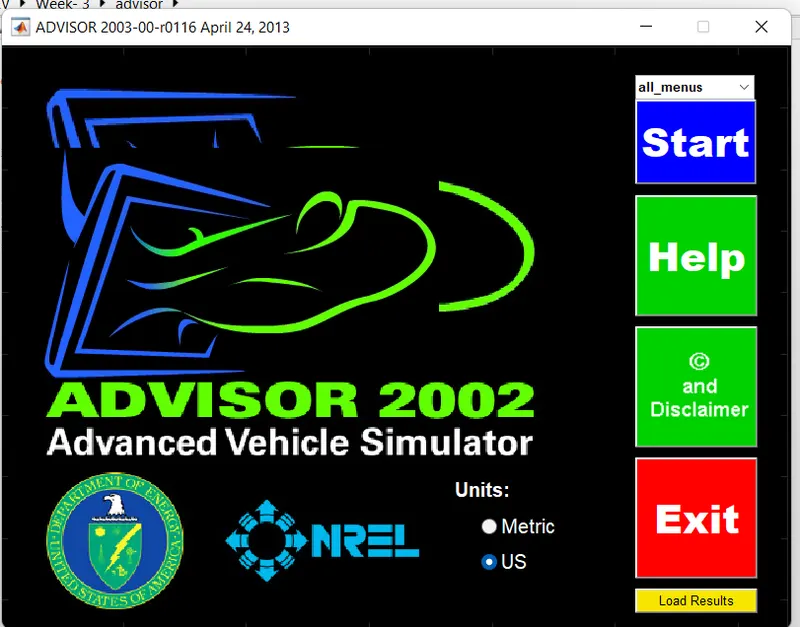
This is main Interface of tool. this page we changes some parameters like vehicle type, dive configuration, fuel converter,energy storage.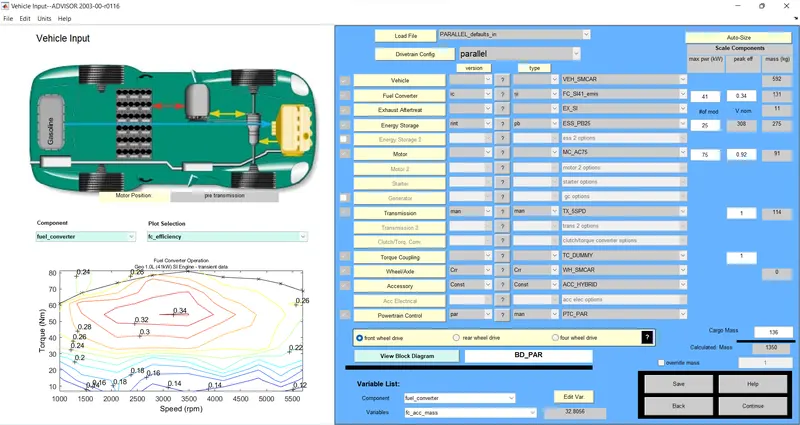
Use ADVISOR tool and simulate the following
Question-1
1. For EV_defaults_in file, if cargo mass is 500 kg with all other default conditions, can the vehicle travel for 45 km with FTP drive cycle? Conclude your observations.
In this interferferance we load the file as EV_defaults_in and the drivetrain configuration is EV and vehicle type is VEH_SMCAR. As given condition change the cargo mass as 500kg. then the total calculated mass is 1508 kg.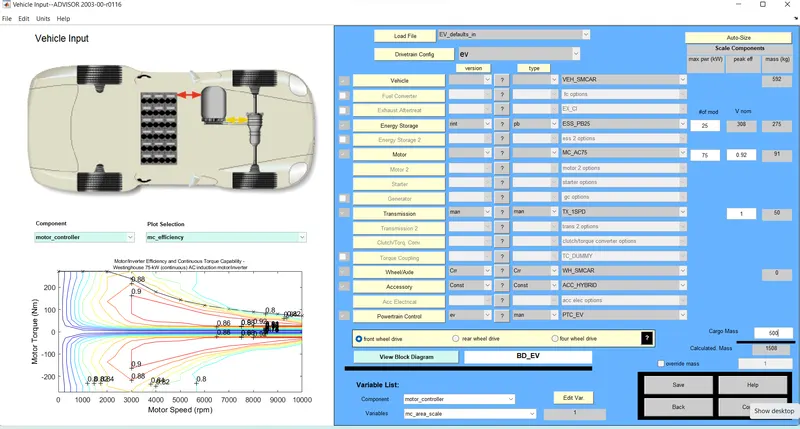
The number of drive cycle used as 1.
In this we select the Drive cycle as CYC_FTP and in # of cycle give number of cycle how many cycle we have to run for the vehicle.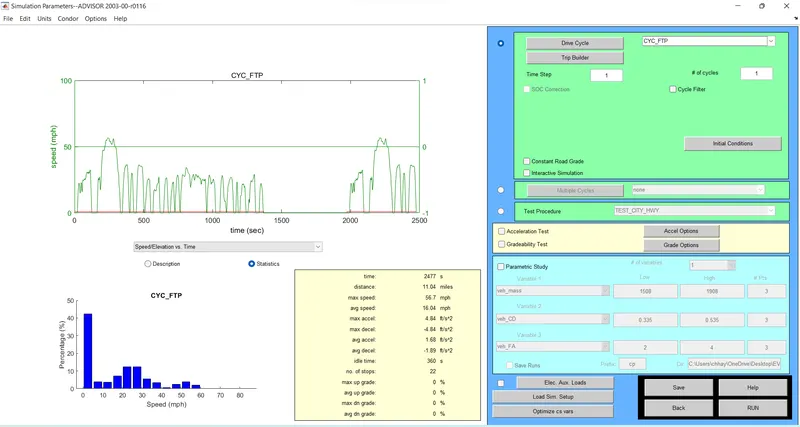
Its a description of FTP drive cycle. In this figure shows grpah in that graph we shown the required time for the cycle is 2477 seconds and run of this cycle is 11.04 km. The maximum speed for this cycle is 56.7 km/h and the average speed for this drive cycle is 16.04 km/h.
Results:- 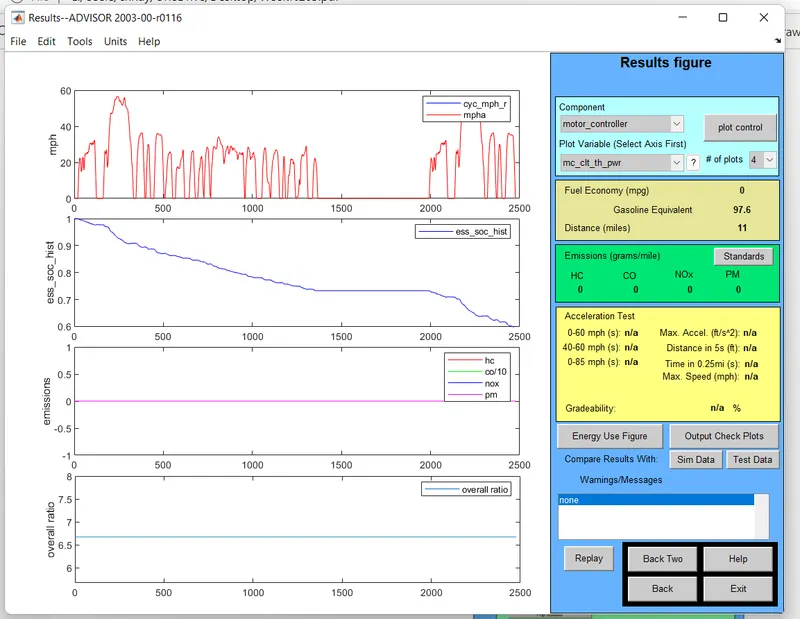
The distance tyravelled by tye vehicle in drive cycle 1 is 11.04 km and the state of charge is almost use 40%.
Increasing the number of drive cycle as 2.
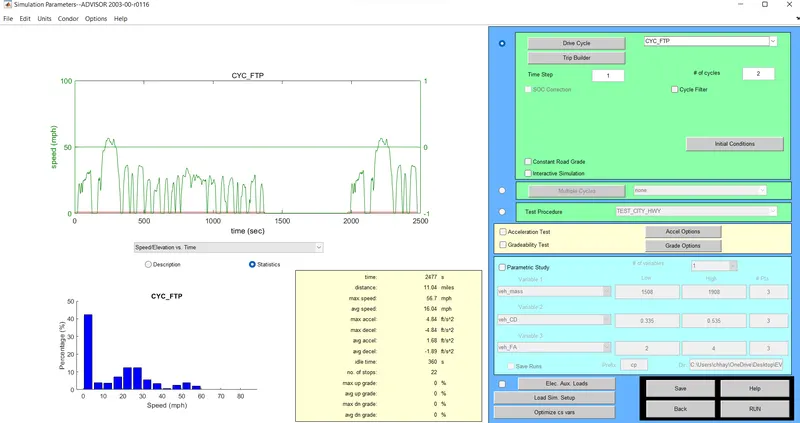
Result:-
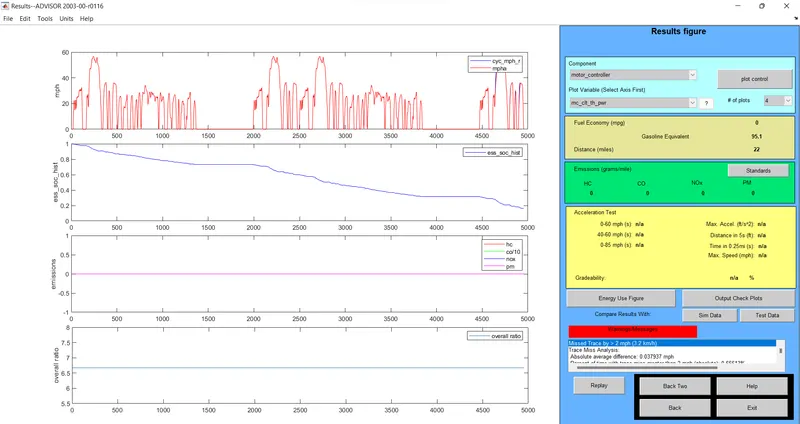
The distance tyravelled by tye vehicle in drive cycle 2 is 22 km and the state of charge is almost use 80%.
Increasing the number of drive cycle as 3
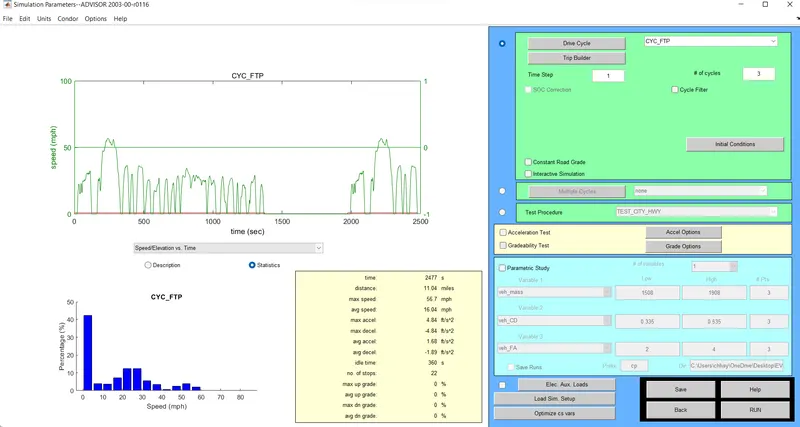
Result:-
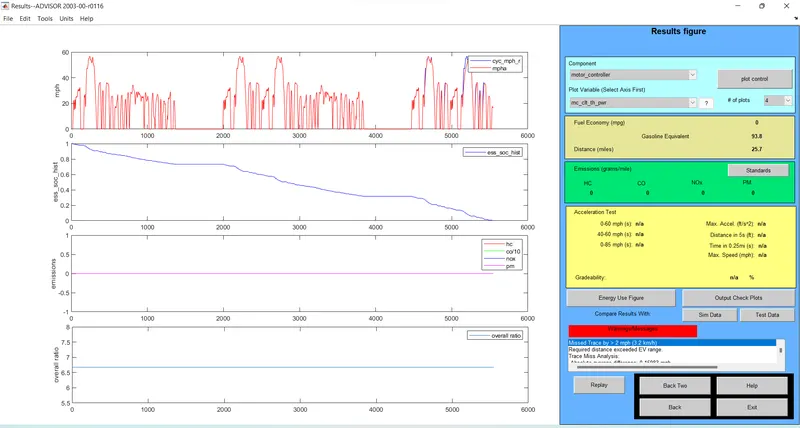
The distance tyravelled by tye vehicle in drive cycle 3 is 25.7 km and the state of charge is fully use 100%.
Observation:-
| S.N. NO | No.of Drive cycles |
Distance Covered by vehicle |
| 1 | 1 | 11.04 |
| 2 | 2 | 22 |
| 3 | 3 | 25.7 |
The minimum distance travelled by the vehicle is 11.04 km for Drive cycle FTP. and the maximum Distance travelled by the vehicle ius 25.7 km using number of 3 drive cycle which consumes state of charge is 100%. This vehicle cant run 45 km using this cycle.
-----------------------------------------------------------------------------------------------------------------------------
2) In the above case, try changing the battery capacity and repeat the simulation.
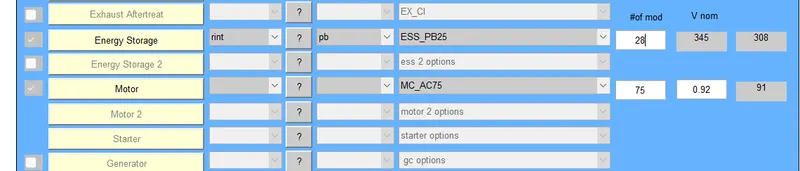
Now. in this window we are changing the battery capacity in energy storage section and simulate them.# mod V nom describes the battery capacity so we will change the battery module number of batteries in first box and we will see the changes of the battery voltage and battery weight. as increasing number of modules by one then the battery voltage is increase by 12V and the weight is also increased by 11 kg.
In this window we are change the number of modules of batteries is 27.

Result for modules of batteries is 27 and Drive cycle as 1:-
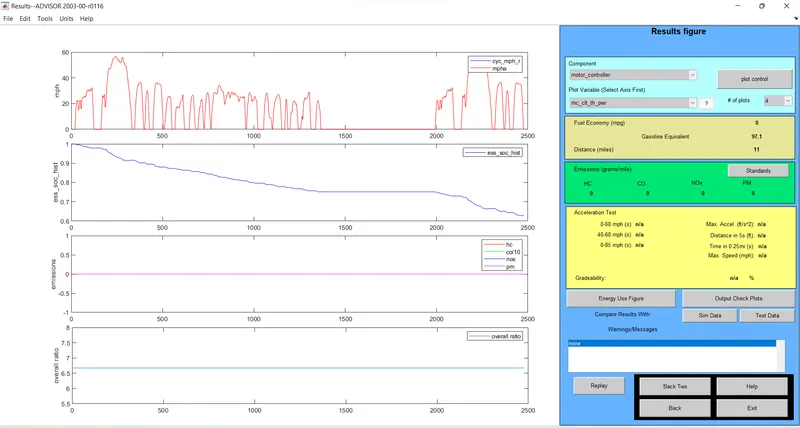
The distance travelled by the vehicle in drive cycle 1 is 11 km and the state of charge is almost use 30%.
Result for modules of batteries is 27 and Drive cycle as 2:-
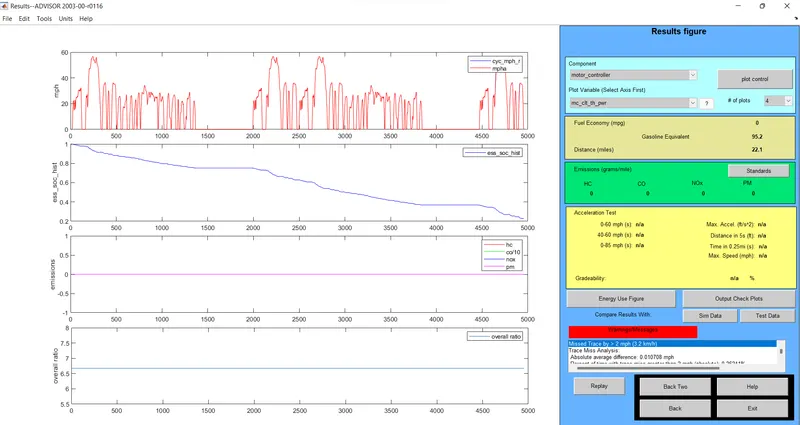
The distance travelled by the vehicle vehicle in drive cycle 2 is 22.1 km and the state of charge is almost use 60%.
Result for modules of batteries is 27 and Drive cycle as 3:-
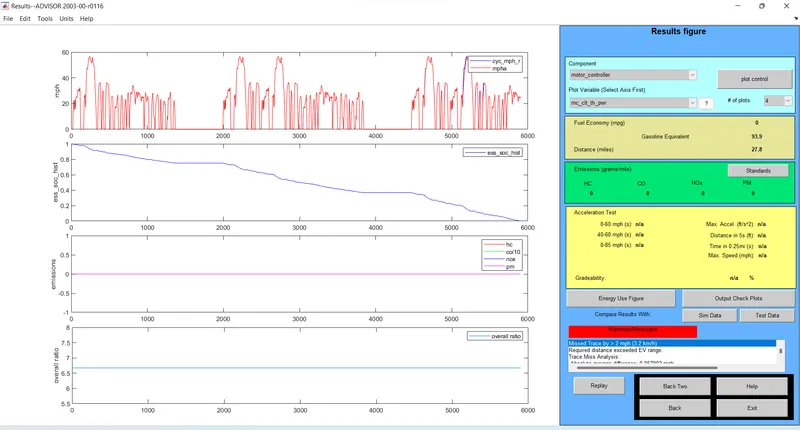
The distance travelled by the vehicle vehicle in drive cycle 3 is 27.8 km and the state of charge is almost use 100%.
Now we are changing the number of module soc batteries is 28
Result for modules of batteries is 28 and Drive cycle as 1:-
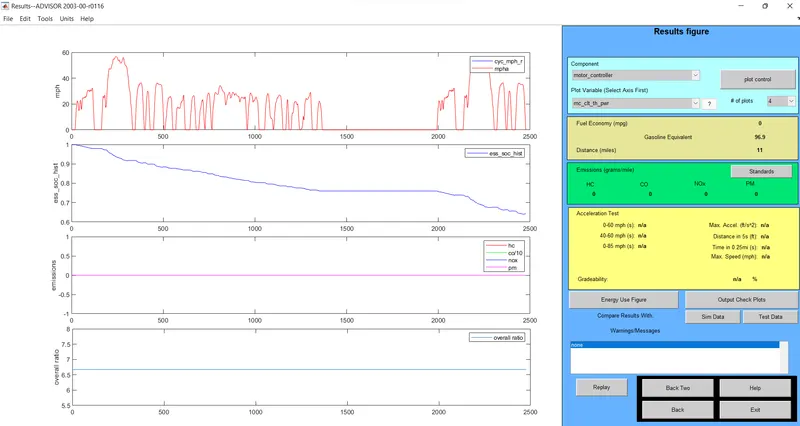
The distance travelled by the vehicle in drive cycle 1 is 11 km and the state of charge is almost use 30%.
Result for modules of batteries is 28 and Drive cycle as 2:-
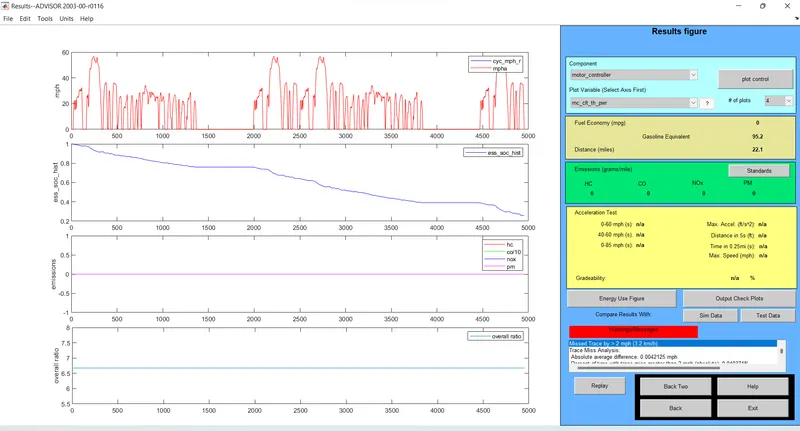
The distance travelled by the vehicle in drive cycle 2 is 22.1 km and the state of charge is almost use 60%.
Result for modules of batteries is 28 and Drive cycle as 3:-
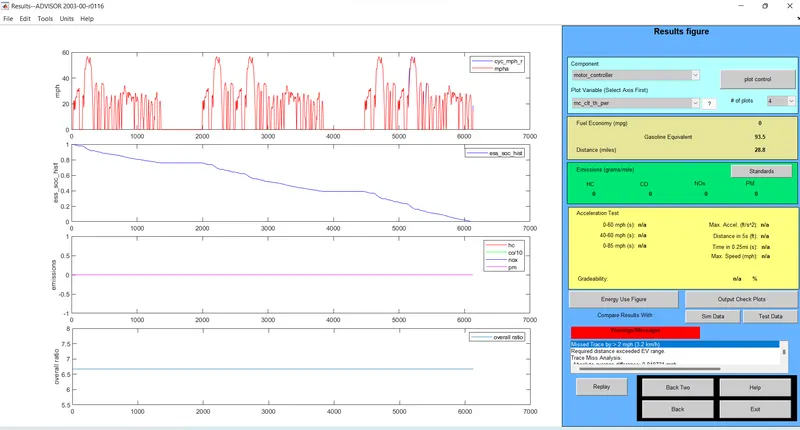
The distance travelled by the vehicle in drive cycle 3 is 28.8 km and the state of charge is almost use 100%.
Now we are changing number of module soc batteries is 29

Result for modules of batteries is 29 and Drive cycle as 1:-
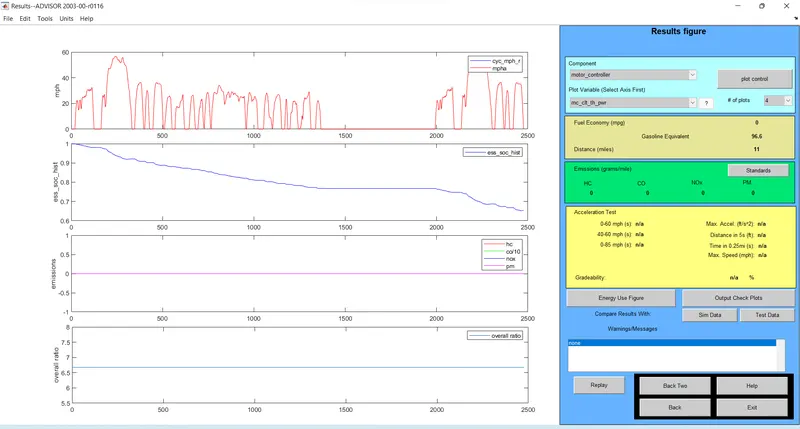
The distance travelled by the vehicle in drive cycle 1 is 11 km and the state of charge is almost use 30%.
Result for modules of batteries is 29 and Drive cycle as 2:-
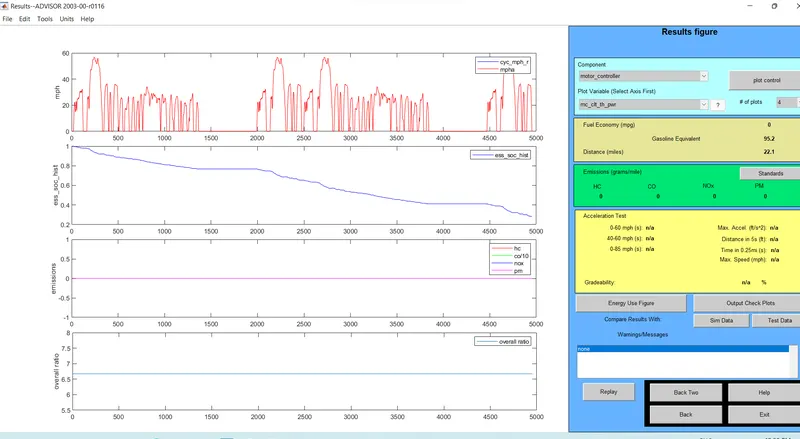
The distance tyravelled by tye vehicle in drive cycle 2 is 22.1 km and the state of charge is almost use 60%.
Result for modules of batteries is 29 and Drive cycle as 3:-
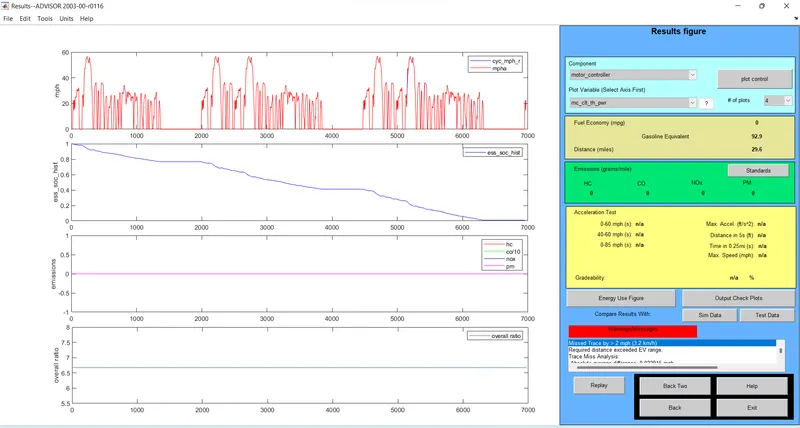
The distance travelled by the vehicle in drive cycle 3 is 29.06 km and the state of charge is almost use 100%.
Observation:-
For Drive cycle 1:-
| Number of Drive Cycle |
Number of Modules |
Voltage of battery |
weight of battery |
distance travelled vehicle |
State of charge used |
| 1 | 27 | 333 v | 297kg | 11 km | 30% |
| 2 | 28 | 345 v | 308kg | 11 km | 30% |
| 3 | 29 | 358 v | 319kg | 11 km | 30% |
For Drive cycle 2:-
| Number of Drive Cycle |
Number of Modules |
Voltage of battery |
weight of battery |
distance travelled vehicle |
State of charge used |
| 1 | 27 | 333 v | 297kg | 22.1 km | 60% |
| 2 | 28 | 345 v | 308kg | 22.1 km | 60% |
| 3 | 29 | 358 v | 319kg | 22.11 km | 60% |
For Drive cycle 3:-
| Number of Drive Cycle |
Number of Modules |
Voltage of battery |
weight of battery |
distance travelled vehicle |
State of charge used |
| 1 | 27 | 333 v | 297kg | 27.8 km | 100% |
| 2 | 28 | 345 v | 308kg | 28.8 km | 100% |
| 3 | 29 | 358 v | 319kg | 29.06 km | 100% |
as we observe from here In drive cycle 1 and drive cycle 2 constant distance travel and in drive cycle 3 we get changes in distance travelled by vehicle. so to cover 29.06 km distance we select the battery capacity as number of modules 27,28,29 all three modules are not suitable. because the Drive cycle 1,2 and 3 are not covered distance.
------------------------------------------------------------------------------------------------------------------
3. Perform gradeability test with PRIUS_Jpn_defaults_in file Compare your results in table and conclude.
first we open the advisor tool and then select the vehicle prius_jpn_defaults. then we go on continue tab and click there. then there available the gradeablity test so select them and open gradeability option then we change the speed as 20 mph, 30 mph, 40 mph and the duration also change as 10 sec and 20 sec then enable the system all parameters. then click on ok and then select constant road grade. then run the model.
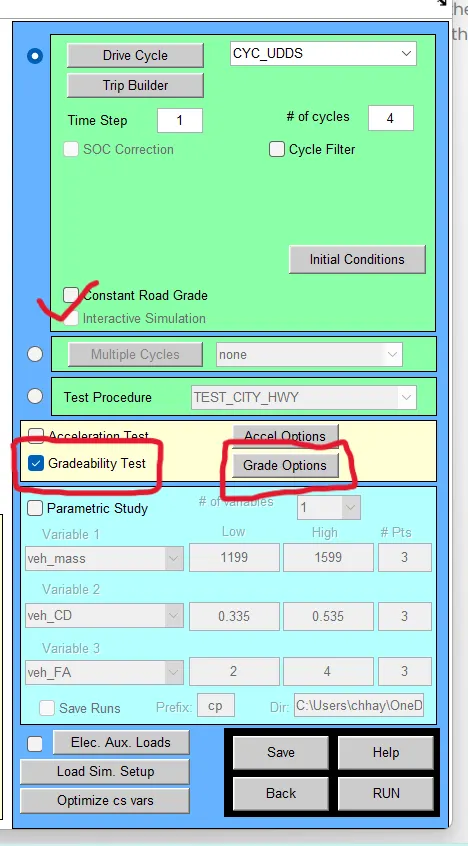
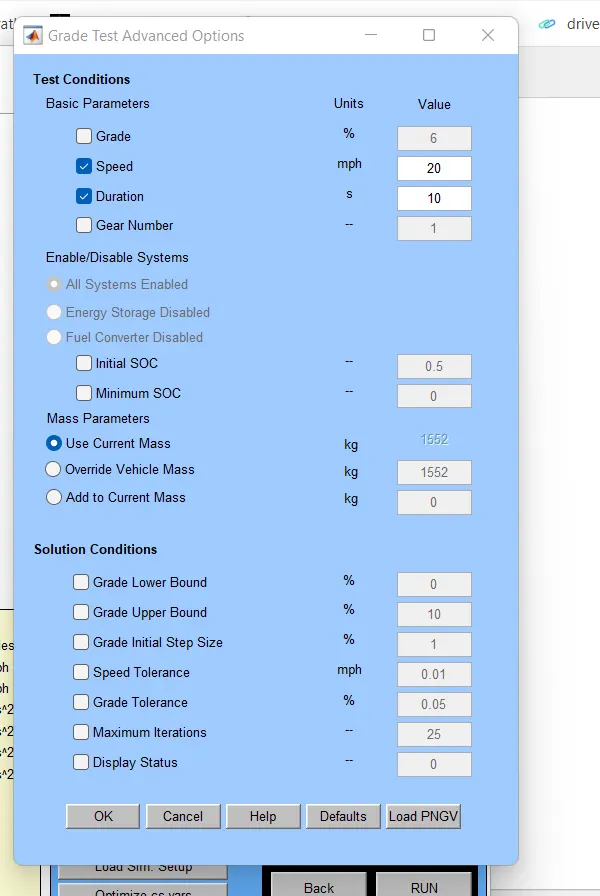
Now start the test:-
1] Speed 20 mph, Duration 10 sec:- 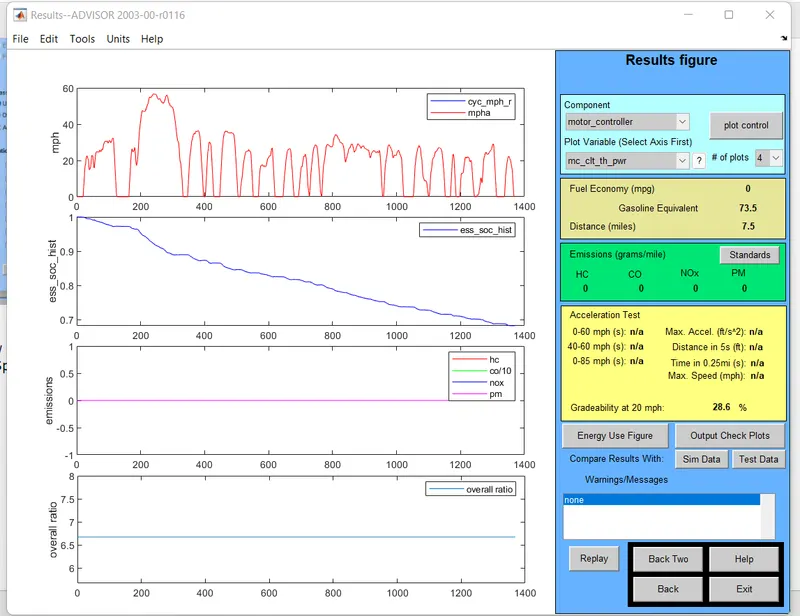
Gradeability:- 28.6 %
Observation:-
| S.No | Speed | Duration | Gradeability |
| 1 | 20 mph | 10 sec | 28.6% |
| 2 | 30 mph | 10 sec | 19% |
| 3 | 40 mph | 10 sec | 13.6% |
| 4 | 20 mph | 20 sec | 27.1% |
| 5 | 30 mph | 20 sec | 18% |
| 6 | 40 mph | 20 sec | 12.8% |
Comparing this we can coclude that the both are equally works. but when the speed is increase in constant duration then the percentage of gradeability is decrease.
When speed is increase the gradability is decrease.