Week-3 Challenge: ADVISOR Tool
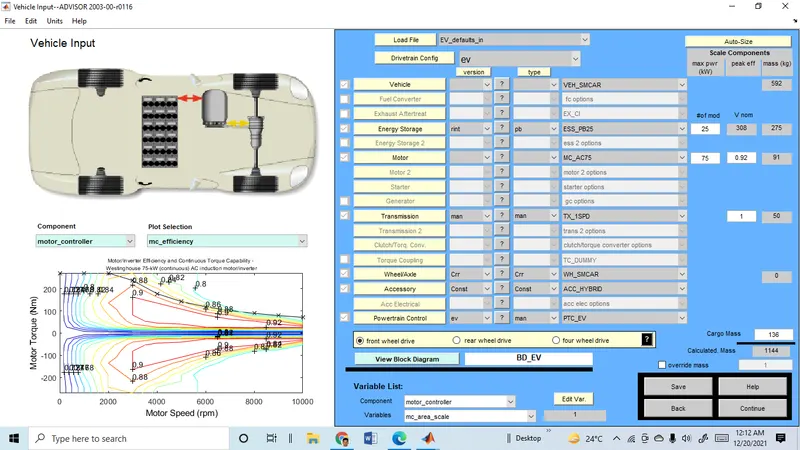
Problem1: After opening the advisor tool using matlab the following window will appear and in load file the EV_default_in vehicle model is selected from drop down menu and then the cargo(pay load) mass is changed from default to 500 kg.
After that the drive cycle is changed to CYC_FTP by selecting from drop down menu of the simulation parametr window.
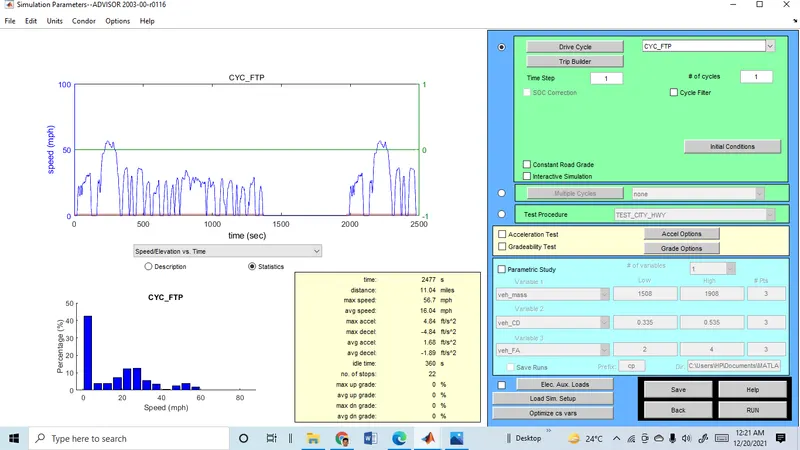
Then the run botton is pressed to see the results.Units also changed to metric to see the parametrs in si system
The result of the changed paramter is shown in the below graph.
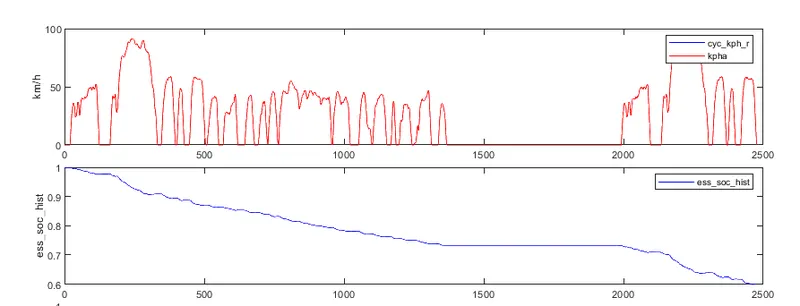
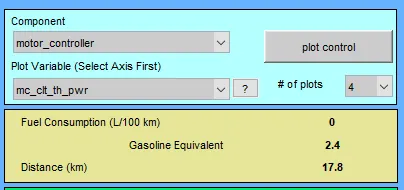
The drive cycle data and state of charge(SOC) are shown .This SOC represents the battery charge level.Based on current SOC we can predict how much distance it can cover. It only reched down to 0.6 of SOC means still 40 % battery available. In results for one complete cycle it has covered 17.8 km. Now to see wheather the vehicle can reach the 40 kmph we have to increase the number of cycle.
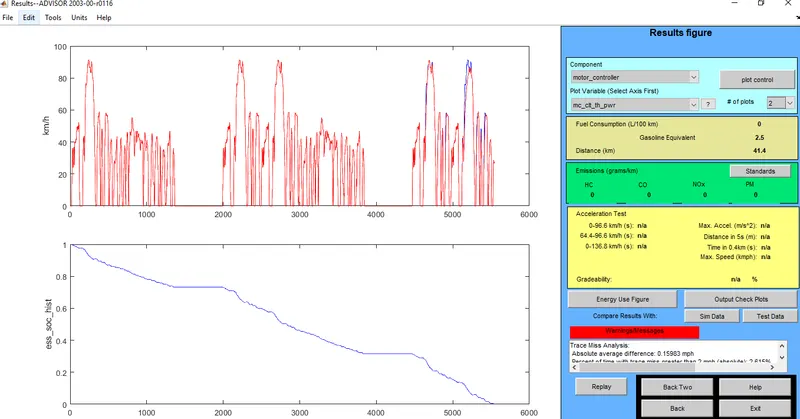
Here i have changed the no of cycle as 4 and we can see the result that the EV vehicle exceeds the limit of its capcity and batery fully drained around 5500 s(which comes around almost 2hrs) and it covers 41.4 km distance . So we can conclude that after increasing the payload the EV_default has battery capacity to cross only 41km and unable to reach the requirement of 45 km.
2....Changing the battery capacity and repeating the simulation
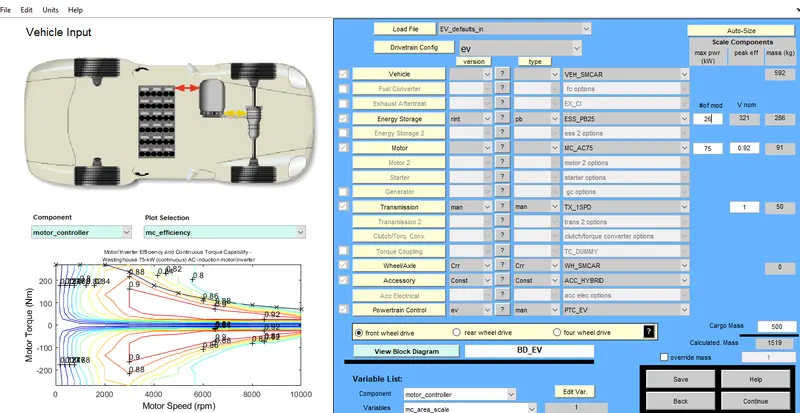
The battery capacity is changed by increasing the number of modules to 26 from 25 and you can see that increase in voltage and weight.
for further process continue botton is pressed.
No of cycles changed to 2 FTP Cycle and simulation run is pressed
1.Energy capacity is with 26 modules for 2 drive cycle
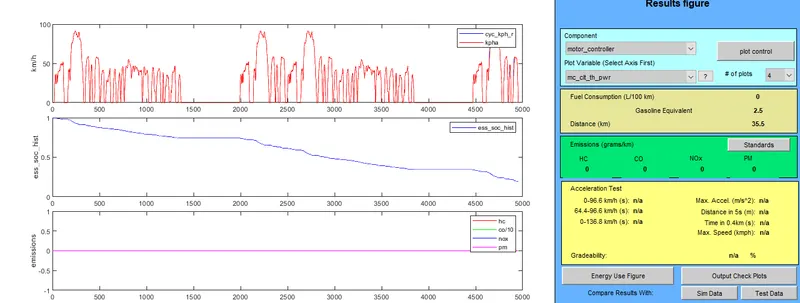
2. Battery capacity with 27 battery modules for 2 driving cycle
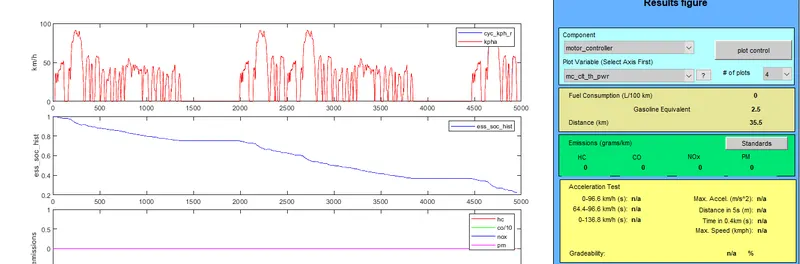
3.Battery capacity with 28 battery modules for 2 driving cycle
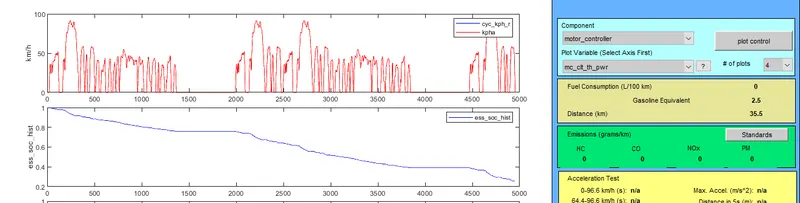
For 3 drive cycles
1.Battery capacity with 26 modules For 3 drive cycle
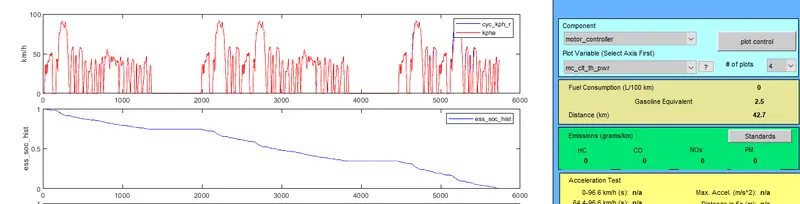
2. Battery capacity with 27 modules For 3 drive cycle
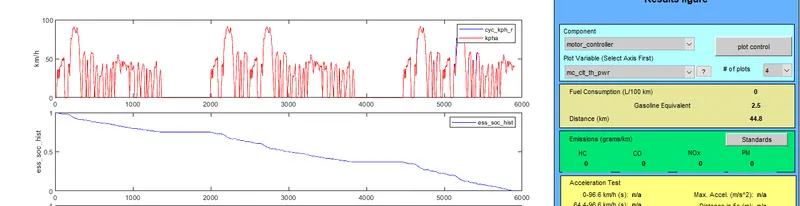
3.Battery capacity with 28 battery modules for 3 driving cycle
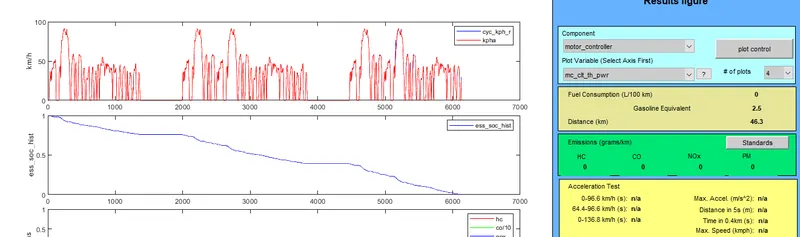
| battery modules | Voltage | weight of battery | distance traveled (km) for 2 drive cycle | distance traveled (km) for 3 drive cycle |
| 26 | 321 | 286 | 35.5 | 42.7 |
| 27 | 333 | 297 | 35.5 | 44.8 |
| 28 | 345 | 308 | 35.5 | 46.3 |
from the result we can conclude that
1. while changing the battery module for two drive cycle we get constanst distance for 2 drive cycle
2. when the same battery module is used for 3 drive cycle which is used for 2 drive cycle the distance is varied
3. The battery module 28 for drive cycle of 3 exceeds the required 45 km.
3. Perform gradebility test with PRIUS _jpn_default
In advisor window select PRIUS_jpn_default model
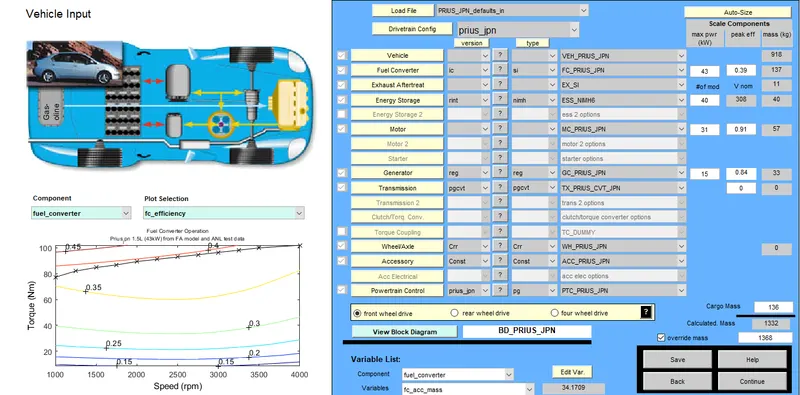
Select gradebility test in the next window
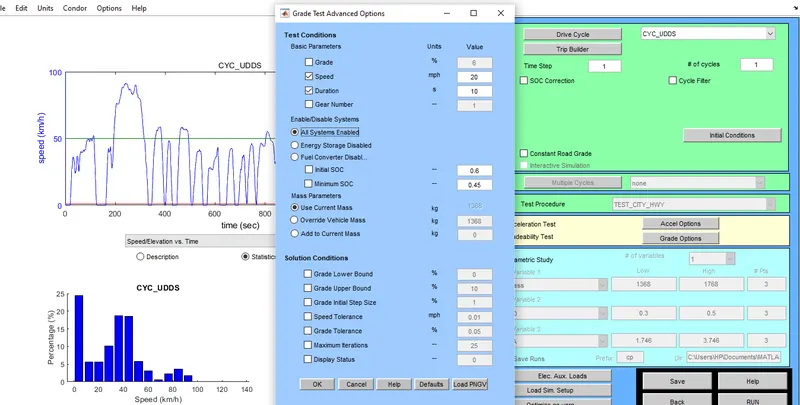
speed 20 mph or 32.2 kmph and click on the constant road grade as 1.5 %.
Results for duration of 10 sec
1. speed=32.2 kmph or 20mph
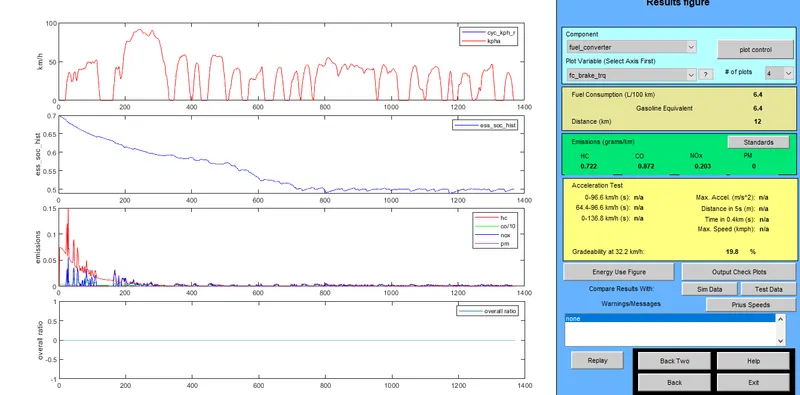
Gradebility =19.8 %
2. speed= 40.2 kmph or 25 mph
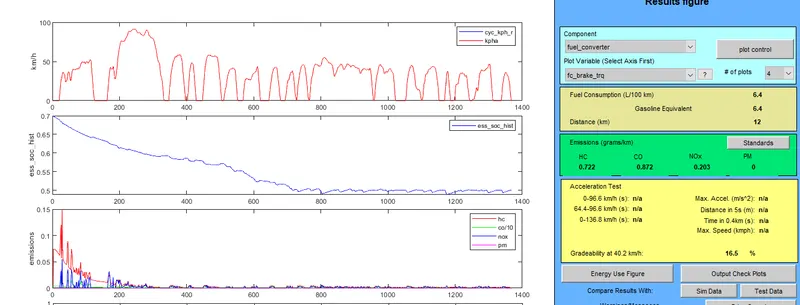
Gradebility = 16.5 %
3. Speed =30 mph or 48.3 kmph
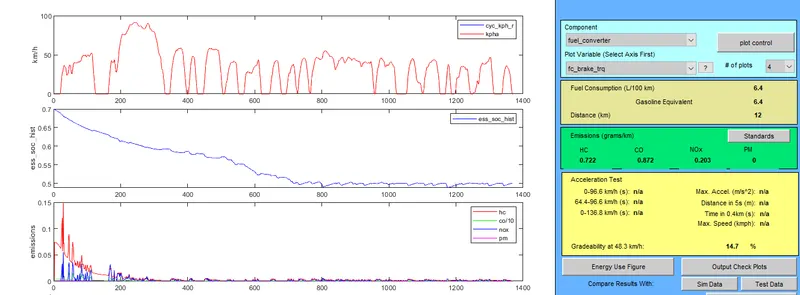
Gradebility= 14.7%
4. speed =35 mph or 56.3 kmph
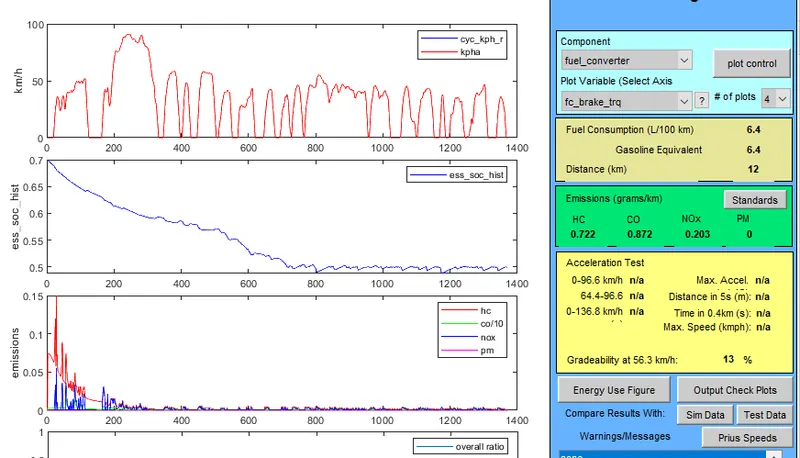
Gradebility = 13%
for time 20 seconds simulation time
1. speed= 20 mph or 32.2 kmph
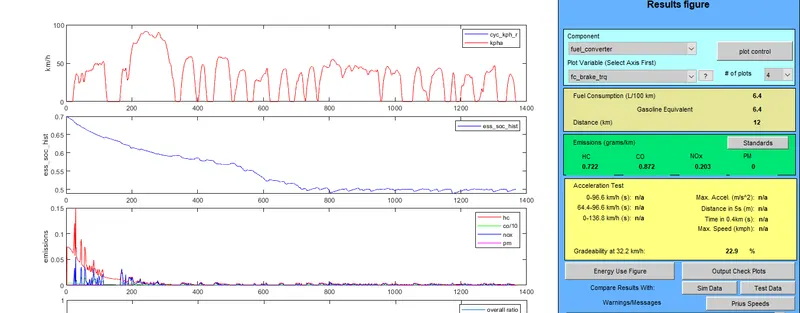
gradebility=22.9%
2. speed= 25 mph or 40.2 kmph
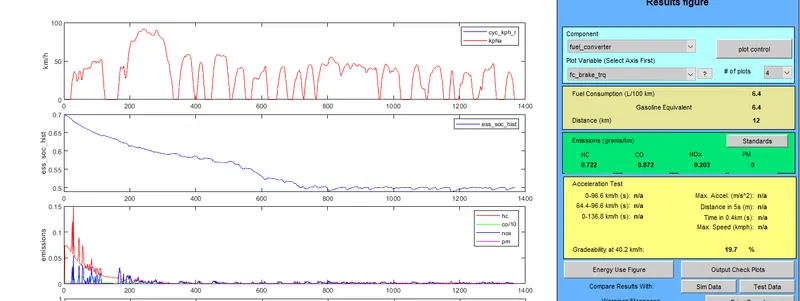
gradebility =19.7 %
3. speed= 30mph or 48.3 kmph
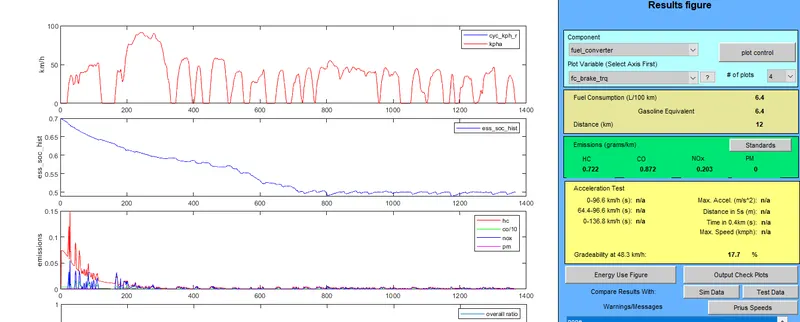
Gradebility= 17.7%
4. speed=35 mph or 56.3 kmph
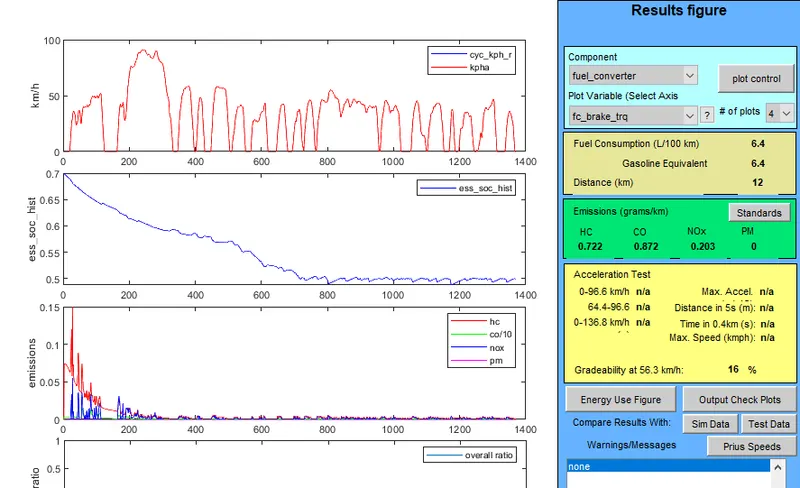
| Vehicle speed (mph) | Vehicle speed (kmph) |
Gradebility(%) for 10 sec |
Gradebility(%) for 20 sec |
| 20 | 32.2 | 19.8 | 22.9 |
| 25 | 40.2 | 16.5 | 19.7 |
| 30 | 48.3 | 14.7 | 17.7 |
| 35 | 56.3 | 13 | 16 |
from the result we can say that gradbility is decreased as we increased the speed and also as we increased the simulation time/duration gradability increased.