Week-3 Challenge: ADVISOR Tool
Q. 1. For EV_defaults_in file, if cargo mass is 500 kg with all other default conditions, can the vehicle travel for 45 km with FTP drive cycle? Conclude your observations.
Ans.
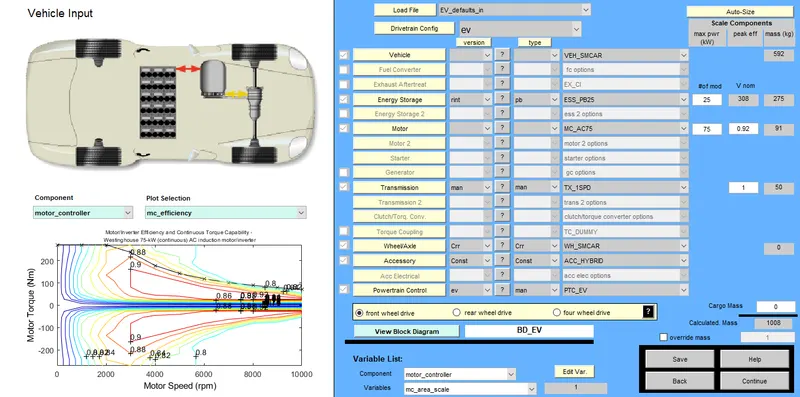
Car Model:
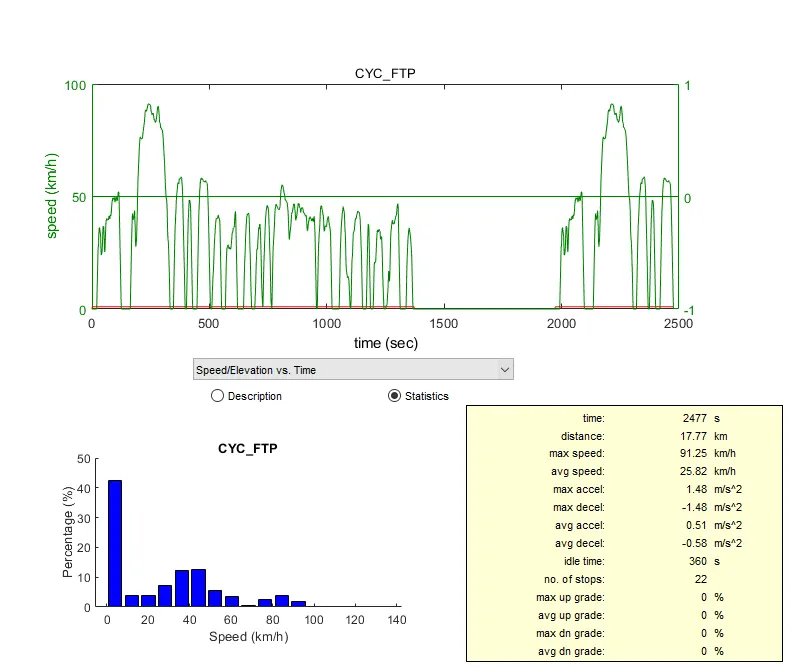
CYC_FTP Drive Cycle:
For simplicity, I compare our requirement model with the 0Kg cargo mass model.
Case 1: Cargo Mass = 0 Kg
- In this case, I choose EV_defaults_in as a car model as per our requirement with other default conditions except cargo weight take 0Kg, so total weight is 1008 KG.
- In the second slide I select FTP drive cycle with 2.4 number of cycles because our travelling distance is 45 Km.
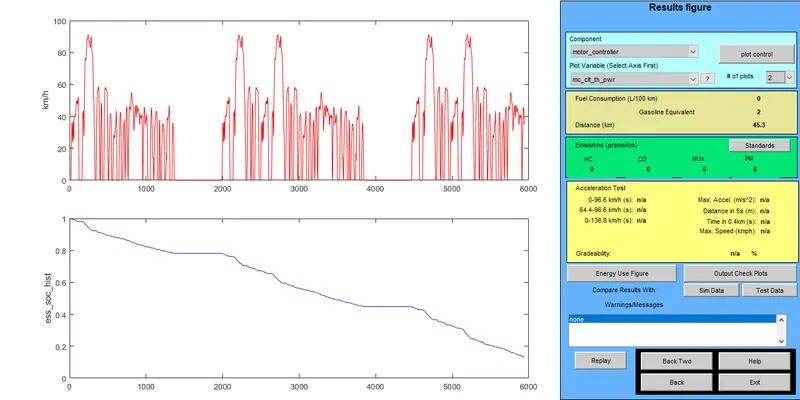
- After the running simulation I got the result, our model car travelled 45.3 Km in 5944 seconds and still 13% SOC are remaining.
- Below figure shows the result of this case.
Case 2: Cargo Mass = 500 Kg
- This case is similar to case 1 except cargo mass is 500 Kg, so total weight is 1508 Kg.
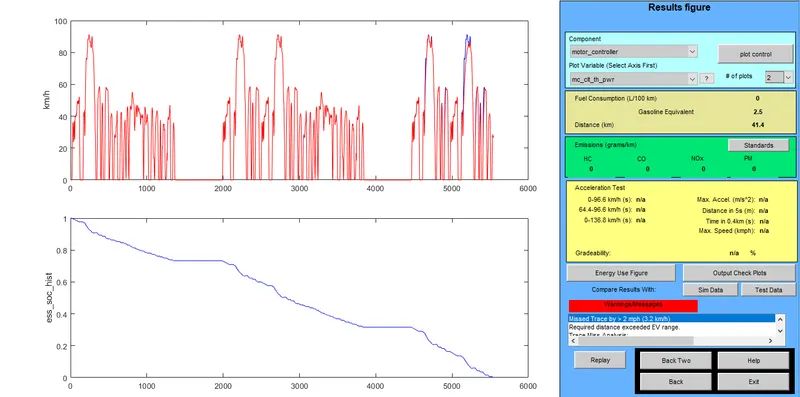
- As per our requirement our model can not reach 45 Km, it is travelled only 41.4 Km. And our model energy storage is totally exhausted in 5545 seconds, only 400 sec left to reach 45 Km.
- Also we got a warning/message that required distance exceeded EV range.
- Below fig shows the result slide of case 2.
Result:
Above experiment shows that our EV_defaults_in model with 500 Kg cargo mass can not reach to 45 Km. To complete 45 Km for this model required some more energy to fulfill the remaining 400 sec energy of our driving cycle.
Q. 2. In the above case, try changing the battery capacity and repeat the simulation.
Ans.
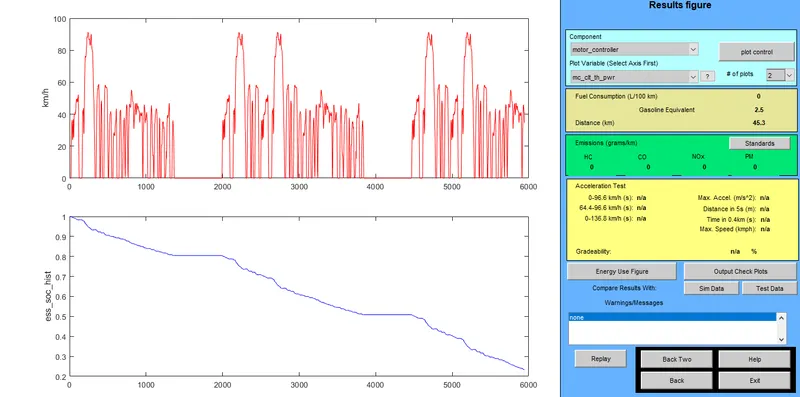
In this I take all parameters the same as per above case except the battery module. Default battery module is 25, now I increased it by 10 modules, so the total battery module is 35 and its cargo mass is 500 Kg. After changing the battery module I run the model. Below figure shows the result of this updated model.
Result:
Now our car model completed the 45.3 Km distance in 5944 seconds and still 23% SOC is remaining. And also no any warning/message.
Q. 3. Perform gradeability test with PRIUS_Jpn_defaults_in file Compare your results in table and conclude.
Ans.
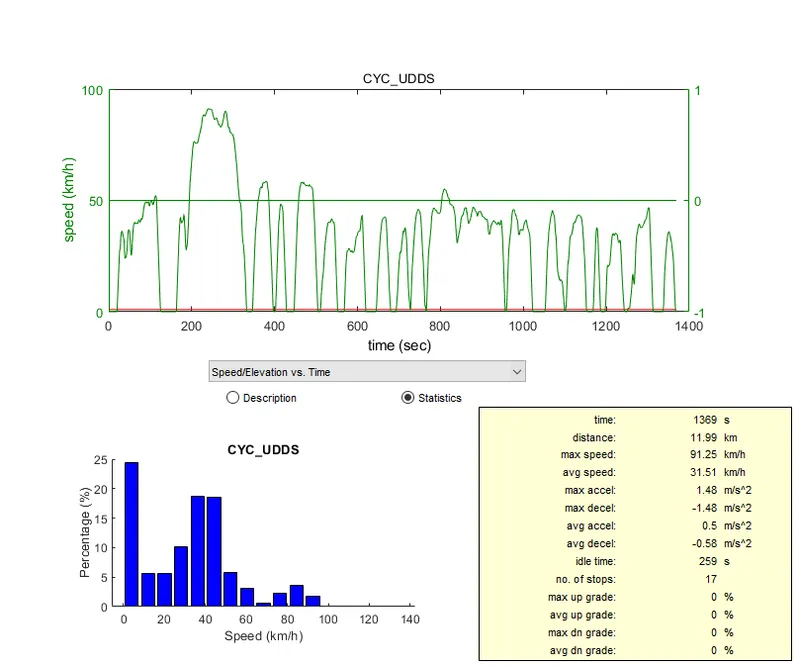
For this gradeability test I take PRIUS_Jpn_default_in as a car model and CYC_UDDS as a drive cycle of 5 cycle rounds, so its total distance is 60 Km and duration is 6845 sec. Below figure shows drive cycle details:
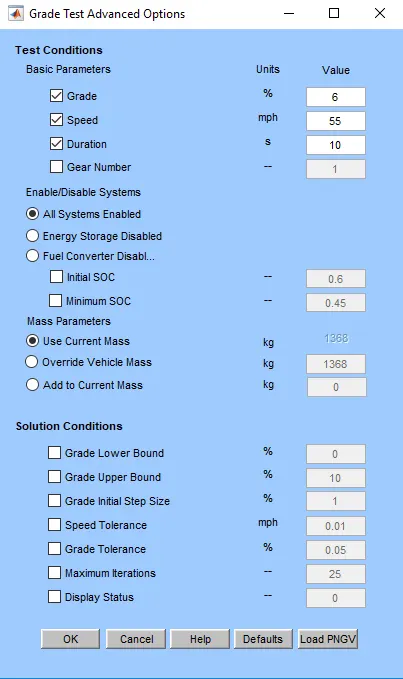
Similarly below figure shows the gradeability test option I was changed in only grade percentage, speed and duration remaining options were the same throughout the test.
Results:
|
Input Parameters |
1st |
2nd |
3rd |
4rd |
5th |
6th |
7th |
|
Grade (%) |
2 |
3 |
6 |
8 |
10 |
15 |
22 |
|
Speed (Kmph) |
48.3 |
35.4 |
56.3 |
48.3 |
32.2 |
53.1 |
54.7 |
|
Test Duration (sec) |
10 |
25 |
10 |
10 |
20 |
15 |
100 |
|
Output Parameters |
|||||||
|
Distance Travelled (Km) |
59.9 |
59.9 |
59.9 |
59.9 |
58 |
39.6 |
16.5 |
|
State of charge (%) |
50 |
50 |
50 |
50 |
50 |
45.5 |
45 |
|
Fuel Consumption (L/100Km) |
7.3 |
8.4 |
11.7 |
13.9 |
16.4 |
25.6 |
52.6 |
|
Emission |
|||||||
|
HC |
0.305 |
0.318 |
0.36 |
0.391 |
0.438 |
0.665 |
1.477 |
|
CO |
0.36 |
0.387 |
0.474 |
0.521 |
0.579 |
0.874 |
1.896 |
|
NOx |
0.149 |
0.176 |
0.258 |
0.306 |
0.357 |
0.552 |
1.125 |
|
PM |
0 |
0 |
0 |
0 |
0 |
0 |
0 |
|
Overall System Efficiency (%) |
8 |
7 |
5 |
4.2 |
3.5 |
2 |
1.1 |
- So, the above table shows the comparison between various gradeability tests. When the input parameter grade percentage increases then fuel consumption, emission also increases at the same time overall system efficiency decreases.
- According to above data, total distance travelled and state of charge (SOC) are same till upto 5th test but when grade percentage increases with large numbers then distance and SOC are reduced.
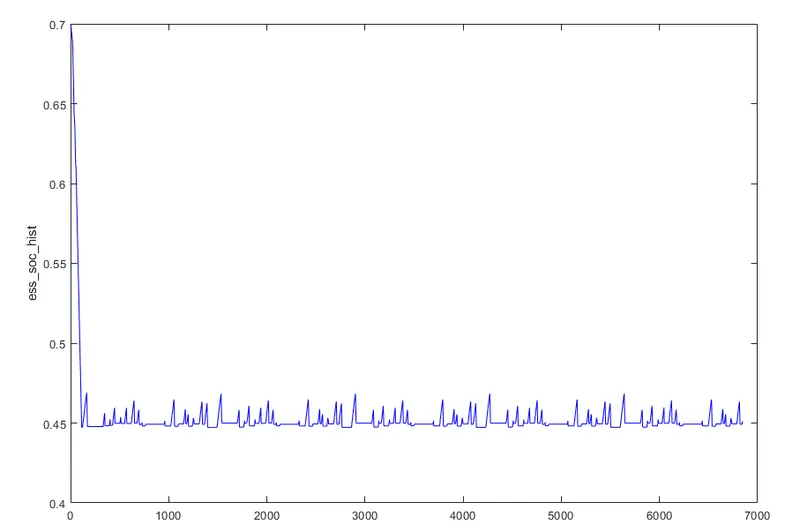
- No significant change in remaining SOC percentages because our model is a hybrid vehicle, according to their control strategy it charges the energy storage.
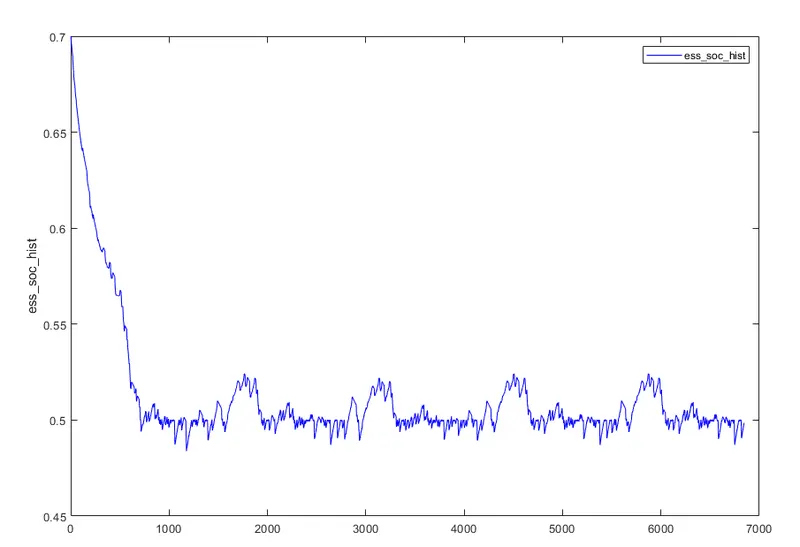
- If you see the SOC graph after running the simulation, it shows that as the percentage of grade increases SOC graphs get smoother. In the 1st test spike in SOC graph is more than the 7th test.
Test 1: SOC Graph
Test 7: SOC Graph