Week-3 Challenge: ADVISOR Tool
Question 1
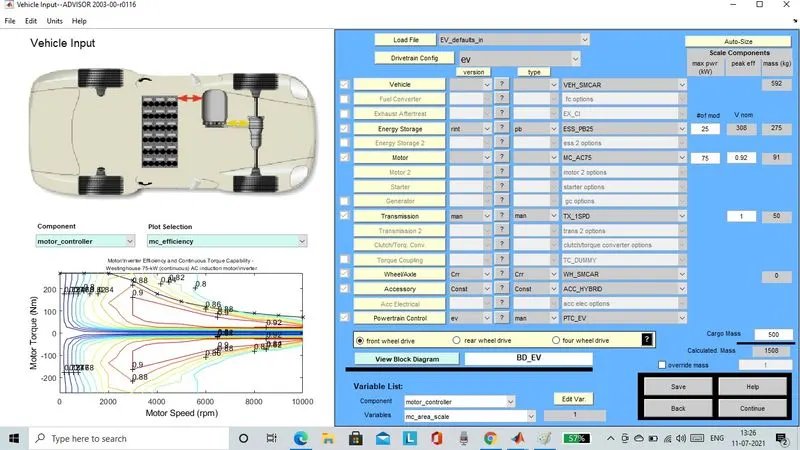
The given model is of “EV defaults” with a cargo mass of 500 kg. The model has a default lead energy storage element of type ESS Pb25. It has 25 numbers of battery strings, summing up the voltage to 308 volts and mass of 275 kg. The other conditions are kept at default value.
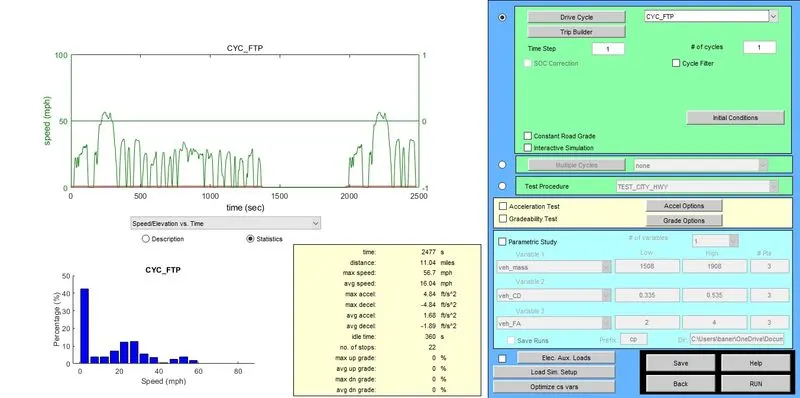
The drive cycle chosen is FTP drive cycle. Here the drive time is 2477 sec. The average speed in the drive cycle is 25.1 kmph. The maximum speed of the drive cycle goes to 91.24 kmph.
Observations: From the given drive cycle and the model we see the distance covered by the vehicle is about 17.76 km, which is very small compared to the given targeted speed of 45 km. The state of charge at the end of drive is about 0.68 out of 1.
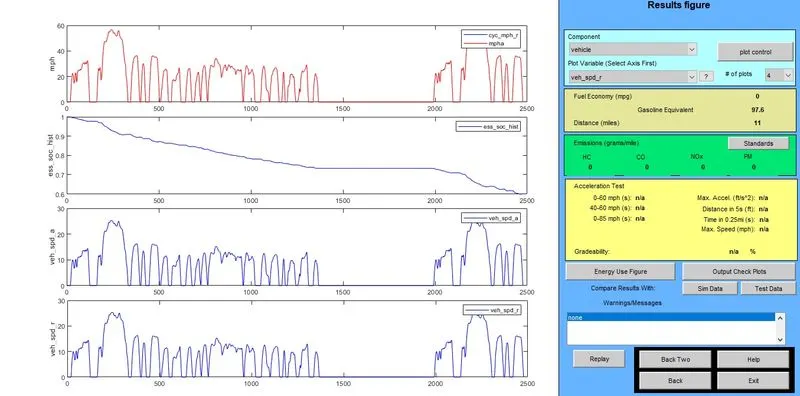
Reason: The distance covered by the vehicle depends on the average speed of vehicle and the time of travel. It is actually the product of the two. The distance covered actually depends on the drive cycle. That is its average speed, its time covered, or the no. of cycle it is repeated, before the vehicle stops.
Distance covered = average speed * time consumed
The drive cycle is a prefixed data, and is independent of the motor and battery condition. However, if the state of charge goes zero before the completion of the drive cycle, then by increasing the battery modules, can increase the distance covered. But the maximum distance that can be covered is again the product of average speed and the time taken in the drive cycle. In the simulation to change the distance, drive cycle should be changed.
Question 2
When the battery capacity is changed, we see a varied response in terms of distance covered. Let see in details.
Keeping the cargo weight constant at 500 kg. When the battery modules are 5 in numbers, the controllers keep the state of charge constant throughout the travel, which reduces the average speed, and the distance covered will be 10.2 miles. When the battery modules are increased to 7, the average speed increases and the distance covered is 10.9 miles. Now increasing the modules to 15, 25, 75, 250, we see the average speed available is equal to the average speed required in the drive cycle I.e., 25.1 kmph. So, the distance covered is the distance covered in the drive cycle which is 11 miles. Now if the module number is increased to 2500, the mass of the vehicle increases to 28733 kg. This heavy mass reduces the average and pickup speed, due to the distance covered reduces to 8.1 km.
Increasing the number of modules further, will reduce the average speed and the distance covered. By increasing the number of modules actually improves the state of charge during the travel.
| Numbers of Battery modules | Distance covered (miles) |
| 5 | 10.2 |
| 7 | 10.9 |
| 15 | 25.1 |
| 25 | 25.1 |
| 75 | 25.1 |
| 250 | 25.1 |
| 2500 | 8.1 |
Question 3.
The given model is toyota prius jpn model, with all its default conditions. The aim is to perform gradability test. Gradability is the abaility of a vehicle to climb a slope at a constant speed. The input to this analysis are slope of road mentioned in percentage, average speed and time taken. The output is the gradability in percentage which tells the ease in which the vehicle climbs the slope at a constant speed in the given time.
| SLOPE %=HEIGHT/BASE*100 | TIME SPAN OF DRIVE (sec) | SPEED (mph) | GRADABILITY |
| 6 | 10 | 20 | N/A |
| 6 | 10 | 25 | N/A |
| 6 | 10 | 30 | 2.5 |
| 6 | 10 | 40 | 2.5 |
| 6 | 10 | 50 | 2 |
| 6 | 10 | 55 | 1.7 |
| 6 | 10 | 60 | 1.5 |
| 6 | 10 | 65 | 1.2 |
| 6 | 10 | 70 | 0.9 |
| 6 | 10 | 75 | 0.7 |
| 6 | 10 | 80 | 0.3 |
| 6 | 10 | 85 | N/A |
| 6 | 10 | 90 | N/A |
Hence from the above table we see, for a time span of 10 sec, the vehicle will run successfully with a constant speed , through a slope of 6%, in a speed range of 30 to 80 mph. As speed increases beyond 50 mph the gradability reduces and becomes zero beyond 85 mph.
Ft = rolling resitance force + arodynamic drag force + hill climbing force + linear and angular accelerating force.
here Ft is the force requested by the motor. The arodynamic drag force depends on the square of vehicle velocity. While testing gradability we are driving at a constant speed, hence the acceleration force is zero. While testing gradability, the major force acting on the wheels is the hill climbing force. It depends on the mass of the vehicle and the sine of the inclination angle.
Ft = Motor Torque * radius of wheel / gear ratio.
When we see the torque charecterstics, we see it is constant up to a speed, after which is start reducing. Hence we see as we increase speed of the vehicle above a normal speed (here 40 mph), for constant hill climbing force and speed in constant torque region, the arodynamic drag force also increases proportional to the square of velocity. Hence the ease of climbing a particular slope in a constant speed reduces and so does the gradability. As the vehicle speed goes below the normal speed (here 30mph) aerodynamic drag force reduces for a constant hill climbing force and motor torque, whill will result in the increasing acceleration force and the speed increases to 30mph. Hence the vehicle can not run under the velocity of about 25 mph and above the velocity of 85 mph.
Again the entire analysis is made on a constant slope (6%) and time of run (10 sec).