Week 3.5 - Deriving 4th order approximation of a 2nd order derivative using Taylor Table method
Aim: - To derive and write a program for in MATLAB for 4th order approximation for second order derivative by following methods-
- Central difference
- Skewed right sided difference
- Skewed left sided difference
Objective: - 1. To evaluate the second order derivative of the function f(x)=exp(x)cosx">f(x)=exp(x)cosx Using above mentioned order of approximations.
- To plot and compare the values and errors of the 3 methods derived.
Theory and derivations: -
During solving a CFD problem we may come across partial derivative equation which consists 2nd order derivative. Since due to complexity of the equation we may have to chose numerical approach rather than analytical. But when dealing with numerical approach we try to make the error margin as low as possible.
As the order of approximation get higher, we get higher accuracy. Hence, we are going to derive the three methods of approximation for an analytical function. The methods are following.
-
Central Difference Method:
In the central difference method, data is sampled symmetrically from both sides of the point of focus to approximate the second derivative (∂^2f/∂x^2) of a function. This approximation is derived using Taylor's method, and the formula is as follows:
∂^2f/∂x^2 = af(i-2) + bf(i-1) + cf(i) + df(i+1) + ef(i+2)
Here, "f(i)" represents the value of the function at the point of interest, and "a," "b," "c," "d," and "e" are coefficients that determine the weights of the nearby data points.
To determine the number of nodes considered in this central differencing method, you can use the following expressions:
For central differencing: N = p + q - 1
For skewed differencing: N = p + q
Where N is the number of nodes, p is the order of the derivative, and q is the order of approximation.
Taylor's Table for Central Difference:
A Taylor's table is used to calculate the coefficients (a, b, c, d, e) for the central difference method. The table provides values for the function "f(x)," its derivatives "dx f'(x)," "dx^2 f''(x)," "dx^3 f'''(x)," "dx^4 f''''(x)," and "dx^5 f'''''(x)," as well as the coefficients for the weights (a, b, c, d, e).
The coefficients are calculated as follows:
- a = -2a
- b = -b
- c = 0
- d = d
- e = 2e
The table is used to form a matrix equation of the form AX = B, where A is the matrix of coefficients from the table, X is the column vector [a, b, c, d, e], and B is the column vector [0, 0, 1, 0, 0]. Solving this matrix equation yields the values of the unknown coefficients.
After solving, the values of the coefficients are as follows:
- a = -0.0833
- b = 1.3333
- c = -2.5000
- d = 1.3333
- e = -0.0833
Skewed Left-Sided Difference:
1. In cases where the data points on the right side are unavailable, often encountered at boundary conditions, the skewed left-sided difference method is employed to approximate the second derivative (∂^2f/∂x^2) of a function. The formula for this approximation is as follows:
∂^2f/∂x^2 = af(i-5) + bf(i-4) + cf(i-3) + df(i-2) + ef(i-1) + ff(i)
Here, "f(i)" represents the value of the function at the point of interest, and "a," "b," "c," "d," "e," and "f" are coefficients that determine the weights of the nearby data points.
A Taylor's table for the skewed right-sided difference is provided, which includes values for the function "f(x)," its derivatives "dx f'(x)," "dx^2 f''(x)," "dx^3 f'''(x)," "dx^4f''''(x)," and "dx^5f'''''(x)," as well as the coefficients for the weights (a, b, c, d, e, f).
The coefficients are calculated as follows:
- a = -5a
- b = -4b
- c = -3c
- d = -2d
- e = -e
- f = 0
Similar to the central difference method, this table is used to form a matrix equation of the form AX = B, where A is the matrix of coefficients from the table, X is the column vector [a, b, c, d, e, f], and B is the column vector [0, 0, 1, 0, 0, 0]. Solving this matrix equation yields the values of the unknown coefficients.
After solving, the values of the coefficients are as follows:
- a = -0.8333
- b = 5.0833
- c = 13.0000
- d = 17.8333
- e = -12.8333
- f = 3.7500
clear all
close all
clc
x = pi/3; % Point at which to evaluate the function and its derivative
dx = linspace(pi/10, pi/1000, 100); % Array of grid sizes (dx)
f = @(x) (exp(x) * cos(x)); % The analytical function
g = @(x) (-2 * exp(x) * sin(x)); % The analytical second derivative
d2f = g(x); % True value of the second derivative at x
func = f(x); % The value of the function at x
P = [1 1 1 1 1; -2 -1 0 1 2; 4/2 1/2 0 1/2 4/2; -8/6 -1/6 0 1/6 8/6; 16/24 1/24 0 1/24 16/24];
Q = [1 1 1 1 1 1; 0 1 2 3 4 5; 0 1/2 2 9/2 16/2 25/2; 0 1/6 8/6 27/6 64/6 125/6; 0 1/24 16/24 81/24 256/24 625/24; 0 1/120 32/120 243/120 1024/120 3125/120];
R = [1 1 1 1 1 1; -5 -4 -3 -2 -1 0; 25/2 16/2 9/2 2 1/2 0; -125/6 -64/6 -27/6 -8/6 -1/6 0; 625/24 256/24 81/24 16/24 1/24 0; -3125/120 -1024/120 -243/120 -32/120 -1/120 0];
C = [0; 0; 1; 0; 0];
D = [0; 0; 1; 0; 0; 0];
E = [0; 0; 1; 0; 0; 0];
cf1 = P \ C;
cf2 = Q \ D;
cf3 = R \ E;
central_diff = zeros(1, 100);
err_central = zeros(1, 100);
right_sdiff = zeros(1, 100);
err_right = zeros(1, 100);
left_sdiff = zeros(1, 100);
err_left = zeros(1, 100);
for i = 1:length(dx)
central_diff(i) = (cf1(1) * f(x - 2 * dx(i)) + cf1(2) * f(x - dx(i)) + cf1(3) * f(x) + cf1(4) * f(x + dx(i)) + cf1(5) * f(x + 2 * dx(i))) / (dx(i))^2;
err_central(i) = abs(central_diff(i) - d2f);
right_sdiff(i) = (cf2(1) * f(x) + cf2(2) * f(x + dx(i)) + cf2(3) * f(x + 2 * dx(i)) + cf2(4) * f(x + 3 * dx(i)) + cf2(5) * f(x + 4 * dx(i)) + cf2(6) * f(x + 5 * dx(i))) / (dx(i))^2;
err_right(i) = abs(right_sdiff(i) - d2f);
left_sdiff(i) = (cf3(1) * f(x - 5 * dx(i)) + cf3(2) * f(x - 4 * dx(i)) + cf3(3) * f(x - 3 * dx(i)) + cf3(4) * f(x - 2 * dx(i)) + cf3(5) * f(x - dx(i)) + cf3(6) * f(x)) / (dx(i))^2;
err_left(i) = abs(left_sdiff(i) - d2f);
end
subplot(2, 1, 1)
hold on
fplot(d2f, '--')
xlim([-0.05 0.35]);
plot(dx, central_diff, 'linewidth', 2, 'color', 'r');
plot(dx, right_sdiff, 'linewidth', 2, 'color', 'b');
plot(dx, left_sdiff, 'linewidth', 2, 'color', 'g');
legend('analytical value at x=pi/3', 'central diff.', 'right skewed diff.', 'left skewed diff.', 'location', 'best')
xlabel('Grid size (dx)');
ylabel('Value');
title('Comparison between value of derivative calculated by different order of approximation')
hold off
subplot(2, 1, 2)
loglog(dx, err_central, 'linewidth', 2, 'color', 'r');
hold on
xlim([.002 0.4]);
loglog(dx, err_right, 'linewidth', 2, 'color', 'b');
loglog(dx, err_left, 'linewidth', 2, 'color', 'g');
legend('central diff.', 'right skewed diff.', 'left skewed diff.', 'location', 'best')
xlabel('Grid size (dx)');
ylabel('Absolute error');
title('Comparison between 4th order approximation methods for error in calculating d2f/dx2');
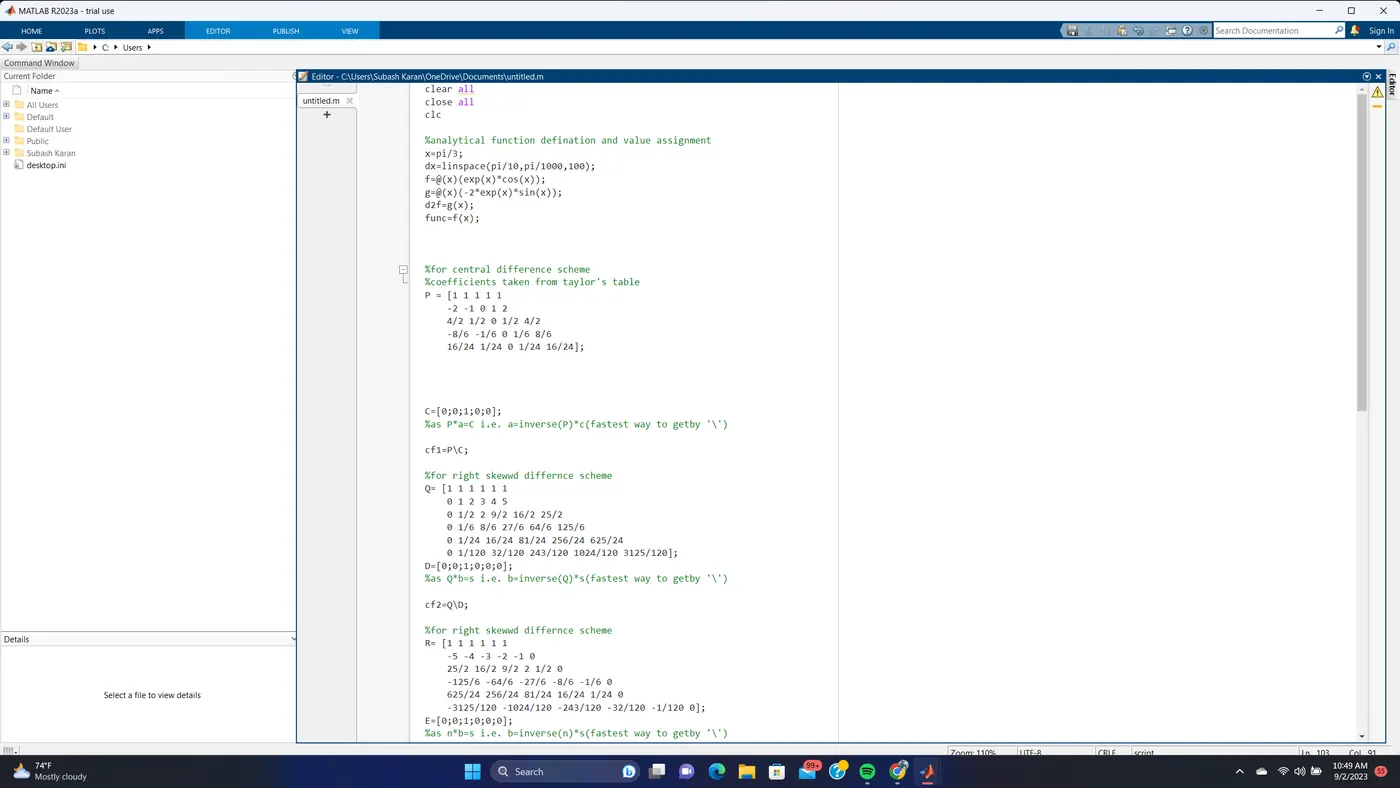
steps involved: -
- We assign the value of x and range of dx
- We define an anonymous function of analytical function and its derivative.
- Use the matrices from above discussed section and solved it using inversion method i.e.
AX=B ==> X=A-1 B
And stored the coefficients in cf1, cf2 and cf3.
- Assigned the rows and column to the appropriate matrices.
- Loop the order of approximation expression in a for loop under the range of dx . Here absolute error is also calculated from the derivative value calculated analytically.
- The calculated valued are plotted to do a better comparision.
Result:-
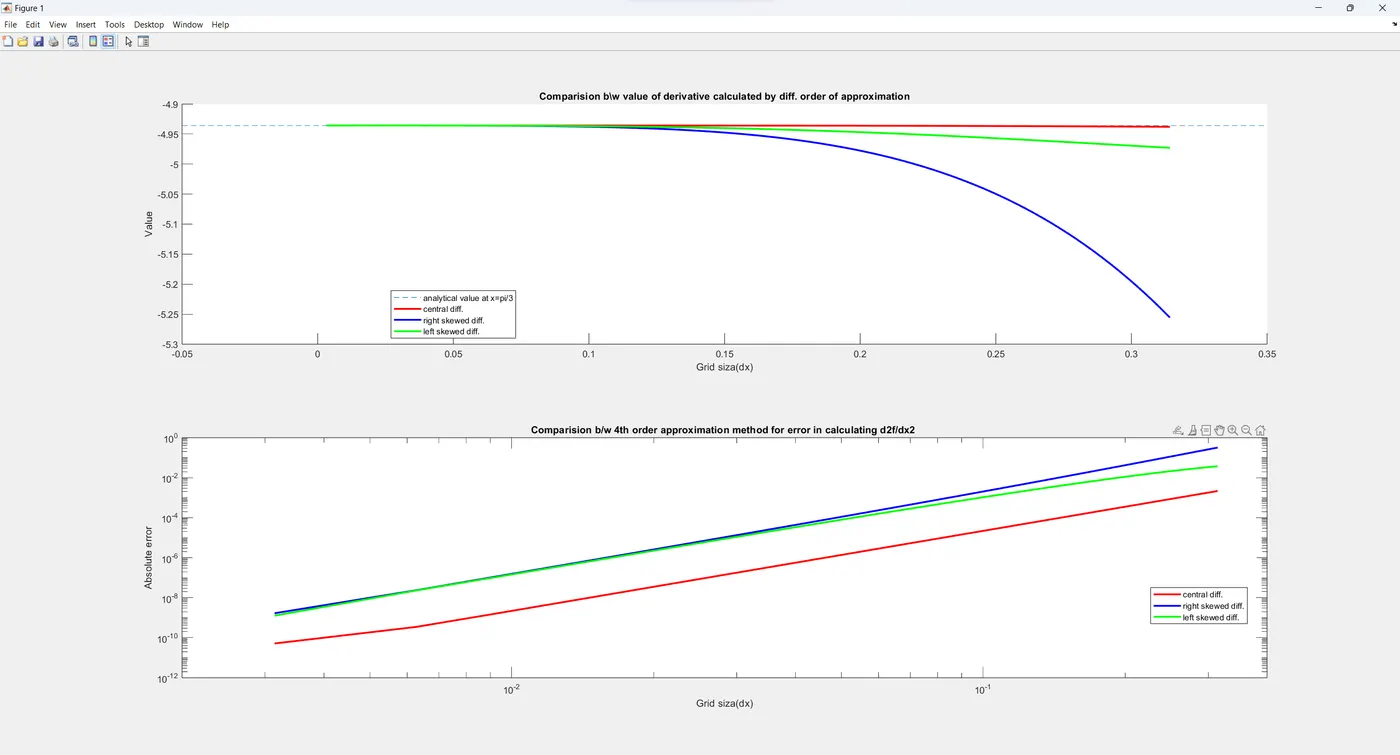
- In first plot we can see that the value of all the approximation approached toward the analytically calculated value as the size of dx gets smaller.
- On the second plot we can see that the error in the central difference is lowest with respect to other two.