Week 3.5 - Deriving 4th order approximation of a 2nd order derivative using Taylor Table method
The values of co-eff a,b,c,d,e,g for central 4th order approximation,right skewed and left skewed is obtained by taylers table
close all
clear all
clc
%function for 4th order approx useing second order derivative
%given function f(x) = exp(x)*cos(x)
x=pi/3;
%analytical_derivative
analytical_derivative = -2*exp(x)*sin(x);
dx= linspace(pi/3,pi/40000,1);
%values of co-eff from taylors table
for i=1:length(dx)
a=-0.083333;
b=1.3333333;
c=-2.500000;
d=1.333333;
e=-0.083333;
%numarical derivative
%central diff of 4th order apprx
central_diff_fourth_order_approx = ((a*exp(x-2*dx(i))*cos(x-2*dx(i)))+(b*exp(x-dx(i))*cos(x-dx(i)))+(c*exp(x)*sin(x))+(d*exp(x+dx(i))*cos(x+dx(i)))+(e*exp(x+2*dx(i))*cos(x+2*dx(i))))/(dx(i)^2);
error_central_diff =abs(central_diff_fourth_order_approx -analytical_derivative);

%function for right skewed for 4th order approx
%values of co-eff from taylores table
a=3.75000;
b=-12.83333;
c=17.83333;
d=-13.0000;
e=5.08333;
g=-0.83333;
%numarical derivative of right skewed diff
right_skewed_fourth_order_approx = ((a*exp(x)*cos(x)))+(b*exp(x+dx(i))*cos(x+dx(i)))+(c*exp(x+2*dx(i))*cos(x+2*dx(i)))+(d*exp(x+3*dx(i))*cos(x+3*dx(i)))+(e*exp(x+4*dx(i))*cos(x+4*dx(i)))+(g*exp(x+5*dx(i))+cos(x+5*dx(i)))/(dx(i)^2);
error_right_skewed = abs(right_skewed_fourth_order_approx-analytical_derivative);

%function for left skewed for 4th order approx
%values odf co-eff from teylors table
a=-0.8333;
b=5.08333;
c=-13.0000;
d=17.83333;
e=-12.83333;
g=3.75000;
%numarical derivative of left skewed
left_skewed_fourth_order_approx = ((a*exp(d-5*dx(i))*cos(d-5*dx(i))))+(b*exp(d-4*dx(i))*cos(d-4*dx(i)))+(c*exp(d-3*dx(i))*cos(d-3*dx(i)))+(d*exp(d-2*dx(i))*cos(d-2*dx(i)))+(e*exp(x-dx(i))*cos(x-dx(i)))+(g*exp(x)-cos(x))/(dx(i)^2);
error_left_skewed = abs(left_skewed_fourth_order_approx-analytical_derivative);
end
%plots
v=[dx,error_right_skewed,error_central_diff,error_left_skewed];
bar(v,0.8)
xlabel('dx')
ylabel('error')
outputs
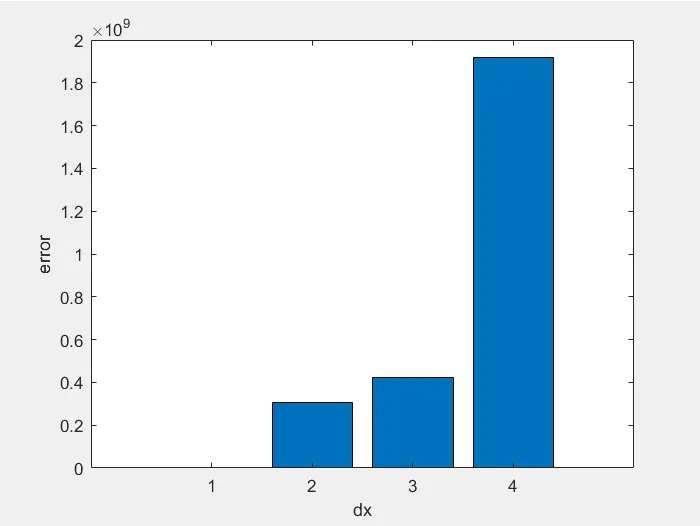
result:-
1)bar-1 right skewed
2)bar-2 central skewed
3)bar-3 is left skewed
from the above graph we can conclude that right skewed shows less error as compared to central and left skewed.