Week 3.2 - 2R Robotic Arm Challenge
Link of the google drive where the vedio has been saved:
https://drive.google.com/drive/folders/1qdJWROLS2JF55k4L-bVfNvtsMoSjsrEB?usp=share_link
Code used:
a) When we provide the value of theta1 and theta2 manually:
%forward kinematic of a robotic arm
clear all
close all
clc

% input values
l1=1;
l2=0.5;

% value of angles made by the link with respect to x axis
theta1=45;
theta2=30;

% Assuming the coordinate at the origin to be Zero for both x and y axis
x0=0;
y0=0;

% calculating the coordinates(x1;y1)
x1=l1*cosd(theta1);
y1=l1*sind(theta1);

% calculating the coordinate(x2;y2)
x2=x1+l2*cosd(theta2);
y2=y1+l2*sind(theta2);

%Plotting the value
grid on
line([x0 x1],[y0 y1],'linewidth',3, 'color', 'magenta')
line([x1 x2],[y1 y2],'linewidth',3, 'color', 'g')

% as we need to check the position of arm for different value of theta1 and theta2 so we have to create an array of theta1 and theta2.
Explanation:
1) in this program we tried to provide the value theta1, theta2, l1 and l2 manually
2) the value of x0 and y0 will be zero.
3) then we will calculate the value of x1, y1, x2 and y2 respevtively as per the formula should in the program
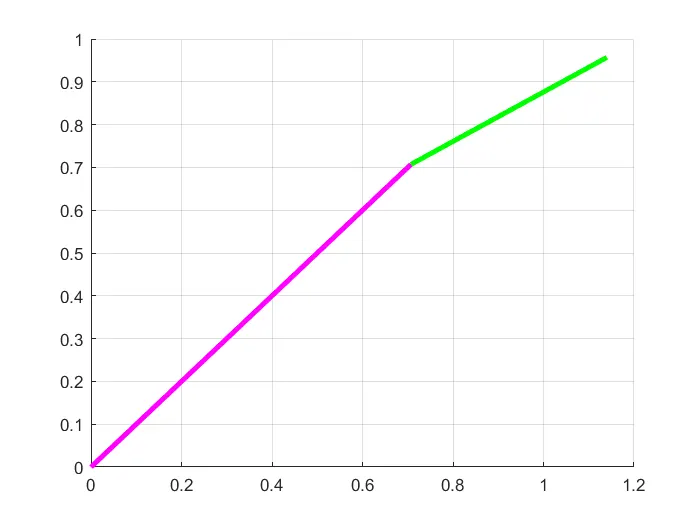
4) value of x and y at different points will provide us with the plot shown below
5) conclusion: but we can get only one position of the arm but to check the total span of the arm we will need its position at different value of theta1 and theta2
Output plot after executing the program:
So we will write the program which will calculate the value of theta1 and theta2 in the form of array
Program with value of theta1 and theta2 in the form of array and logic to make the movie:
clear all
close all
clc

%Input
l1=1;
l2=0.5;
    % different values of theta has to be assumed in between 0 to 90
    theta1=linspace(0,90,10);
    theta2=linspace(0,90,10);

% we will plot the graph for each value of theta1 and theta2, and complile them together into a vedio for animation

% using for loop for selecting the each value of theta1 and theta2
ct=1; % its a loop counter used so that we can get each plot in proper sequence so we
       can create the animation

for i=1:length(theta1)     % this will select each value seperately from theta1 array
    THETA1 = theta1(i);    % this will create the single vector from a array so we can
                             use it in the fromula for calculation
    for j=1:length(theta2)  % this will select each value seperately from theta2 array
        THETA2 = theta2(j);

        % Assuming the coordinate at the origin to be Zero for both x and y axis
          x0=0;
          y0=0;

        % calculating the coordinates(x1;y1)
          x1=l1*cosd(THETA1);
          y1=l1*sind(THETA1);

        % calculating the coordinate(x2;y2)
          x2=x1+l2*cosd(THETA2);
          y2=y1+l2*sind(THETA2);

         % Plotting the value
          grid on
          plot ([x0 x1],[y0 y1],[x1 x2],[y1 y2],'linewidth',3)
          axis([-0.1 2 0 2])                % we are providing axis for graph plotting
          pause (0.2)         % this will provide the gap between the two frame so we
                               can see the animation in smooth manner
          M(ct)=getframe(gcf); % we can get seperate plot for different value of theta1
                                 and theta2, so when we couple them all we can create
                                 the animation
          ct=ct+1;             % this will provide the indexing to each plot seperately
    end
end

movie(M)                       % with the help of this command we can create animation
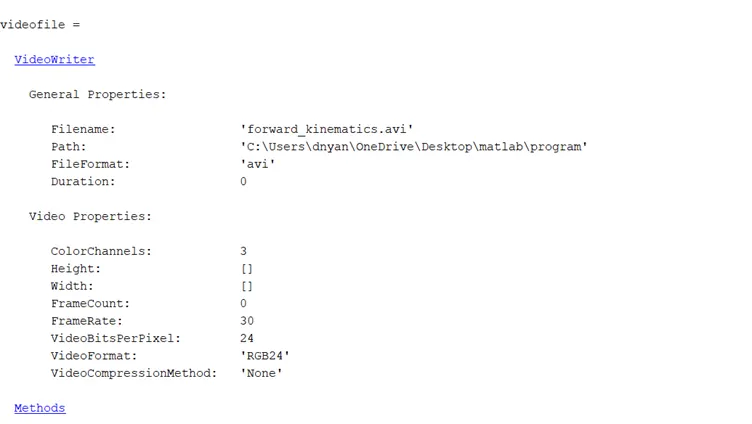
videofile=VideoWriter('forward_kinematics.avi', 'Uncompressed AVI')
                               % naming the file and specifying the format of vedio file
open(videofile)
writeVideo(videofile,M)         % it will create the vedio file from all the frame we
                                collected by excuting the line39
close(videofile)
Explanation:
1) in this we will create the array using 'linspace' command for theta1 and theta2 respectively from 0 to 90 degrees
2) loop counter (ct) has been provide so we can index the figure properly so we can arrange frames in the sequencial manner
3) Forloop is being used so we can select the individual value of theta1 and theta2 for calculation of the coordinates
4) THETA1 and THETA2 has been created because theta1 and theta2 are the arrays which has to converted to the vectors for substituting them into the formula
5) We have to plot the graph using the value calculated (x1,x2,y1,y2) for diferents value of THETA1 and THETA2
6) all the frames plotted has to be coupled into a set of sequential images so 'M' has been created to store all the frame in the sequential manner
7) ct=ct+1; this will provide the next plot in the sequence to the plot and work as indexing
OUTPUT after execution on the prgram: