Week 2 - Flow over a Cylinder.
AIM:
To Simulate the flow over a cylinder and phenomenon of Karman vortex street is explained.
OBJECTIVE :
* Simulate the flow with the steady and unsteady case and calculate the Strouhal Number for Re= 100.
* To Calculate the coefficient of drag and lift over a cylinder by setting the Reynolds number to 10,100,1000,10000 & 100000.
* The effect of Reynolds number on the coefficient of drag.
* To Plots of the coefficient of drag and lift.
* To Plots to show vortex shedding behind the cylinder.
THEOREY :
Vortex Shedding:
It is a phenomena when the flow crosses the bluff body, vortices are shed alternately from one side to the other, & where alternating low-pressure zones are generated to the downside of the bluff body giving rise to a fluctuating force acting at right angles to the flow direction. At high velocities, the opposing forces can cause the body to vibrate at a low frequency.
In simpler terms: Vortex shedding is when fluid flows over an object, creating an oscillating flow. In certain circumstances, this cross-flow can cause the object to vibrate.
Von Kamran Vortex Street:
The vortices which are sheded alternately from either side of the bluff body & it creates the pattern of swirling vortices. These pattern of swirling vortices are repeated periodically & its called as von kamran vortex street.
Depends on the force, the body might move towards the direction of the force. If the bluff body doesnt mounted rigidly on the structure than it will start vibrating with harmonic oscillations driven by the energy of the flow & if the vortex shedding frequency of the vibration reaches the frequency of the structural-vibration frequency of the body than the body start resonating. This phenomenon is of major importance in engineering design because the alternate formation and shedding of vortices also creates alternating forces, which occur more frequently as the velocity of the flow increases.
When the frequency is in the audible range, a sound can be heard and the body appears to sing. Many structures failed because of this phenomena. Because of this effect, it is very important to study the vortex sheding to make sure performance of the components will not affect by the vortex shedding. The strouhal number has been used while studying this type of phenimena.
Reynolds Number (Re):
Reynolds number is a dimensionless quantity that is used to determine the type of flow pattern as laminar or turbulent while flowing through a pipe. Reynolds number is defined by the ratio of inertial forces to that of viscous forces.
Reynolds number for a flow is a measure of the ratio of inertial to viscous forces in the flow of a fluid around a body.
Re = rho*V*d/Dynamic Viscosity
The range of Re values will vary with the size and shape of the body from which the eddies are being shed, as well as with the kinematic viscosity of the fluid. Over a large Red range (47<Red<105 for circular cylinders; reference length is d: diameter of the circular cylinder) eddies are shed continuously from each side of the circle boundary, forming rows of vortices in its wake. The alternation leads to the core of a vortex in one row being opposite the point midway between two vortex cores in the other row, giving rise to the distinctive pattern shown in the picture. Ultimately, the energy of the vortices is consumed by viscosity as they move further downstream, and the regular pattern disappears.
Strouhal number (St):
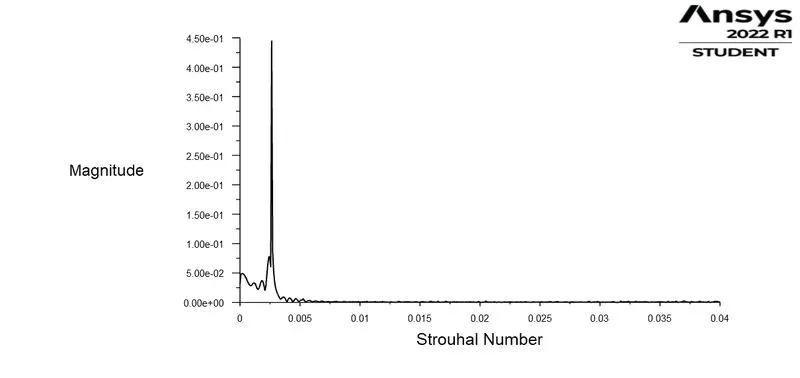
Strouhal number is a dimensionless number describing oscillating flow mechanisms.
The Strouhal number represents the ratio of inertial force due to the local acceleration of the flow to the inertial forces due to the convective acceleration.
The Strouhal number is often given as
St = f*d/u
Where,
f is the frequency of vortex shading,
L is the characteristic length and
U is the flow velocity.
For large Strouhal numbers (order of 1), viscosity dominates fluid flow, resulting in a collective oscillating movement of the fluid "plug". For low Strouhal numbers (order of 10−4 and below), the high-speed, quasi-steady-state portion of the movement dominates the oscillation. Oscillation at intermediate Strouhal numbers is characterized by the buildup and rapidly subsequent shedding of vortices.
PROCEDURE :
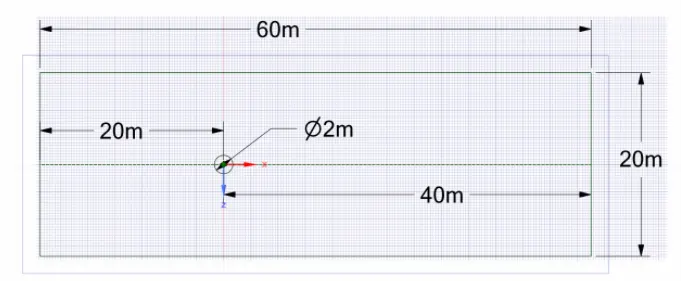
* Start by creating the geomentry using the space claimb tab by the given dimensions and convert it int 3D model by using the pull option. delet the cylinder surface.
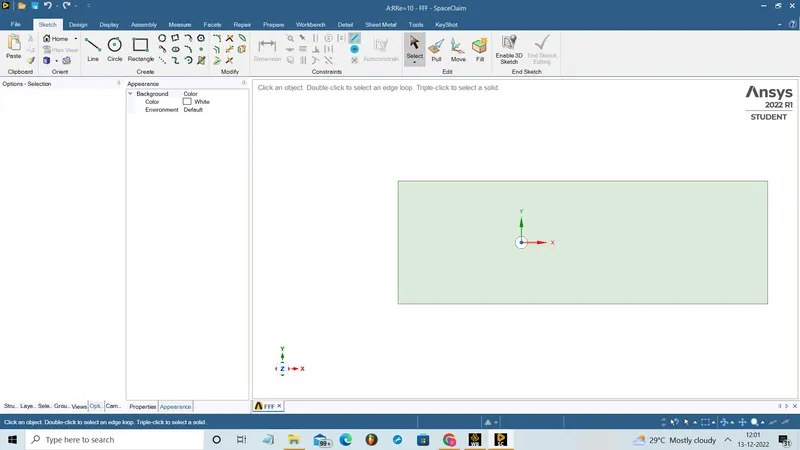
* After completing the geomentry open the mesh modul to mesh the model.
MESH PARAMETERS :
Element size=250mm,
Element type= linear tria element.
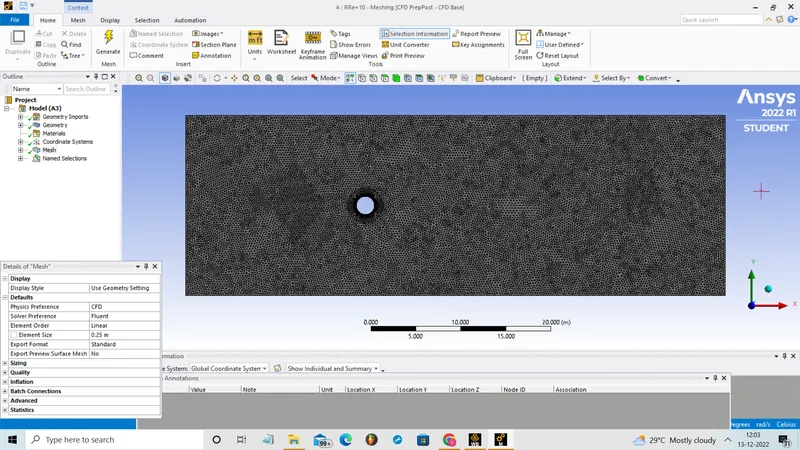
* Fine mesh is induced by using the size mesh option at the boundery of the cylinder to capture the effect properly.
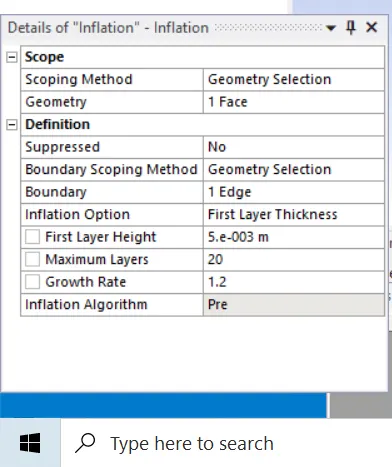
* Inflamation layer is created as per y+ value and criteria by using the structered mesh near the surface and followed by the unstructured mes to capture the effect properly near the surface. Name the model like input, output and symmentry.
* After the mesh open the set up modul and here we have to set the condition like physics, boundery conditions, type of analysics, Solution setups and the requried outups.
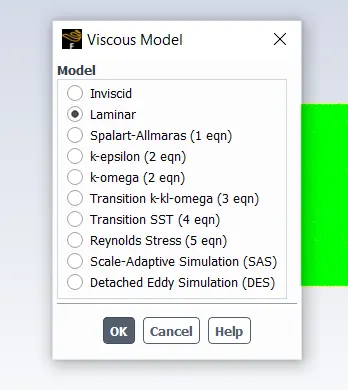
* In these we use the pressure based steady state simulation for case-1 and Select the realizable lamina model by opening the physics menu and select viscous model.
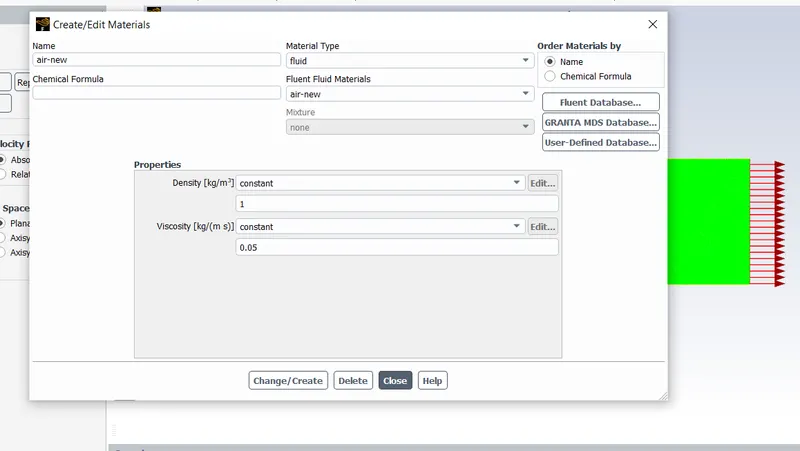
* Select air as working fluid by clicking the material option and change the default density and viscosity as 1kg/m^3 and 0.05kg/ms.
* Then we have to set the boundary conditions by the option boundries . select the inlet and set as 0.25 m for the case1 as Re=10 and all other can be default.
* CReate a point behind the cylinder at 8m distance from the origin.
* Then solution set up as to be made to get the coefficient lift report and the coefficient of drag and the average velocity at the point.
* These can be done by selecting solutions tab and select force report and select lift, drag. Similarly select the average velocity by selcting the vertex average from surface report in definitions menu.
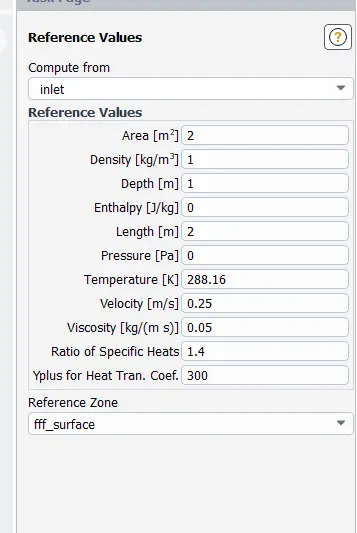
* Set the referance value.
* Select the method as the simple method and initialize it.
* Give 1000 iteration and if the solution is not converged and then increase the iteration and calculate it.
* Create the contours for pressure and velocity in the created plane.
* In the result option we can create the plots for pressure and velocity which is used to compare both the case.
* For the case 2,3,4,5 we can dubilicate the case 1 and just change the inlet velocity as per the Re no in the setup option.
* Similar, procedure as to carried out for all cases.
RESULT :
CASE-1
Simulation of flow for the steady condition for Re=10.
Calculate velocity for Reynolds number = 10
Inlet velocity=0.25
|
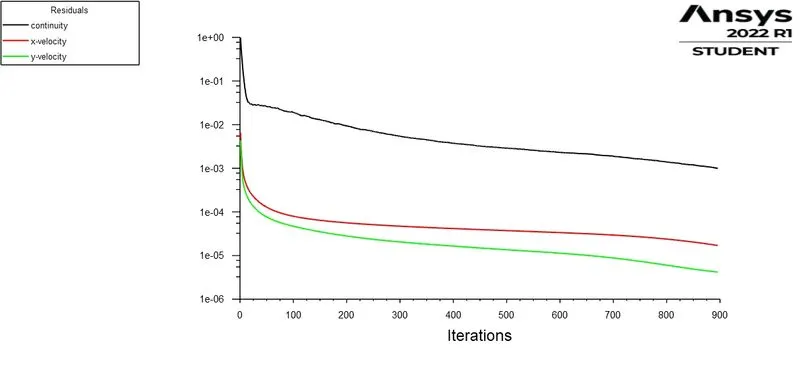
RESIDUAL PLOT |
COEFFICIENT OF LIFT |
|
COEFFICIENT OF DRAG |
AVERAGE VELOCITY AT THE POINT |
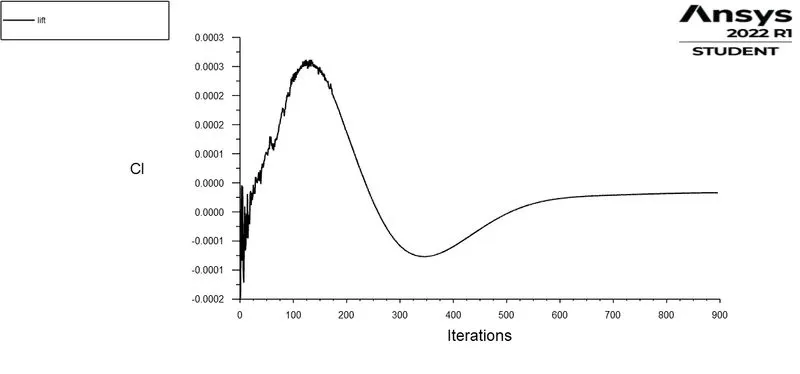
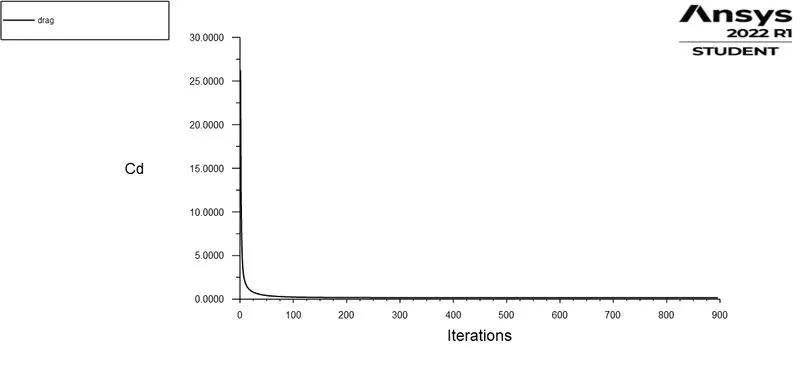
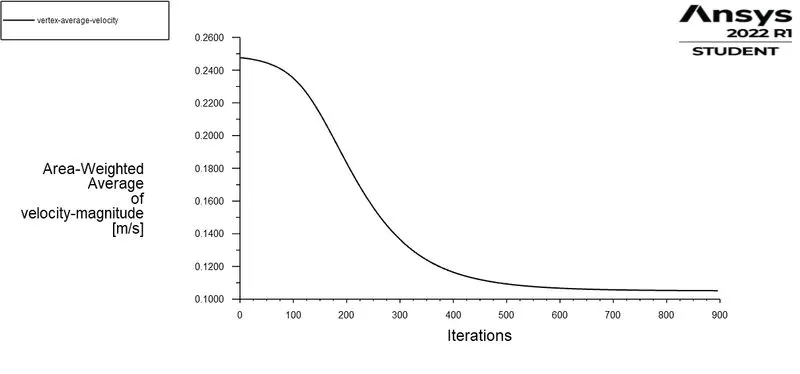
VELOCITY CONTOUR :
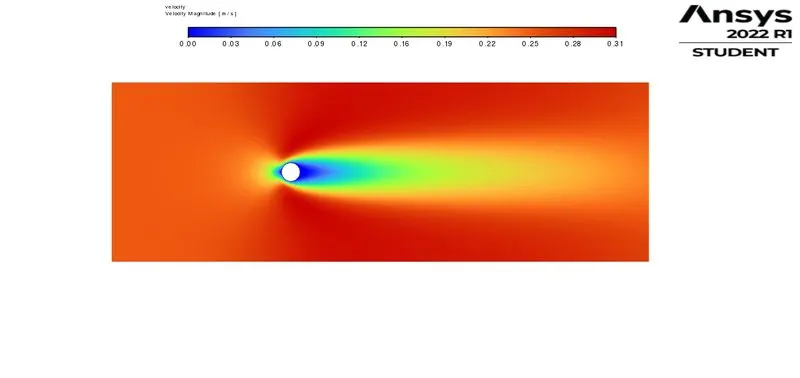
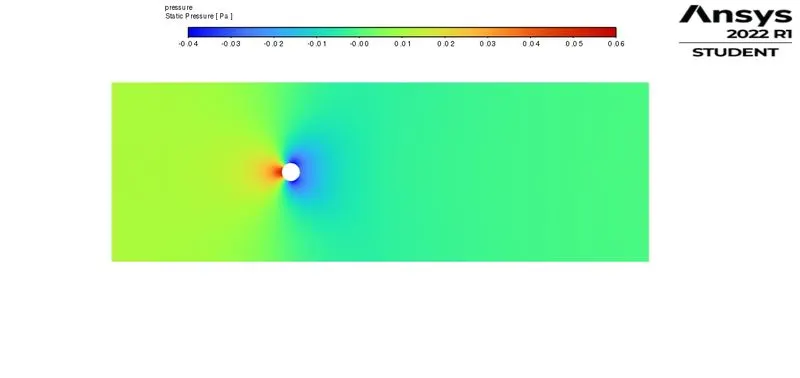
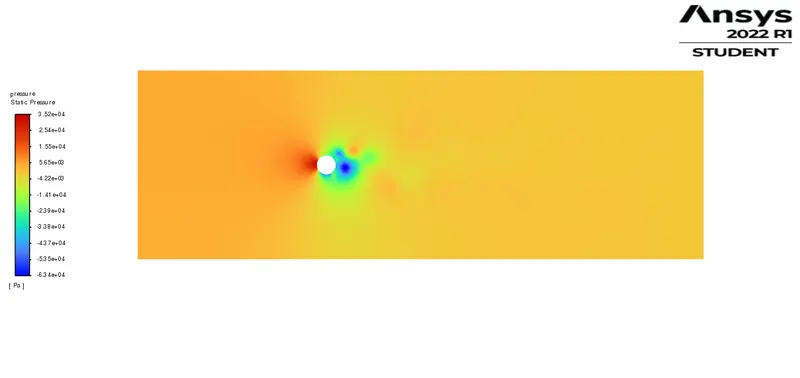
PRESSURE CONTOUR :
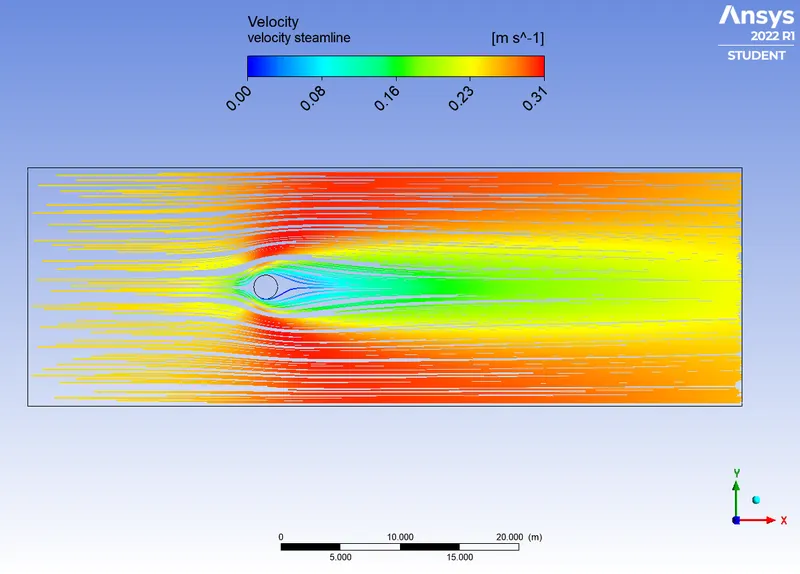
STEAMLINED VELOCITY :
CASE-2
Simulation of flow for the steady condition for Re=100.
Calculate velocity for Reynolds number = 100
Inlet velocity=2.5
|
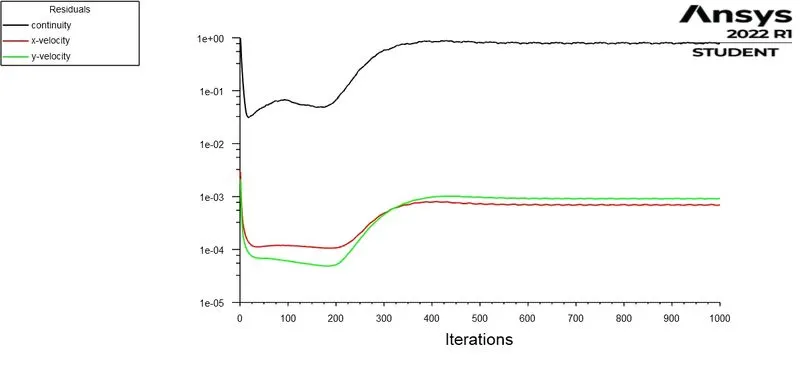
RESIDUAL PLOT |
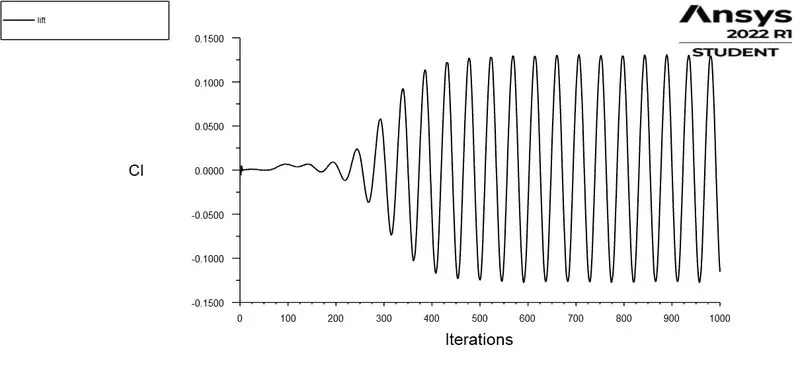
COEFFICIENT OF LIFT |
|
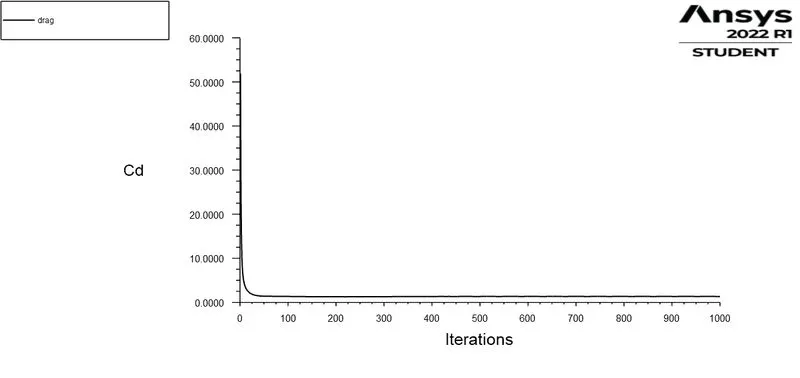
COEFFICIENT OF DRAG |
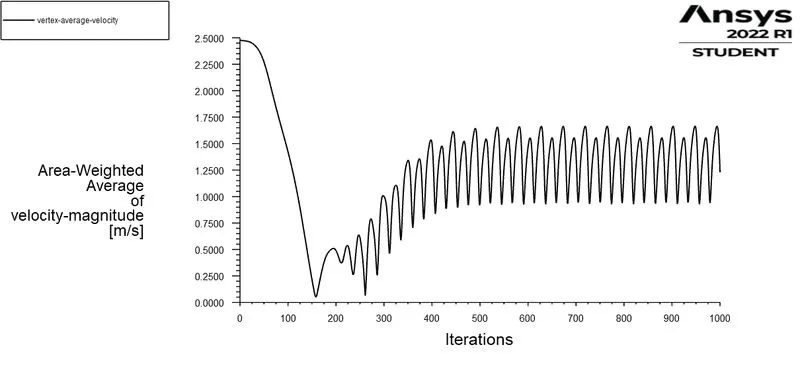
AVERAGE VELOCITY AT THE POINT |
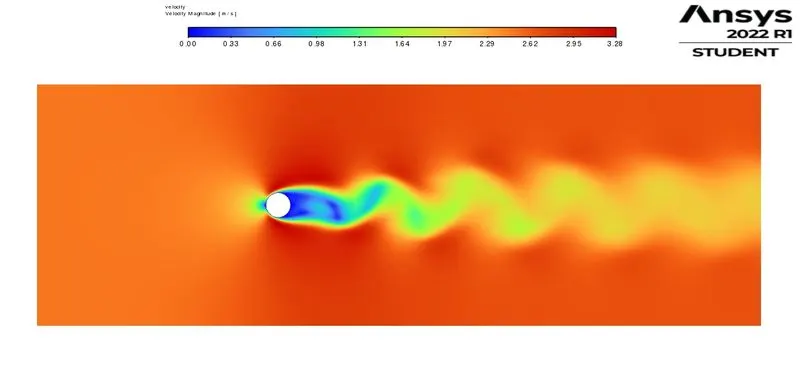
VELOCITY CONTOUR :
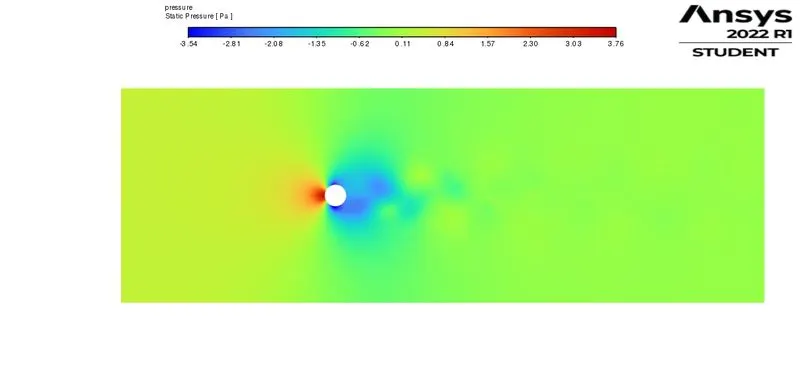
PRESSURE CONTOUR :
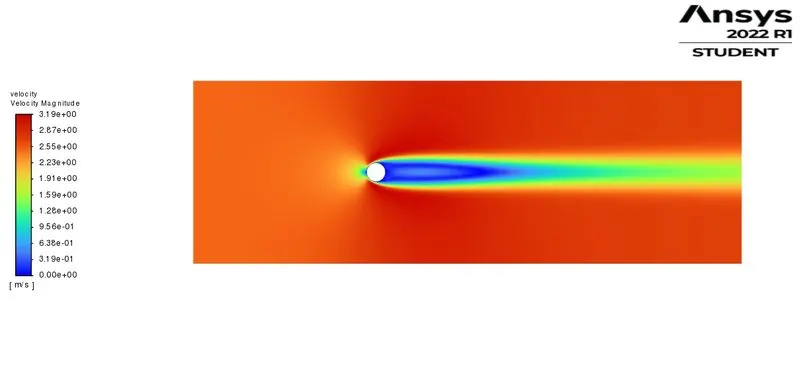
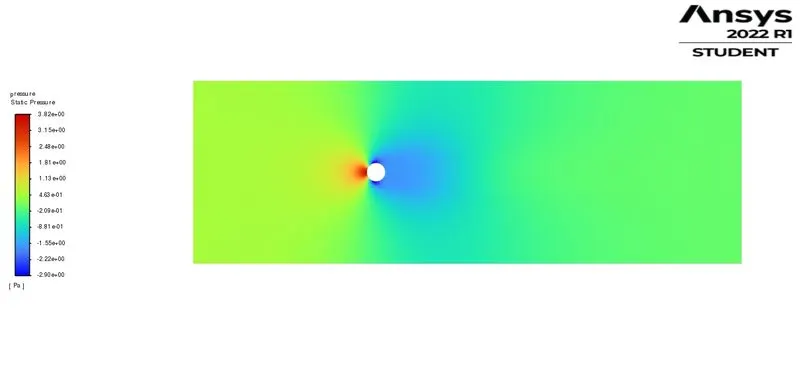
Simulation of flow for the unsteady condition for Re=100.
Calculate velocity for Reynolds number = 100
Inlet velocity=2.5
|
RESIDUAL PLOT |
COEFFICIENT OF LIFT |
|
COEFFICIENT OF DRAG |
AVERAGE VELOCITY AT THE POINT |
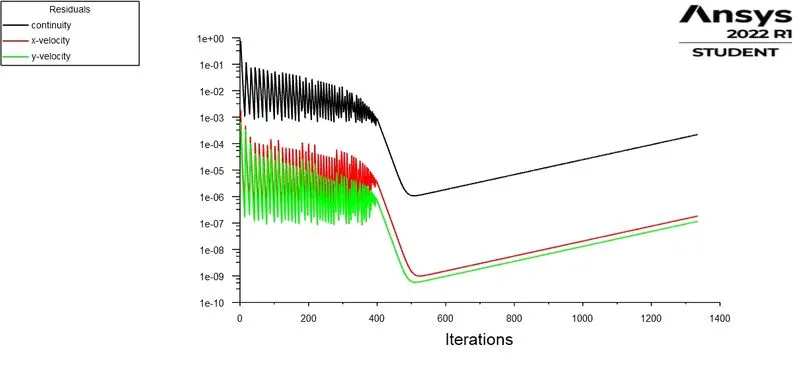
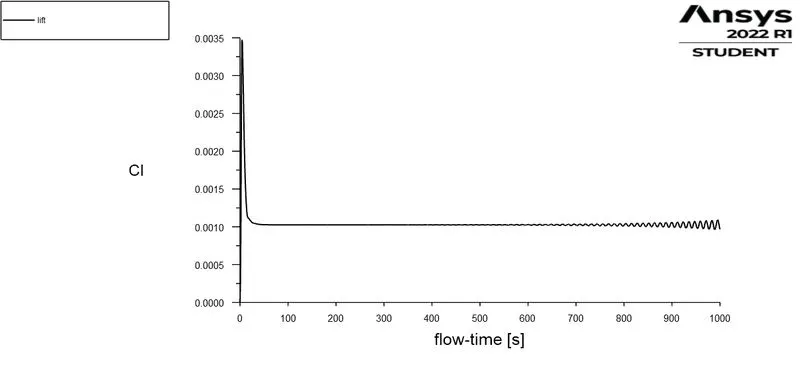
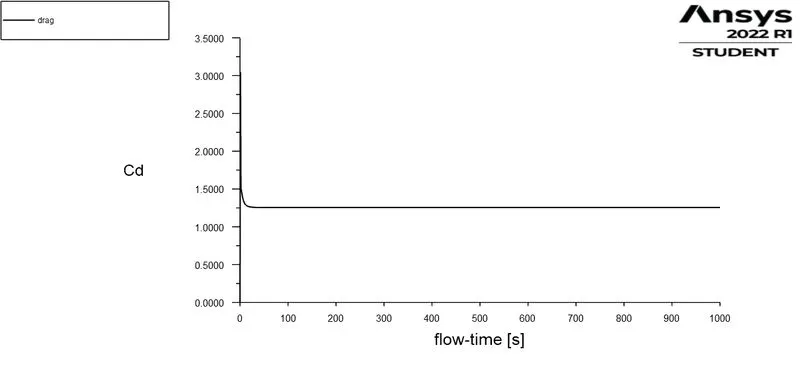
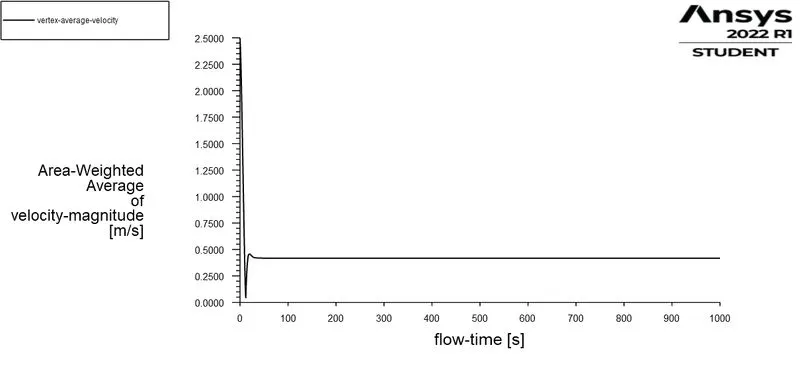
VELOCITY CONTOUR :
PRESSURE CONTOUR :
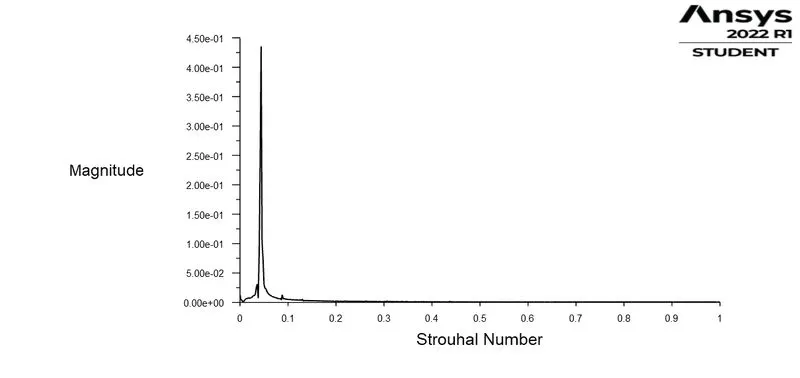
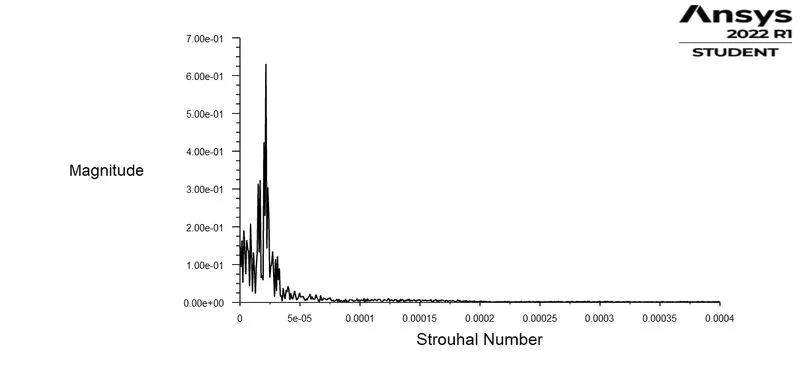
COMPARING THE STROUHAL NUMBER :
|
|
FOR UNSTEADY STATE (TURBULENT ) |
 FOR STEADY STATE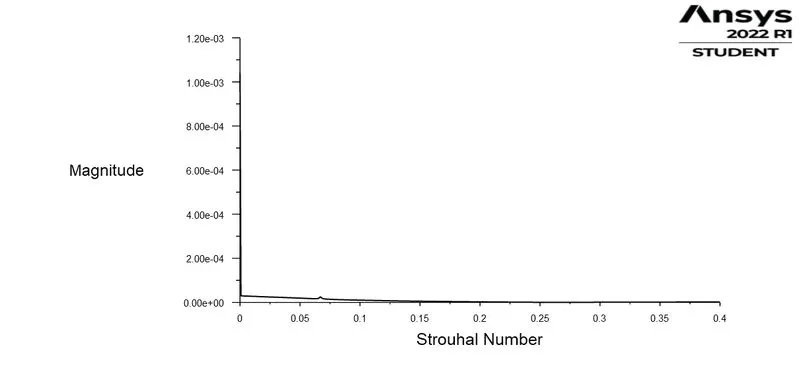
CASE-3
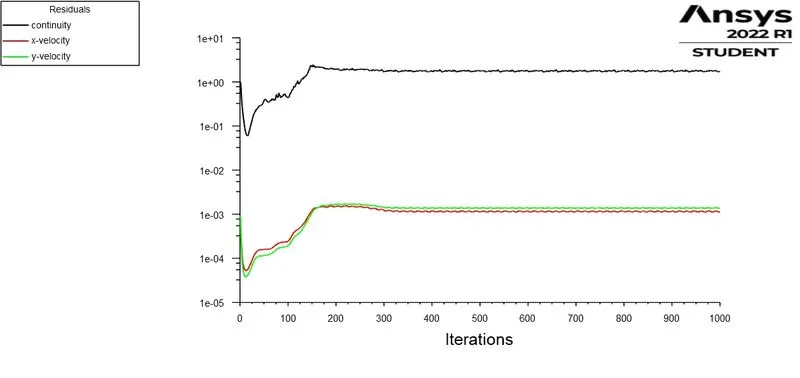
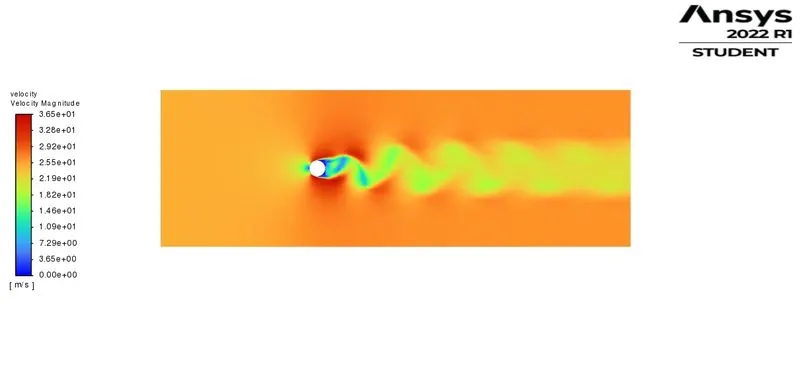
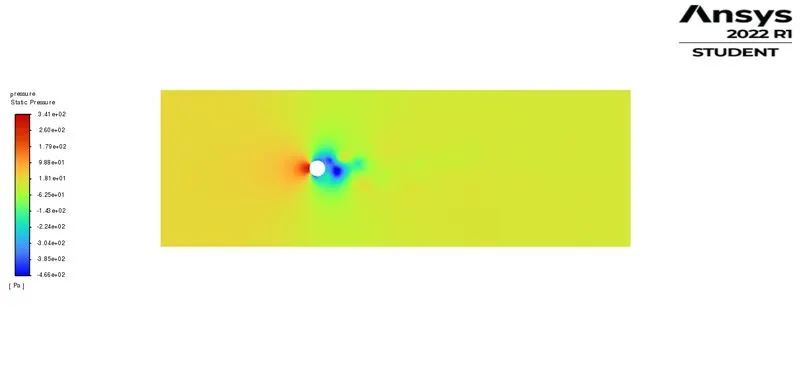
Simulation of flow for the steady condition for Re=1000.
Calculate velocity for Reynolds number = 1000
Inlet velocity=25
|
RESIDUAL PLOT |
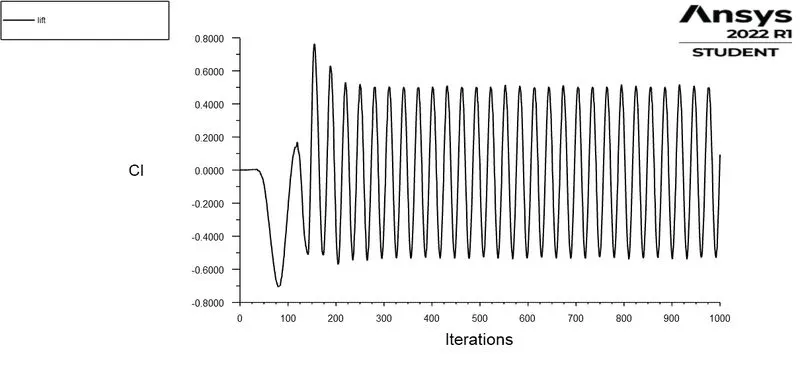
COEFFICIENT OF LIFT |
|
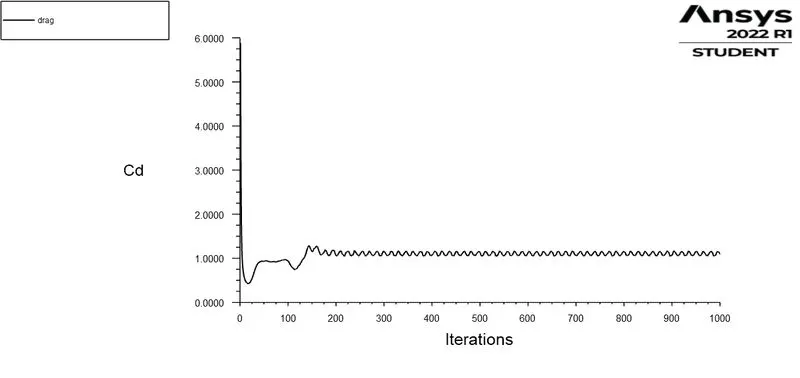
COEFFICIENT OF DRAG |
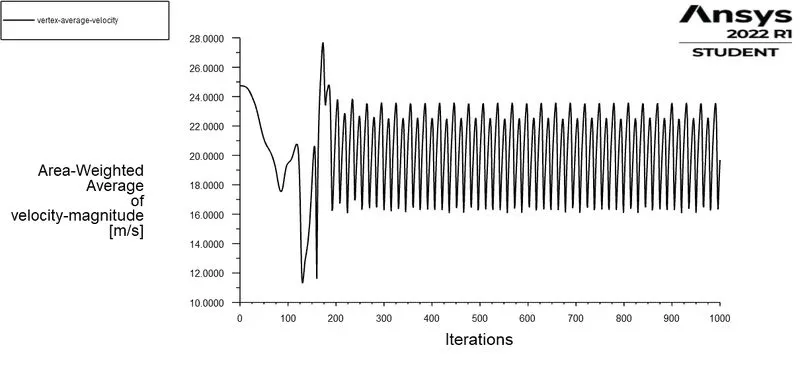
AVERAGE VELOCITY AT THE POINT |
VELOCITY CONTOUR :
PRESSURE CONTOUR :
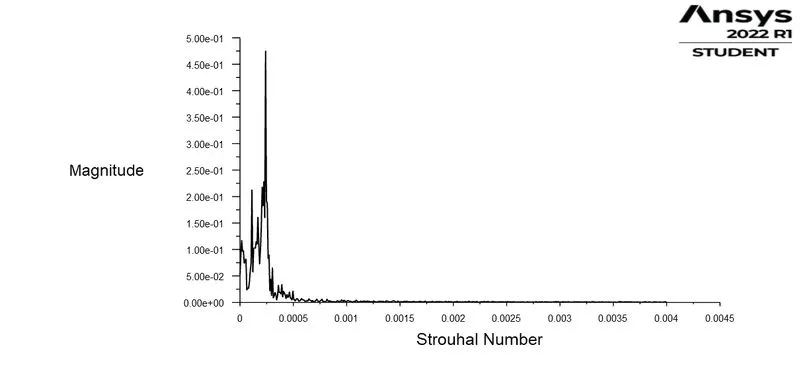
STROUHAL NUMBER :
CASE-4
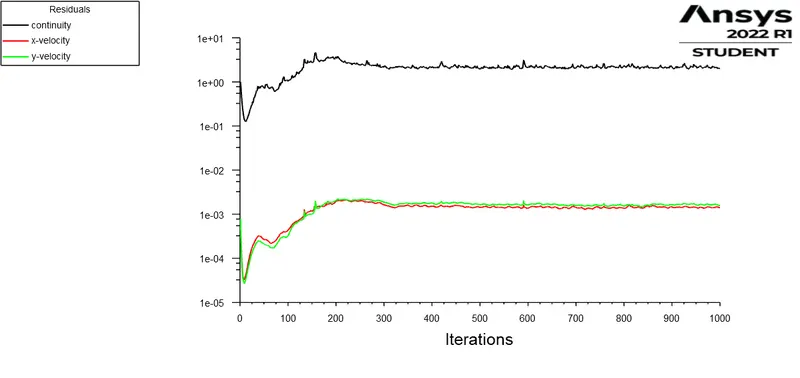
Simulation of flow for the steady condition for Re=10000.
Calculate velocity for Reynolds number = 10000
Inlet velocity=250
|
RESIDUAL PLOT |
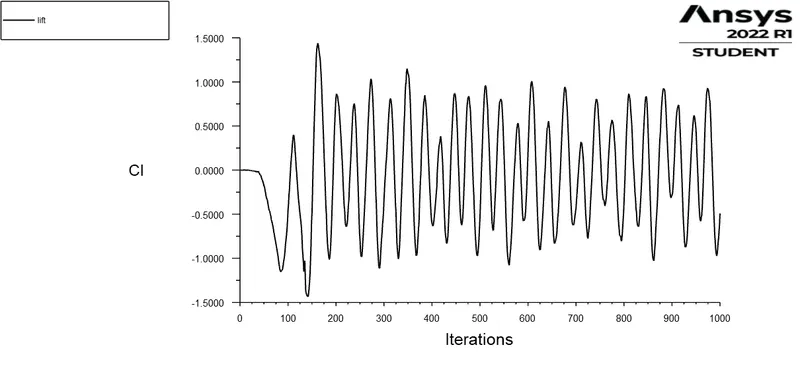
COEFFICIENT OF LIFT |
|
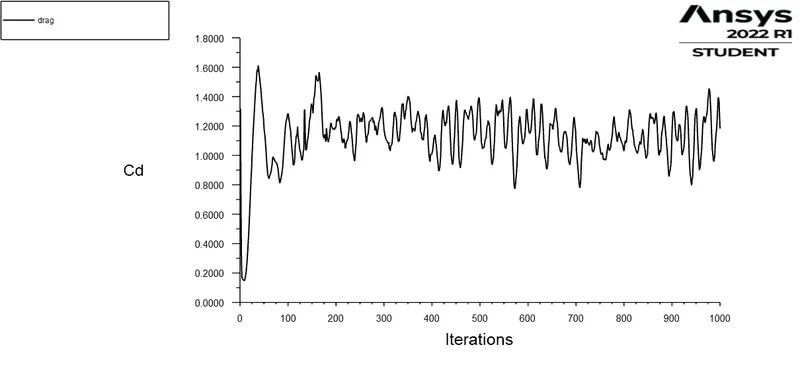
COEFFICIENT OF DRAG |
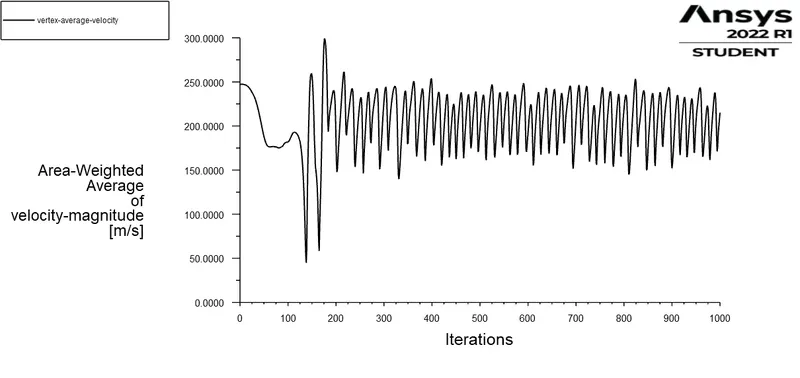
AVERAGE VELOCITY AT THE POINT |
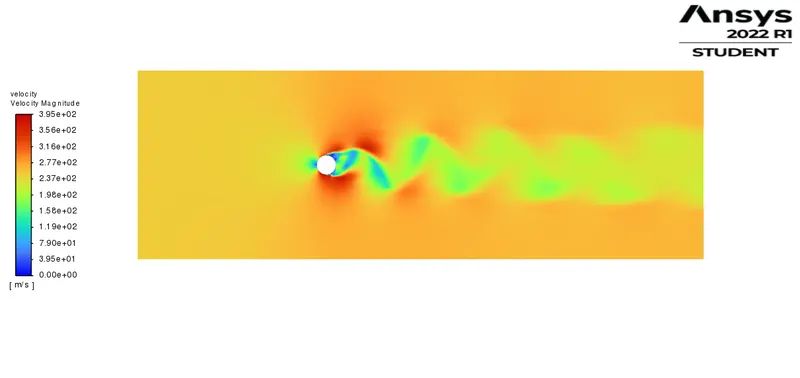
VELOCITY CONTOUR :
PRESSURE CONTOUR :
STROUHAL NUMBER :
CASE-5
Simulation of flow for the steady condition for Re=100000.
Calculate velocity for Reynolds number = 100000
Inlet velocity=2500
|
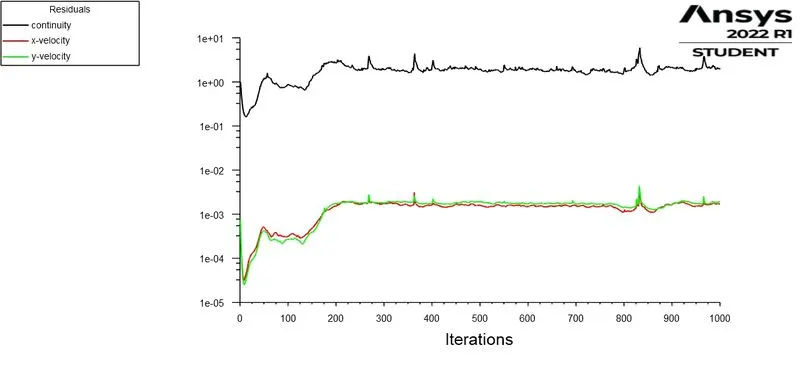
RESIDUAL PLOT |
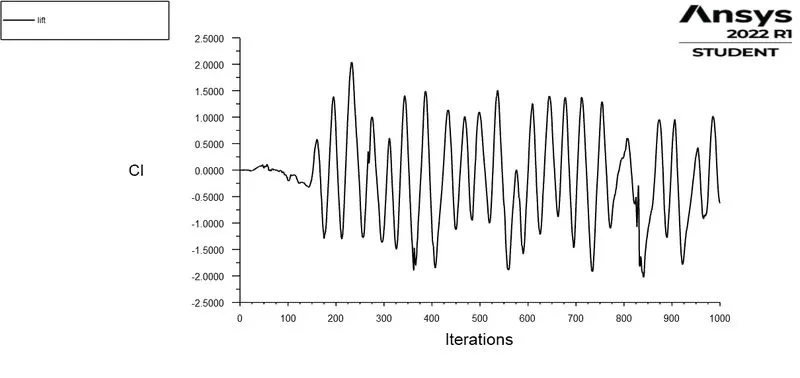
COEFFICIENT OF LIFT |
|
COEFFICIENT OF DRAG |
AVERAGE VELOCITY AT THE POINT |
VELOCITY CONTOUR :
PRESSURE CONTOUR :
STROUHAL NUMBER :
Drag Coefficient
The drag coefficient is a dimensionless factor of proportionality between the overall hydrodynamic force vector on a body in a liquid or gas flow and the product of the reference area of the body and velocity head.
Effect of Reynolds number on the drag coefficient.
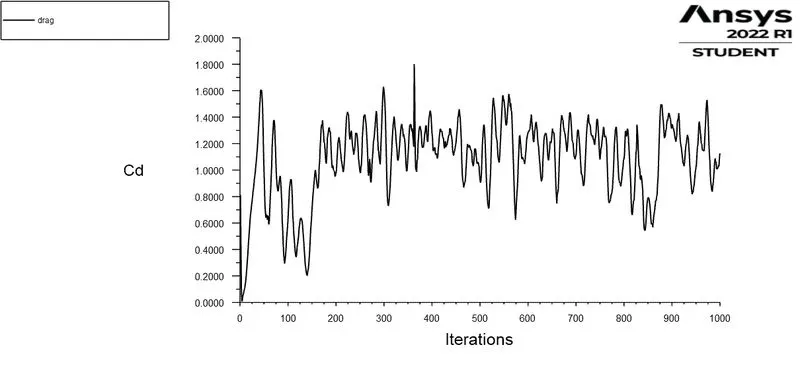
The above plots exhibit, drag plots for Reynolds number 10,100,1000,10000, and 100000. If the Reynolds Number is large, the viscosity effect is small. In practical values the inertia or density forces dominate, and the parasite drag increases with the square of the velocity. However, although the viscosity is unimportant, it may still affect the very thin boundary layer, leading to the creation of turbulent flow. Thus the importance of the Reynolds Number is that it tells us the type of flow we can expect. It tells you whether you can hope for having laminar flow over the wing and other parts of your airplane. A low Reynolds Number gives laminar flow while a high Reynolds Number gives turbulent flow. For both a laminar and a turbulent boundary layer increasing Reynolds Number gives lower skin friction drag. However, because of the higher energy loss in the boundary layer, a turbulent layer always has higher skin friction drag.
| REYNOLDS NUMBER | Cd(coefficient of drag ) | CL(coefficient of lift ) |
| 10 | 3.3378 | 0.0006467 |
| 100 (steady state ) | 1.456 | 0.00296 |
| 100( unsteady state ) | 1.432 | 0.00364 |
| 1000 | 0.723 | 0.2568 |
| 10000 | 0.9023 | 0.656 |
| 100000 | 1.865 | 0.491 |
CONCLUSION :
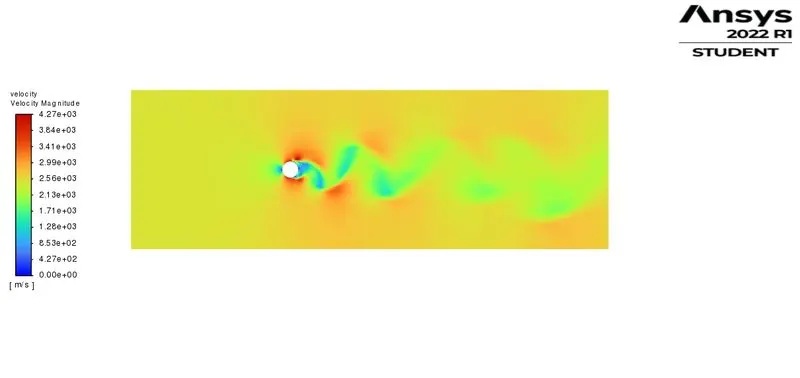
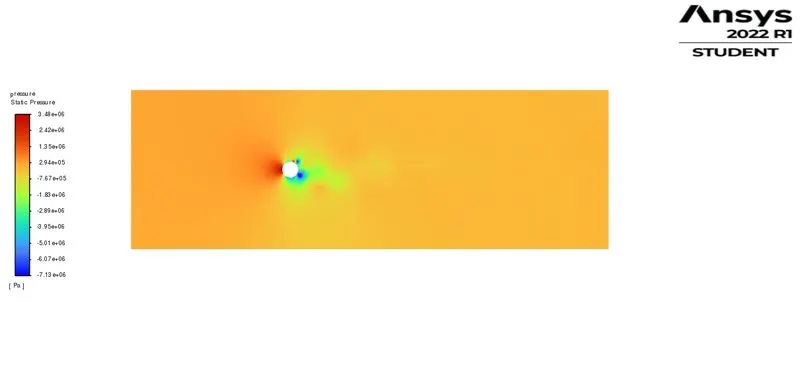
When fluid flows over cylinder, wake region is formed next to cylinder due to decrease in pressure and recirculation of flow occures and hence flow separation occures.
The time consumes by the transient solver is more than the steady state solver. For the transient simuations, the simualtion were running after turining off the convergence criteria. In transient mode, the more iterations are required to develop proper physics of the flow. Because of that the transient simuation has taken more iteration with smaller time steps compare to the steady state.
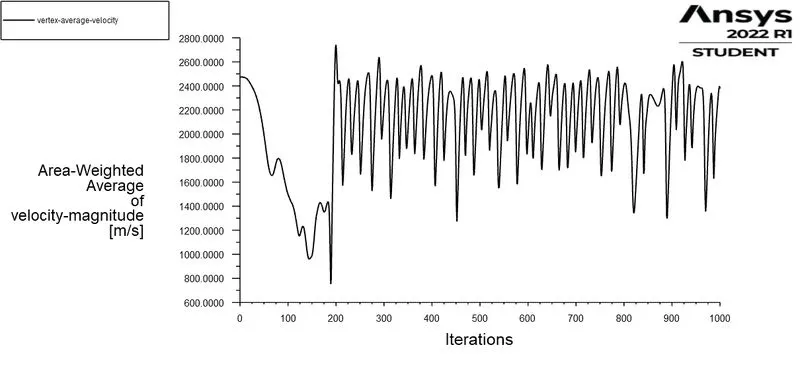
The drag coefficient for the Re above 1000, is start fluctuating but periodic after one point which can be seen from the results images. So statistically, it is constant.
The results of the simulations are the one we are expecting from the physics point of view.
As the Reynolds number increased further, the vortices are shed alternately from the upper and lower cylinder surface at a definite frequency depending on the Reynolds number. And for the value of Re more than 1000, the flow starts to transform from laminar to turbulent.Furthermore, as the Reynolds number increases the inertial forces start to dominate over viscous forces which leads to a significant increase in drag and also, a rise in fluctuation in the coefficient of lift.