Project 1 - Parsing NASA thermodynamic data
CHALLENGE REPORT:
AIM:
To write a function that extracts the co-efficients and calculates the enthalpy, entropy and specific heats and molecular weight for all the species in the data file.
OBJECTIVE:
* To write a function that extracts the co-efficients and calculates the enthalpy, entropy and specific heats for all the species in the data file.
* Calculate the molecular weight of each species.
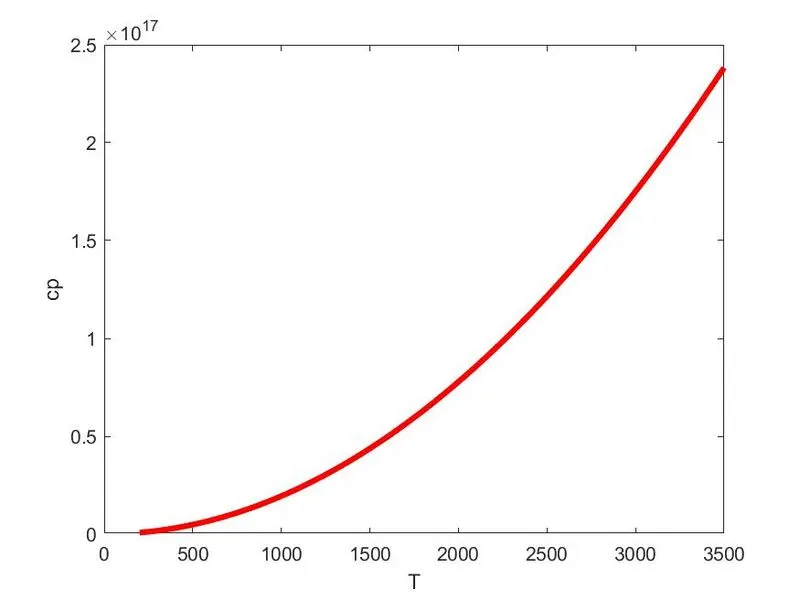
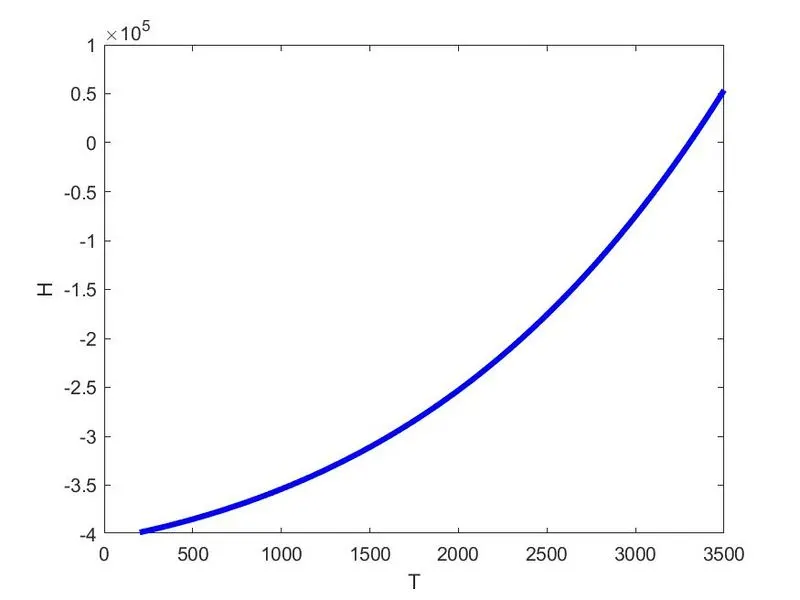
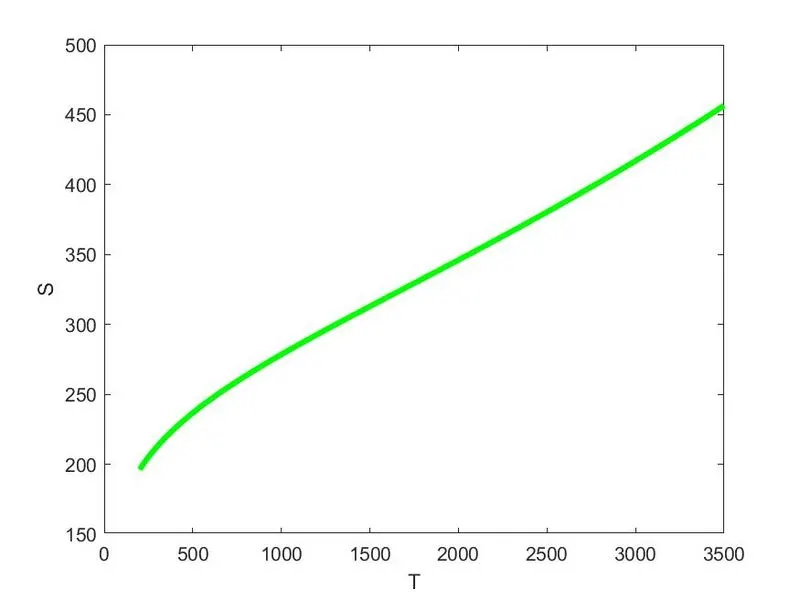
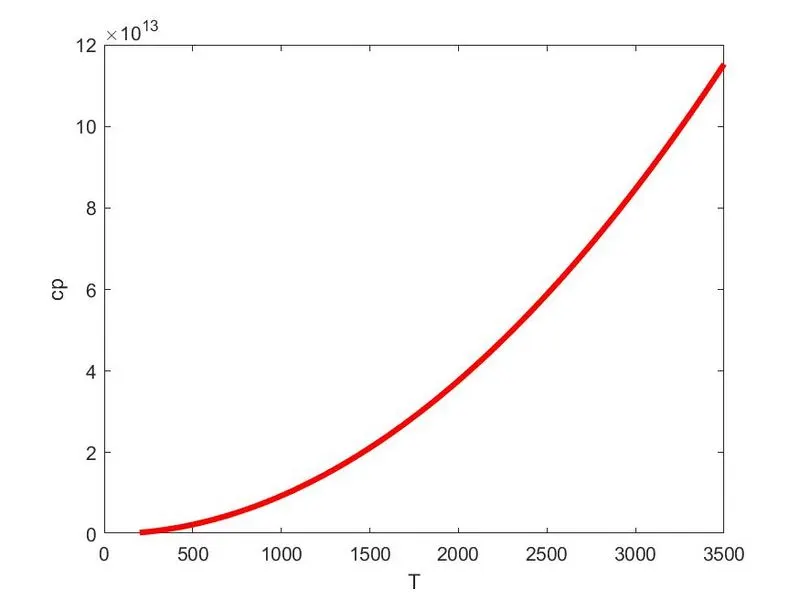
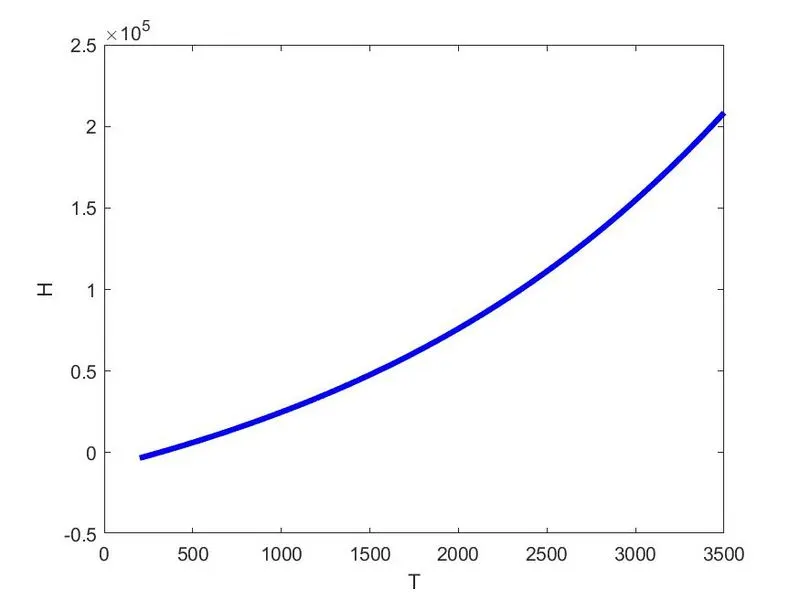
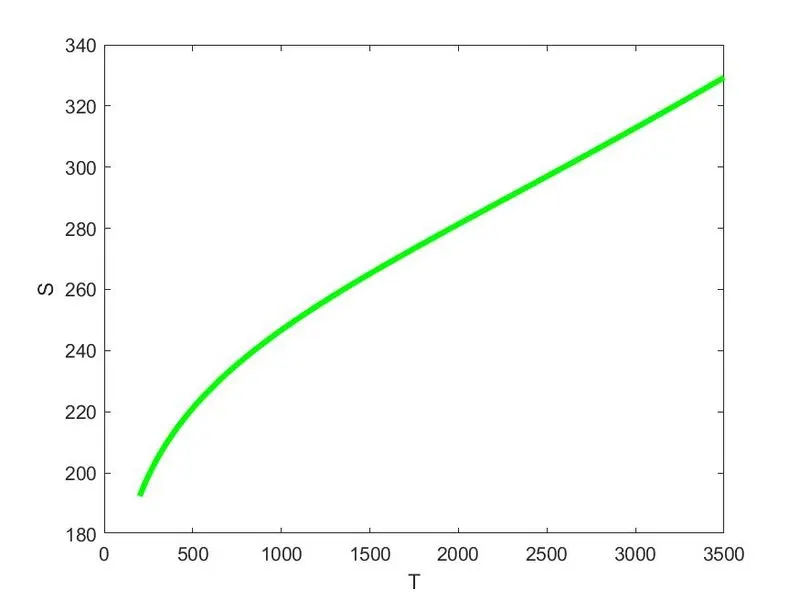
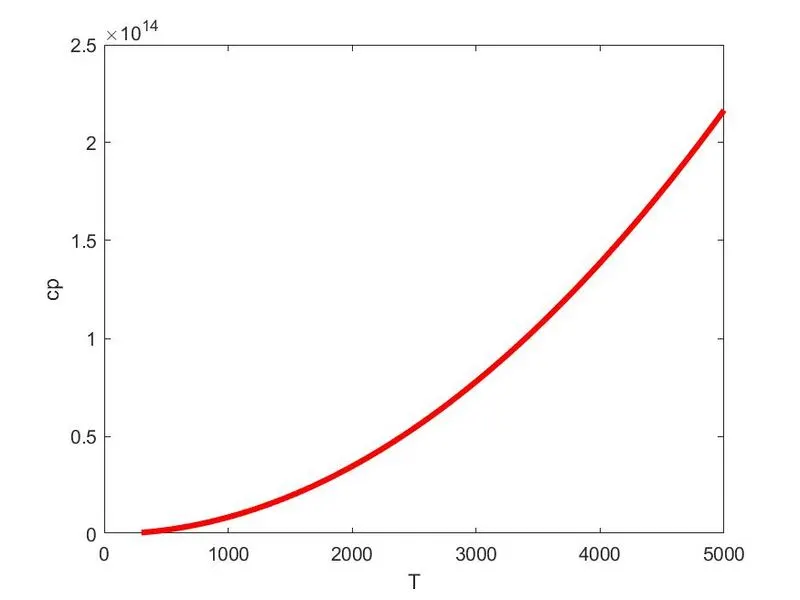
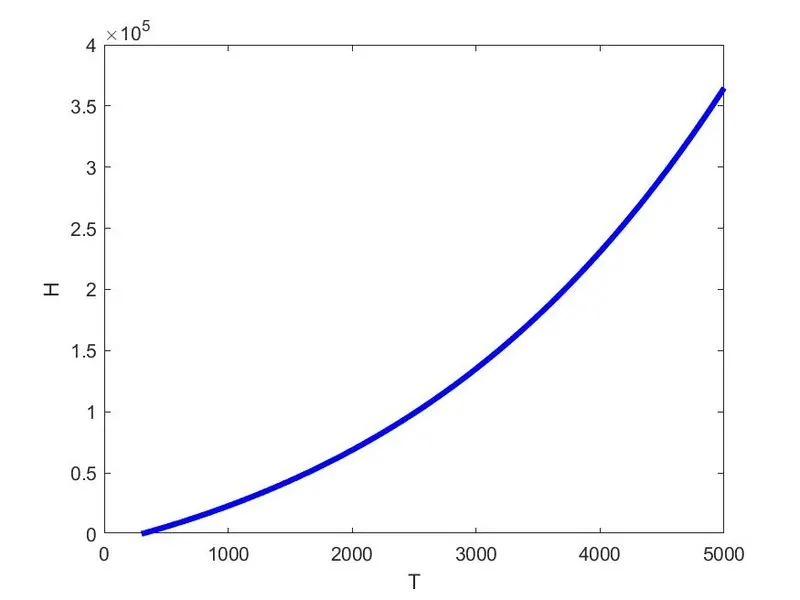
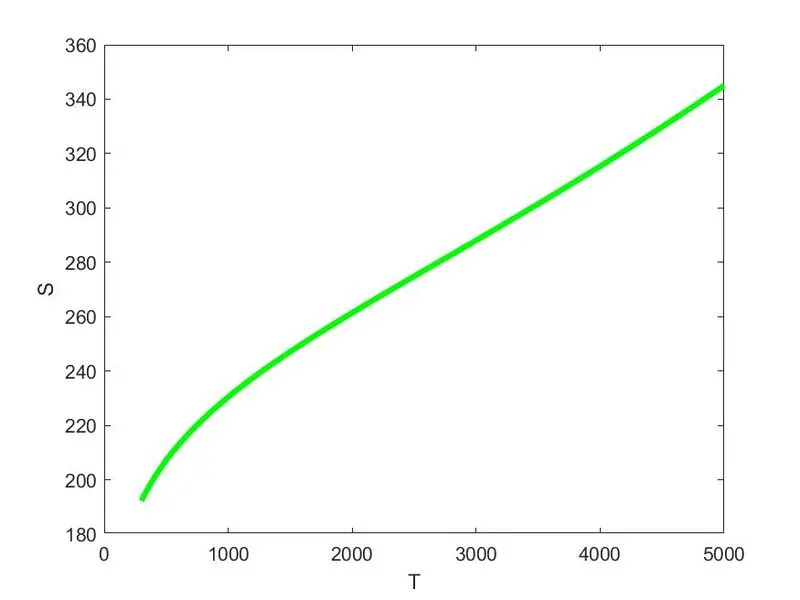
* To plot the Cp, Enthalpy and Entropy for the local temperature range specific for each species.
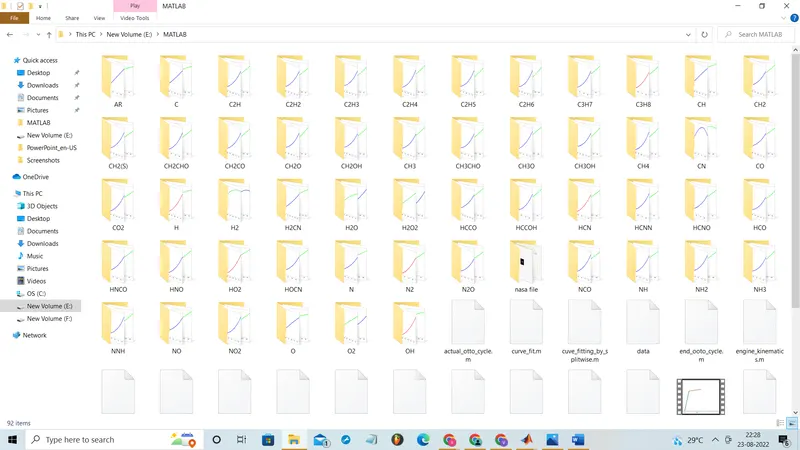
* To write code to save the plots as images with appropriate names and to dump them in separate folders for each species with suitable name automaticaly.
FORMULAS:
* Cp/R=a1+a2T+a3T2+a4T3+a5T4,
* H/RT= a1+a2T/2+a3T2/3+a4T3/4+a5T4/5+a6/T,
* S/R= a1ln(T)+a2T+a3T2/2+a4T3/3+a5T4/4+a7,
molecular weight = atomic weight* no. of atom
PROGRAMES IN MATLAB:
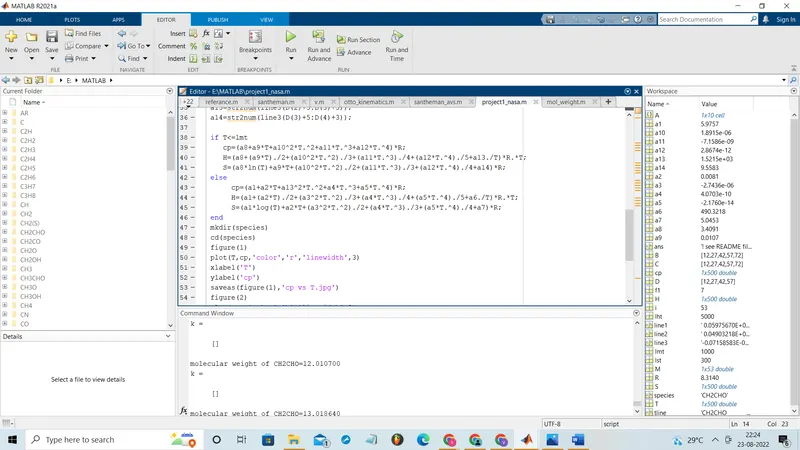
clear all
close all
clc
f1=fopen('THERMO.dat','r');
for i=1:5
fgetl(f1);
end
for i=1:53
tline=fgetl(f1);
A=strsplit(tline,' ');
species=A{1}
lst=str2num(A{end-3});
lmt=str2num(A{end-1});
lht=str2num(A{end-2});
T=linspace(lst,lht,500);
R=8.314;
line1=fgetl(f1);
B=strfind(line1,'E');
a1=str2num(line1(1:B(1)+3));
a2=str2num(line1(B(1)+4:B(2)+3));
a3=str2num(line1(B(2)+4:B(3)+3));
a4=str2num(line1(B(3)+4:B(4)+3));
a5=str2num(line1(B(4)+4:B(5)+3));
line2=fgetl(f1);
C=strfind(line2,'E');
a6=str2num(line2(1:C(1)+3));
a7=str2num(line2(C(1)+5:C(2)+3));
a8=str2num(line2(C(2)+5:C(3)+3));
a9=str2num(line2(C(3)+4:C(4)+3));
a10=str2num(line2(C(4)+5:C(5)+3));
line3=fgetl(f1);
D=strfind(line3,'E');
a11=str2num(line3(1:D(1)+3));
a12=str2num(line3(D(1)+5:D(2)+3));
a13=str2num(line3(D(2)+5:D(3)+3));
a14=str2num(line3(D(3)+5:D(4)+3));

if T<=lmt
   cp=(a8+a9*T+a10^2*T.^2+a11*T.^3+a12*T.^4)*R;
   H=(a8+(a9*T)./2+(a10^2*T.^2)./3+(a11*T.^3)./4+(a12*T.^4)./5+a13./T)*R.*T;
   S=(a8*ln(T)+a9*T+(a10^2*T.^2)./2+(a11*T.^3)./3+(a12*T.^4)./4+a14)*R;
else
     cp=(a1+a2*T+a13^2*T.^2+a4*T.^3+a5*T.^4)*R;
     H=(a1+(a2*T)./2+(a3^2*T.^2)./3+(a4*T.^3)./4+(a5*T.^4)./5+a6./T)*R.*T;
     S=(a1*log(T)+a2*T+(a3^2*T.^2)./2+(a4*T.^3)./3+(a5*T.^4)./4+a7)*R;
end
mkdir(species)
cd(species)
figure(1)
plot(T,cp,'color','r','linewidth',3)
xlabel('T')
ylabel('cp')
saveas(figure(1),'cp vs T.jpg')
figure(2)
plot(T,H,'color','b','linewidth',3)
xlabel('T')
ylabel('H')
saveas(figure(2),'H vs T.jpg')
figure(3)
plot(T,S,'color','g','linewidth',3)
xlabel('T')
ylabel('S')
saveas(figure(3),'S vs T.jpg')
cd ..
M(i)=mol_weight(species)
end
function wt=mol_weight(species)
comp_name=(species);
atm_name=['C','H','O','N','A'];
at_num=[12.0107,1.00794,15.994,14.0067,39.948];
wt=0;
for i=1:length(comp_name)
    for j=1:length(atm_name)
        if comp_name(i)==atm_name(j)
            wt=wt+at_num(j);
            pos=j;
        end
    end
    k=str2num(comp_name(i))
    if k>1
        wt=wt+at_num(pos)*(k-1)
    end
    fprintf('molecular weight of %s=%f',species,wt)
    disp('')
end
PROGRAM EXPLANATION :
i) Main code explanation :
* clear all, close all, clc is used to clear all the variable and plot that are created in the previous code.
* Using fopen command open the data file using the file name and read the file and store with variable f1
* For loop with variable i from 1 to 5 is used to read the 1st 5 lines int file using fgetl() and end it
* Create the new for with i variable 1 to 53.
* Using fgetl() command we read the next line (6th line).
* In 6th line using strsplit() command separate all the strings and store it in 'A" vaeriable.
* Get the species name and to get local high, local medium, local low temperature by A(1), A(end-3),A(end-2), A(end-1) using str2num() to convert string into number.
* Using fgetl() command we read the next line and using strfind() to get the position of 'E' and store it in B.
* Using B variable find the a1,a2,a3,a4,a5 using str2num() command.
* similarly find a6,a7,a8,a9,a10,a11,a12,a13,a14 .
* Using if condition T<=lmt find the Cp, H, S using the formula as per the condition.
* Plot cp vsT , H and H vs T and S vs T using plot command.
* To store the plot in folder for each species separately, use mkdir() to create new directory and cd() to change the directory and saveas() to save the figures and figure name in folders.
* for molecular weight calculation call the function mol_weight(species)
* end the loop
ii) Function code :
* Create a function with wt as function definition and mol_weight as function name with species as function variable.
* With comp_name, atm_name array , at_num array as input.
* create a for loop with i as variable range fro 1 to length(comp_name).
* create other for loop with j as variable range fro 1 to length(atm_name).
* Using if condition compare comp_name(i) and atm_name(j) and assign the molecular formula and store j in pos variable and end the if and 2nd loop.
* Using variable K convert string into number for comp_name(i) using str2num() command.
* using if condition k>1 find molecular weight (wt) using formula and end if.
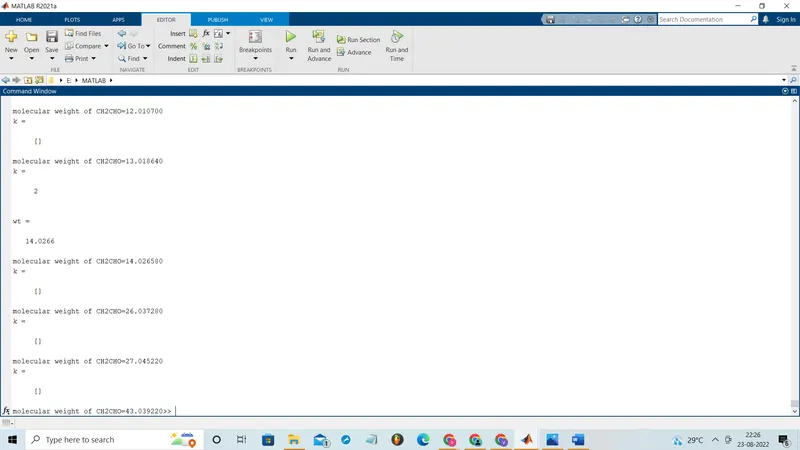
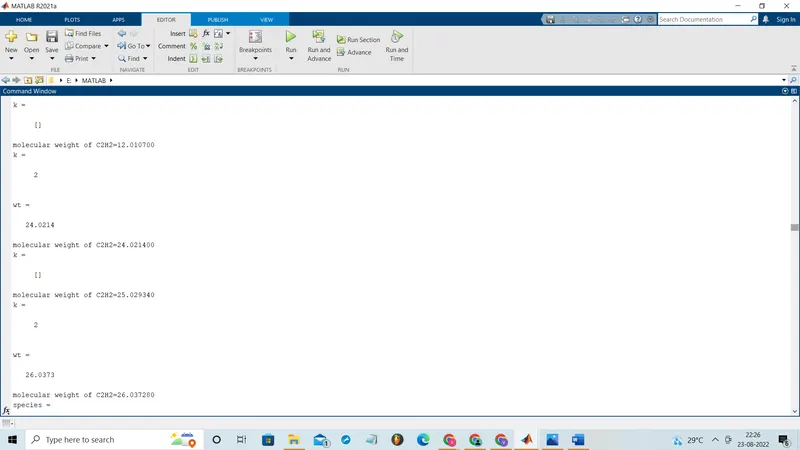
* And display molecular weight with respect to numerical and end the for loop and end the function.
OUTPUT:
i) O2 graphs:
ii)N2 graph :
iii)CO2 graph :