Week 2 - Flow over a Cylinder.
Aim: -
Simulate the flow over a cylinder and explain the phenomenon of Karman vortex street.
PART-I
- Simulate the flow with the steady and unsteady case and calculate the Strouhal Number for Re= 100.
PART-II
- Calculate the coefficient of drag and lift over a cylinder by setting the Reynolds number to 10,100,1000,10000 & 100000. (Run with steady solver)
- Discuss the effect of Reynolds number on the coefficient of drag. [ Results should be validated with any standard literature and error should be within 5 %]
Objective: -
- To setup case of steady state and Unsteady state simulation.
- To calculate Reynolds number and its significance over cylinder flow.
- To calculate lift and drag force over the cylinder region.
- To calculate the strouhal number and plot accordingly.
- To use Non-iterative time advancement method to lower the calculation time.
Vortex shredding:
It is a phenomenon when the wind blows across a structural member vortices are shed alternatively at certain frequency.This vortices create low pressure zone in the downwind side of the structure giving rise to fluctuating force acting at right angle to the wind flow.The frequency of vortex shredding can be calculated using strouhal no. In flow past a cylinder this vortex can be seen at onset of RE=47 and upto RE=400. This instability is called von-karman vortex. It is named after the engineer and fluid dynamicist theodore von karman.About reynold no 200 this vortex street becomes three-dimensional.
Its importance: For tall building structures, if subjected to wind blow then vortex shredding consideration is must. When wind hit the structure large vibrational amplitude is produced due to low pressure zone which is created by vortices on the downwind side of the object.This vibration is only a major concern if it happens to coincide with the natural frequency of the structure. For structures that are tall and uniform in size and shape, the vibrations can be damaging and ultimately lead to fatigue failure. By completing a vortex shedding analysis of structures under realistic wind loading, engineers can evaluate whether more efficient structures can and should be developed.
Pre-Processing step:
The model was designed in spaceclaim and below is the Fig. of the model we will be using for flow over cylinder.
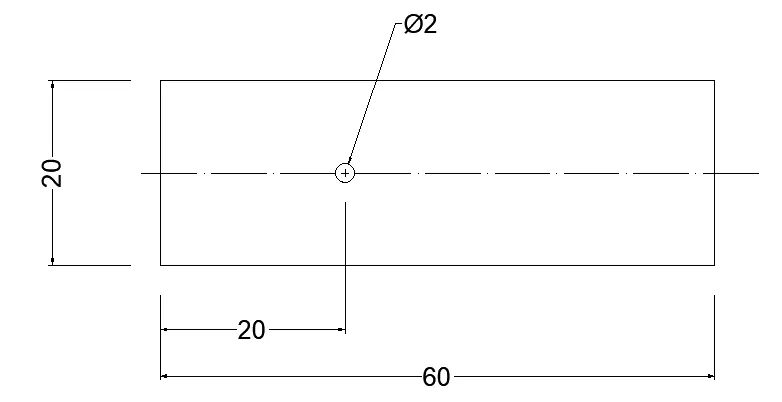
Fig. Flow over cylidner, All dimension are in (m).
The model was meshed using element size of 0.5m. Local mesh refinement was further done by using triangular method for proper meshing(smoothening) of the hole and also by adding sizing to hole.To capture the no-slip conditions properly inflation layer is set up. The details are shown in the image below.
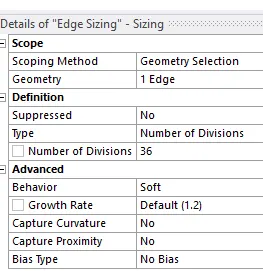
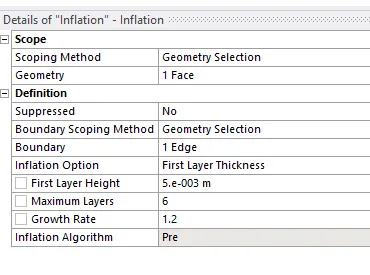
Fig: Edge Sizing Fig: Inflation
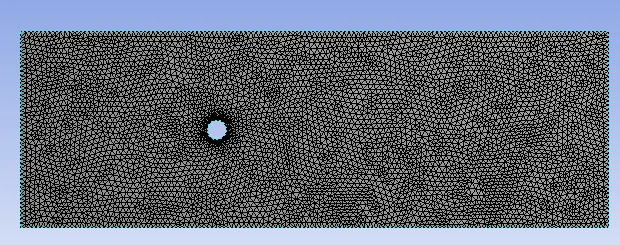
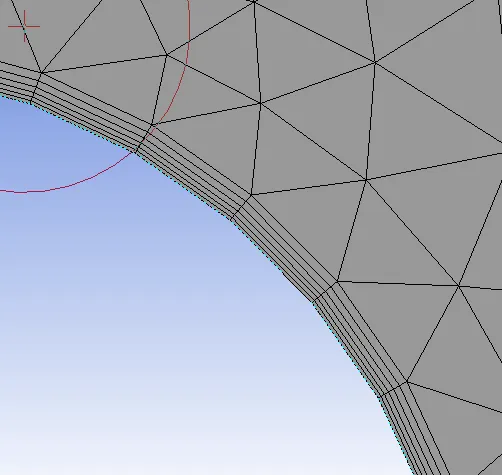
The quality of mesh was checked using mesh metric and result are acceptable for this simulations.
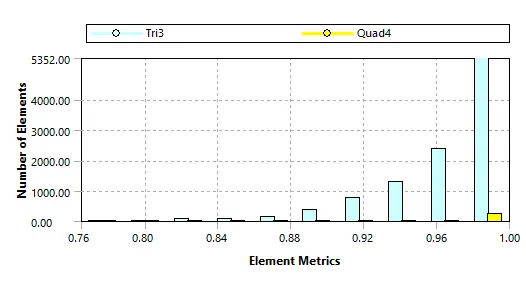
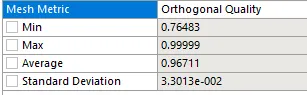
Fig: Orthogonal Quality
In fluent setup we will be running steady and transient case of this problem. As, the flow is laminar, so we will be using a viscous-laminar model for this simulations.
Materials : air
Properties: -density= 1kg/m^3 -viscosity=0.02 (kg/m-s)
For boundary conditions:
-Velocity inlet: 0.1,1,10,100,1000 m/s
-Outlet pressure: 0 Pa
-Wall: No slip condition
A probe is setup at locations (8,0) to monitor velocity and pressure.
For each case we need to plot drag coefficient (cd) and lift coefficient (cl)
PART 1: Simulate the flow with the steady and unsteady case and calculate the Strouhal Number for Re= 100.
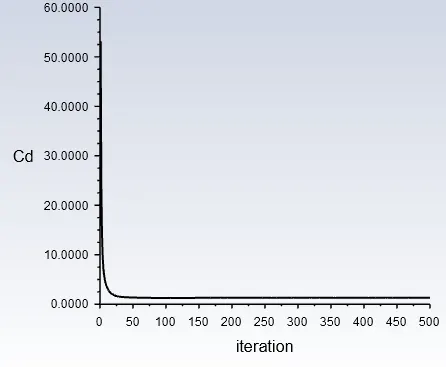
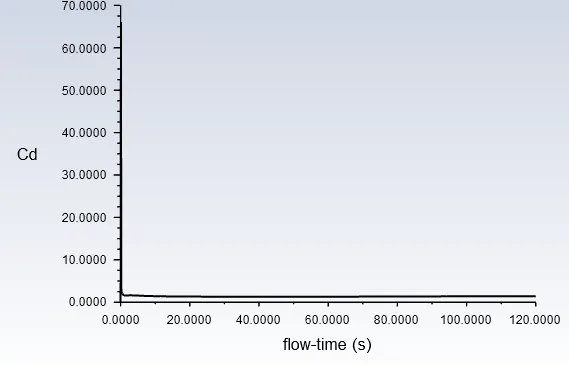
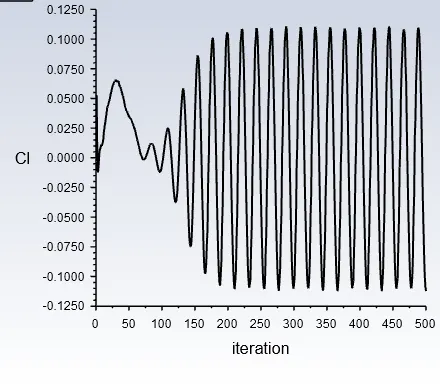
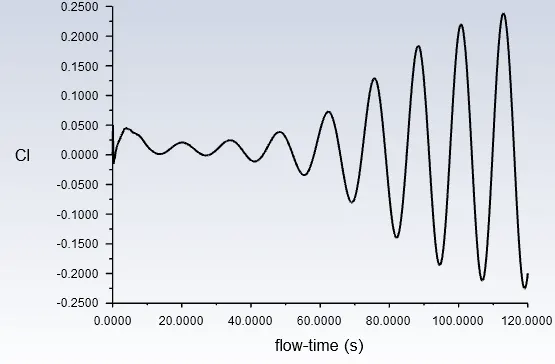
For steady state with RE=100 and inlet velocity =1 m/s the simulations was carried using 500 time step. For transient state with RE=100 and inlet velocity=1m/s the simulation was carried using at time steps size of 0.1 sec with 1200 no. of time steps which gives us simulation time of 120sec.The reference value were set before running the simulations to avoid any wrong result. The reference data is shown below.
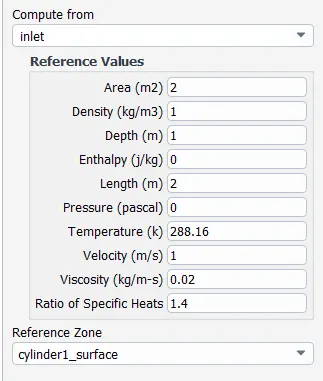
For the remaining simulation all the values will be kept same, except for the velocity which we need to change accordingly with RE no.
RESULTS:
RESIDUALS:
(a)Steady (b)Transient
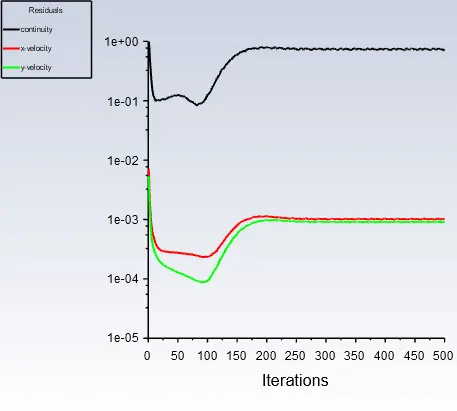
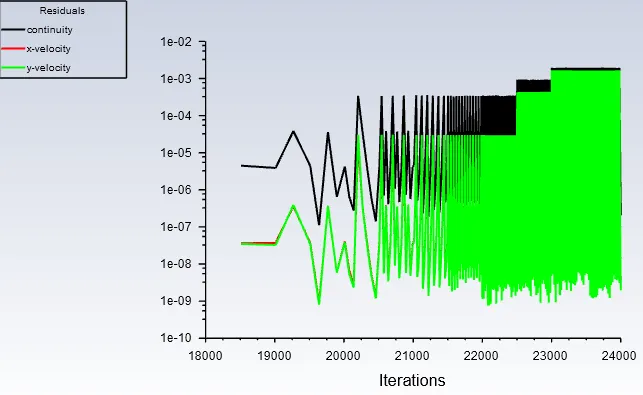
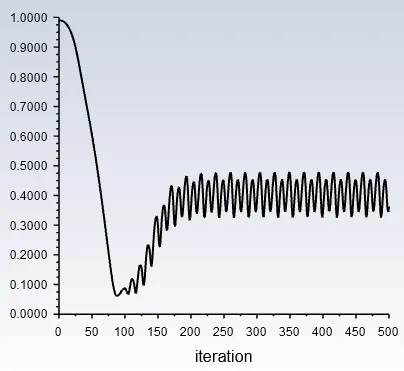
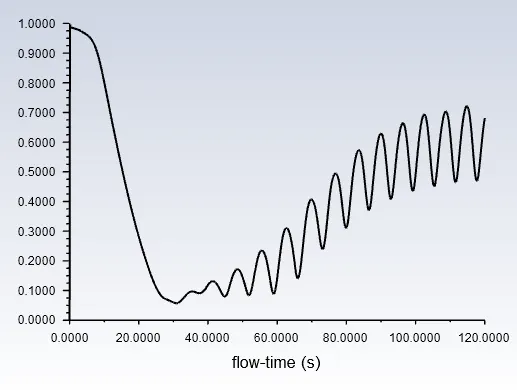
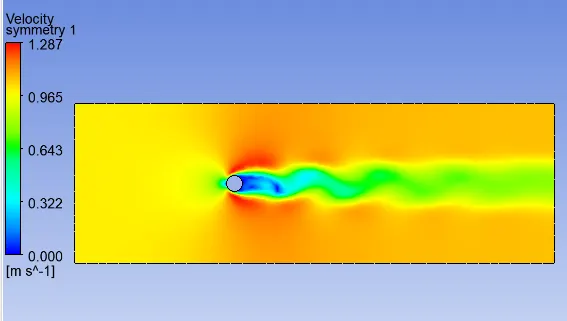
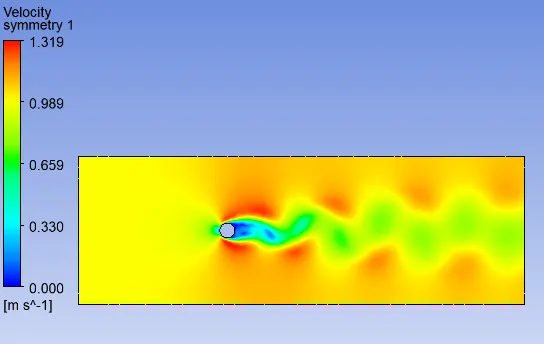
Steady state are performed to check only the end result of the simulation. Any data we see are not accurate with time. But in transient case all the data computation take place with respect to real world time. A major difference can be seen in residual graphs of both case is that the solution converges much faster in steady state (after 150 iterations) than in transient where it peaks appears to be growing very slowly with time and after some iteration it seems to be repeating its patterns (after 20000 iterations). This repeatition of residual after some iterations can be considered that the solutions has converged. In the same way the above statement holds true for velocity and lift coefficient plot. The reason the velocity and lift plot appears to be in that way is because both value fluctuate near the probe point.
VELOCITY:
(a)Steady (b)Transient
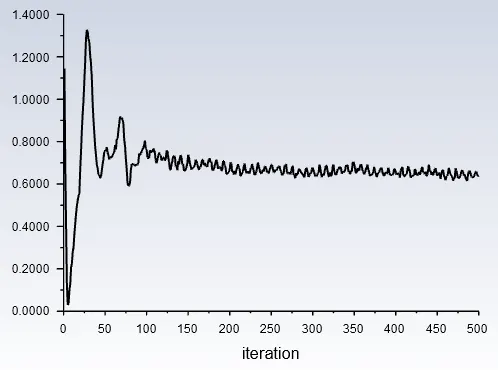
DRAG-COEFFICIENT:
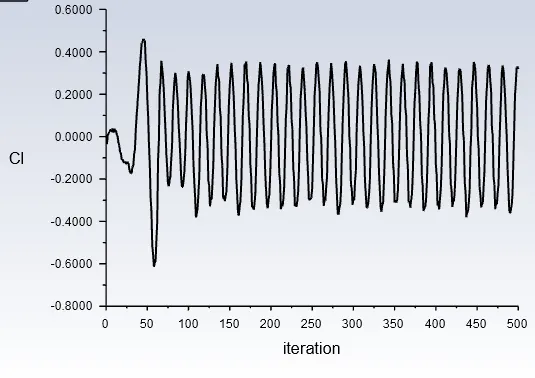
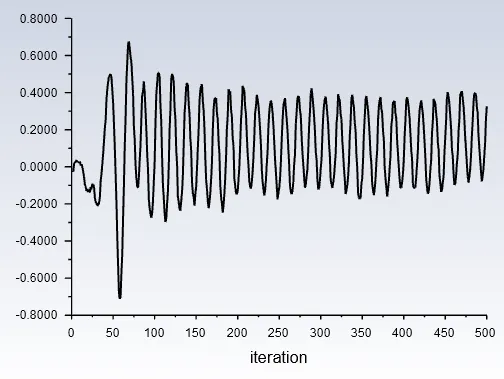
LIFT-COEFFICIENT:
VELOCITY_CONTOURS:
STREAMLINES:
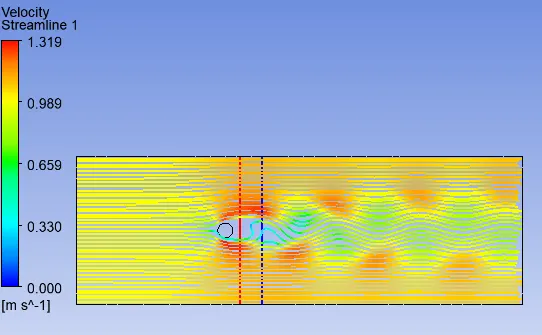
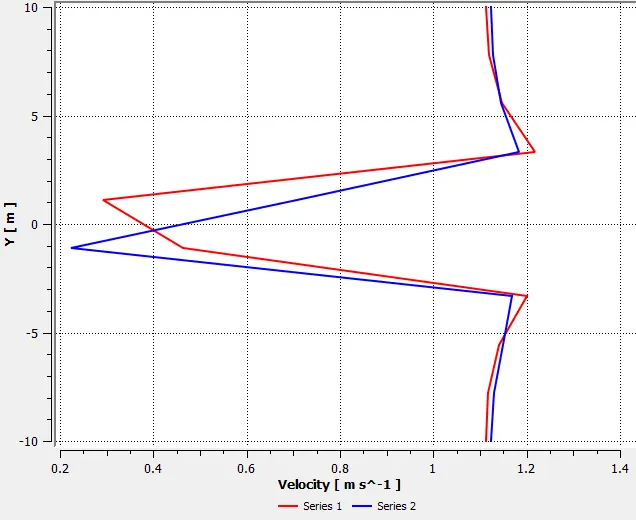
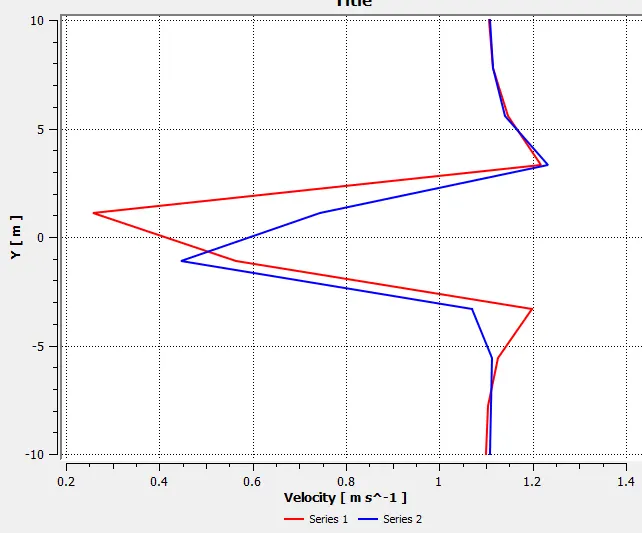
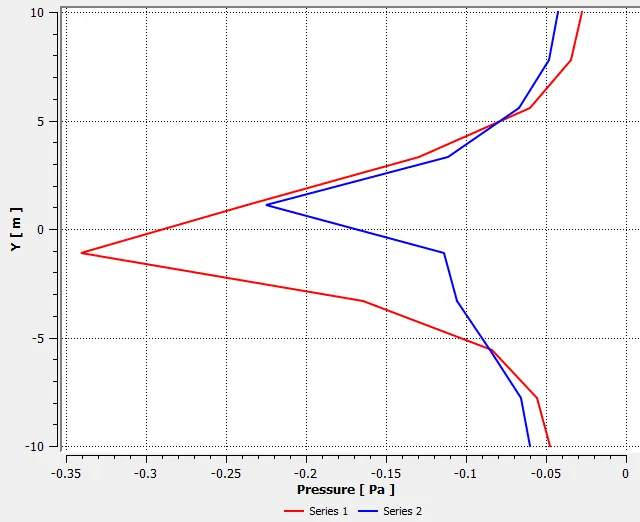
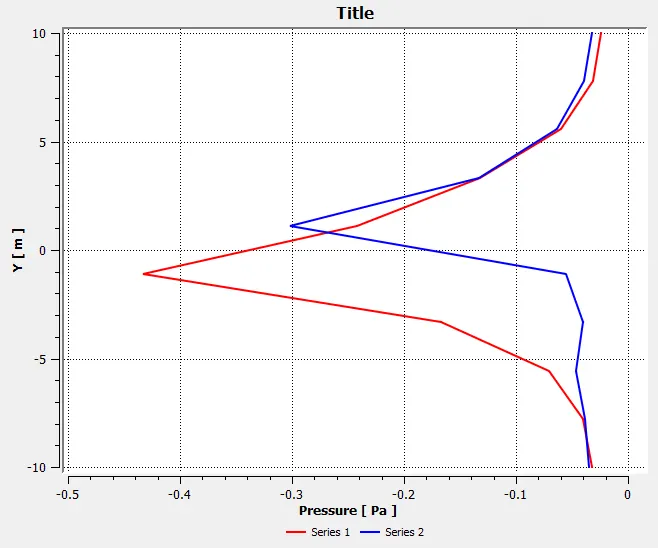
The below graph are plotted for two vertical line placed at 2m (red) and 5m (blue) from the centre of the cylinder.
VELOCITY_GRAPH:
PRESSURE_GRAPH:
Computed data from the simulations are listed in the table.
| CD | CL |
Velocity (m/s) |
Forces on the wall (N) @ X direction | |
| STEADY | 1.307 | 0.112 | 0.363 | 1.307 |
| TRANSIENT | 1.403 | 0.199 | 0.681 | 1.403 |
Strouhal number-It is a dimensionless no. which represent the ratio of inertial forces due to the local acceleration to the inertial forces due to the convective acceleration of the flow.
It is associated with the oscillations of the flow due to the inertial forces relative to the changes in velocity due to convective acceleration of the flow.
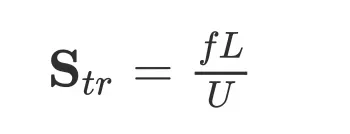
Where f represent frequency of the oscillations, L represent characteristics length and U represent mean flow velocity. The frequency of the oscillations can sometimes have a disastrous effect on the structures. Best example of such oscillations can be seen in vortex street wakes behind bluff bodies.
At high Strouhal no. Oscillations dominates the flow while at low Strouhal no the oscillations are carried by the fast-moving fluid.
To find stroual no, we need transient simulations reults where time plays a major role.
lift vs strouhal no:
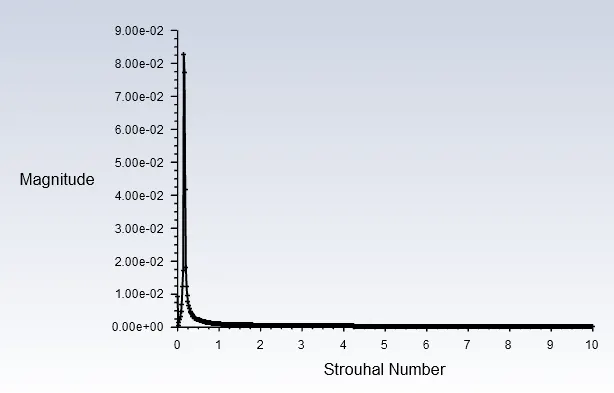
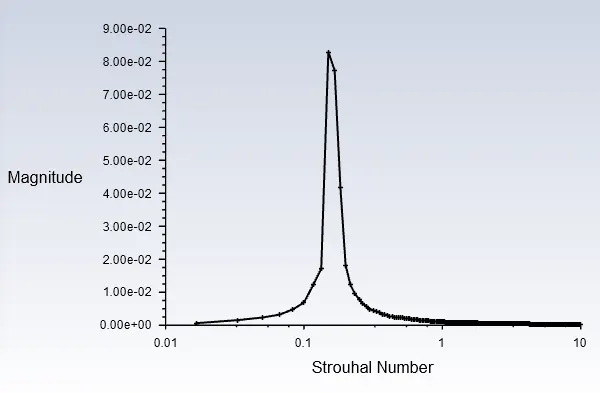
Str no in x axis and log magnitude in y axis
At strouhal no 0.149 we find the maximum lift coefficient of 0.08284
velocity vs frequency :
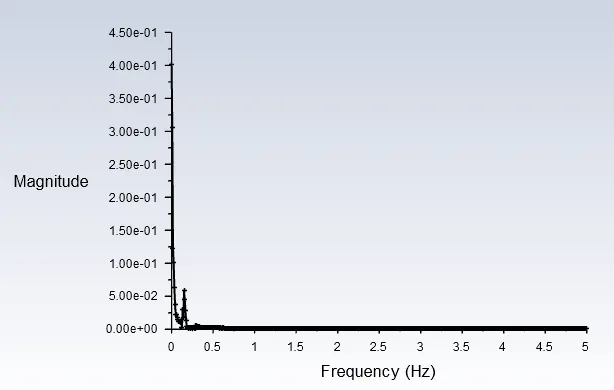
At velocity of 0.0585 m/s we attained a max frequency of 0.14985 hz
PART-II: Calculate the coefficient of drag and lift over a cylinder by setting the Reynolds number to 10,100,1000,10000 & 100000.
For RE=10 there won't be any vortex shredding behind the cylinder in wake region because flow velocity is low to develop vortex street . But small amount of recirculations appears in the wake region which is symmetric about horizontal axis of the cylinder. At RE=47 oscillations are strong enough to break one of the two vortices away from the cylinder. This is called Von karman vortex shedding. The vortices appears and are shed alternatively at a constant frequency. This causes system to excite and induce vibrational load. As the fluid flow over the cylinder this vortices creates low pressure zone on the downwind side of the object on alternate sides.
VELOCITY:
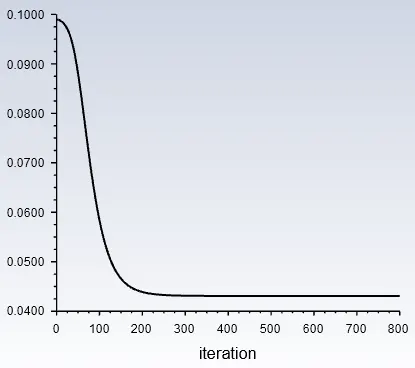
RE-10 RE-100
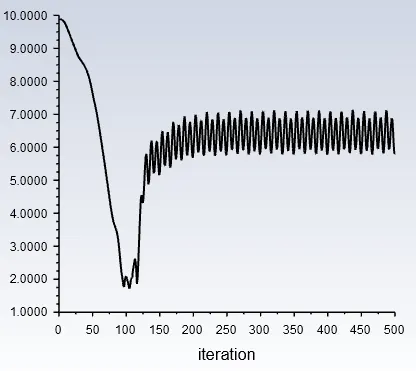
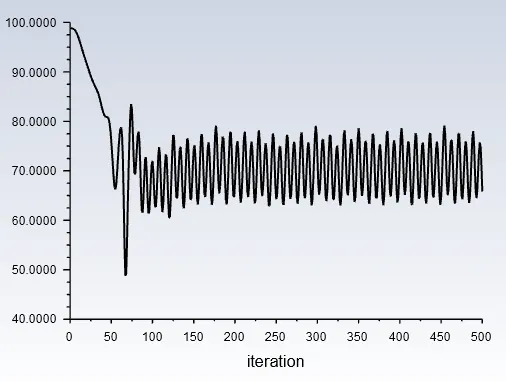
RE-1000 RE-10000
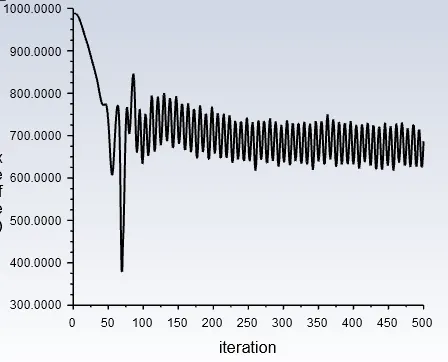
RE-100000
CD AND CL
CD CL
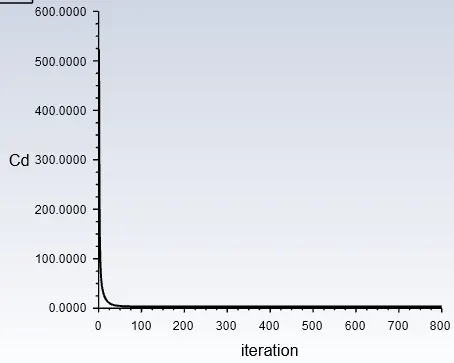
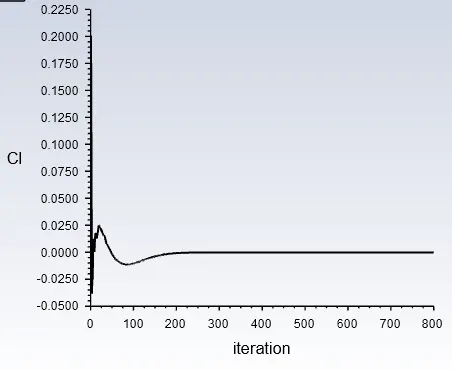
RE=10
RE=100
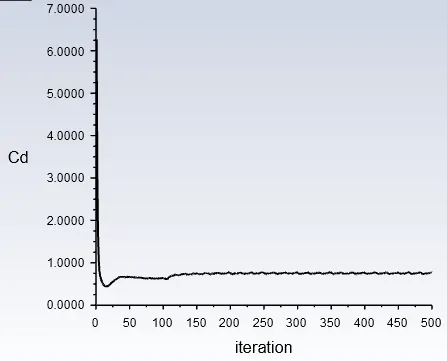
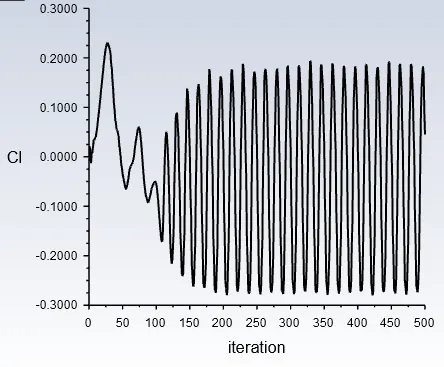
RE=1000
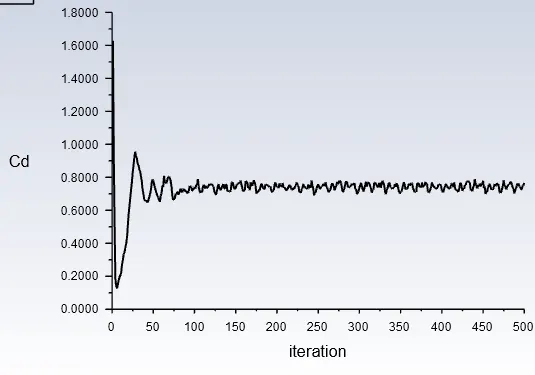
RE=10000
RE=100000
VELOCITY & PRESSURE CONTOURS:
(A) VELOCITY (B) PRESSURE
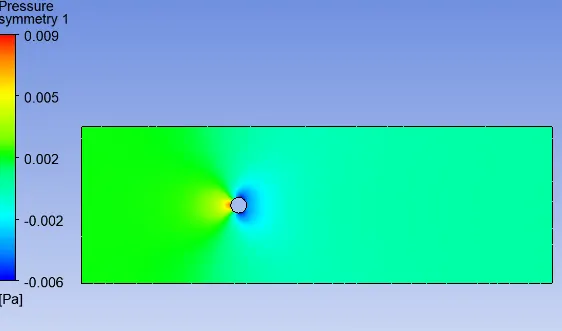
RE=10
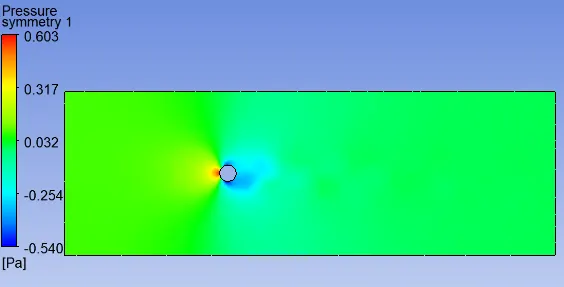
RE=100
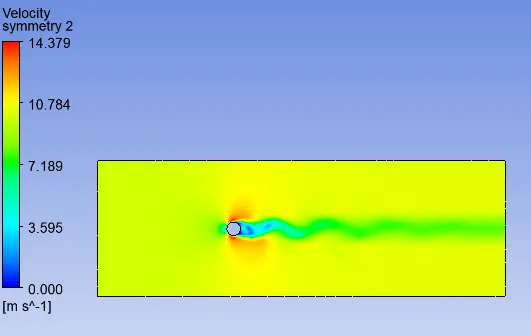
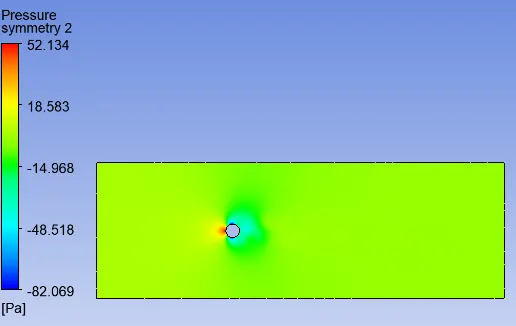
RE=1000
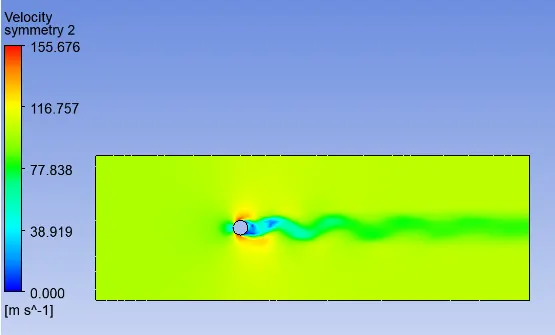
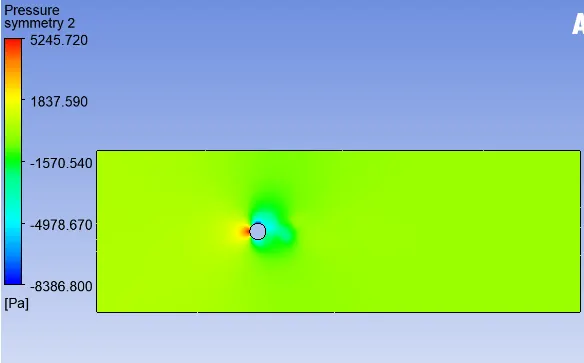
RE=10000
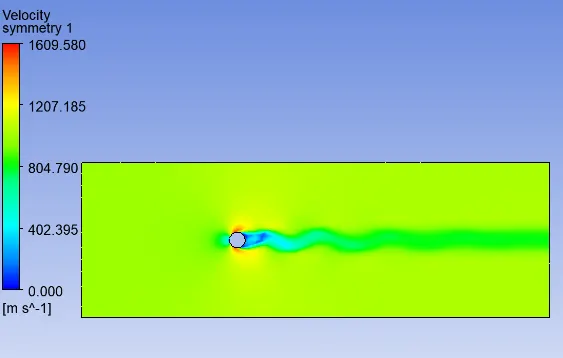
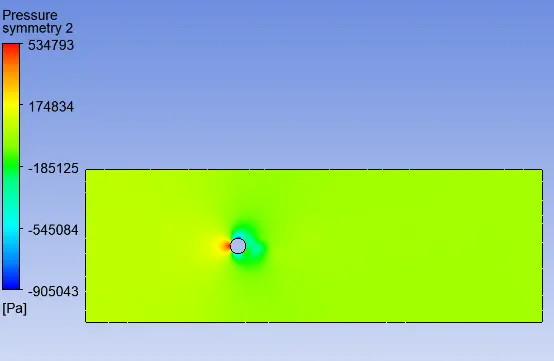
RE=100000
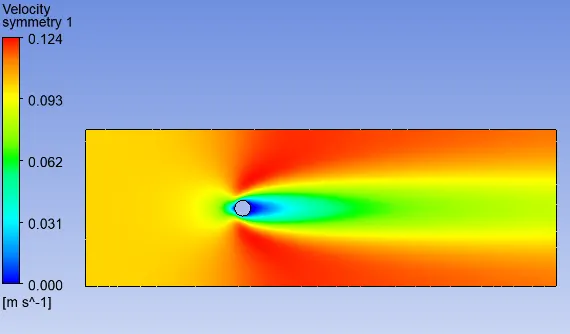
At RE no.=10 no vortices can be seen, only boundary layer seperation can be seen which is indicated by deep blue colour. As the RE no. increases the boundary layers seperation decreases which indicate that there will be less recirculation of flow at wake region behind the cylinder thereby decreasing the drag. For this simulations all the parameters are kept constant except for the velocity, so increasing the velocity will increases the RE no.. This high velocity flow carry away the vortex street and decay after some distance.
Computed data are listed in the table.
| Steady case | velocity @probe (8m) | Cd | Cl | Forces on the wall @ x-direction(N) |
| RE=10 | 0.0430 | 3.314 | -0.000267 | 0.0331 |
| RE=100 | 0.3629 | 1.307 | -0.1123 | 1.3074 |
| RE=1000 | 5.8174 | 0.770 | 0.0449 | 77.092 |
| RE=10000 | 65.8310 | 0.766 | 0.3188 | 7664.47 |
| RE=100000 | 686.6951 | 0.640 | 0.3260 | 640199 |
After inspecting the plots and contours provided above, with the increase in reynold number the drag-coefficient decreases and the lift-coefficient somewhat increases.
---------------------------------------------------------------------------
Animation of the vortex in wake region.
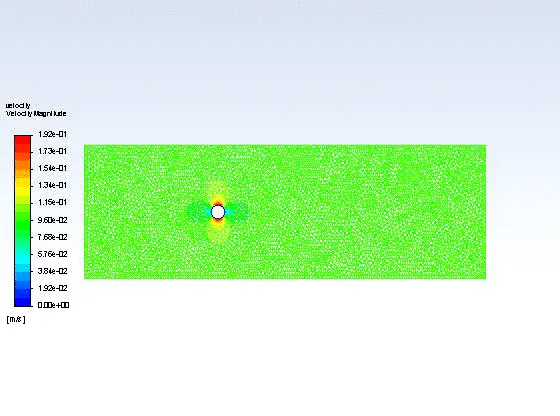
RE=10
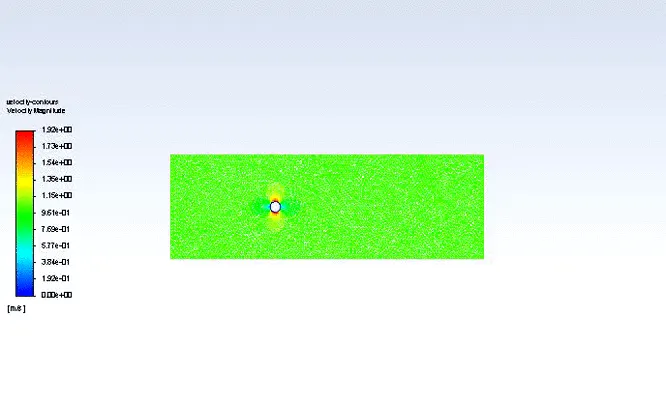
RE=100
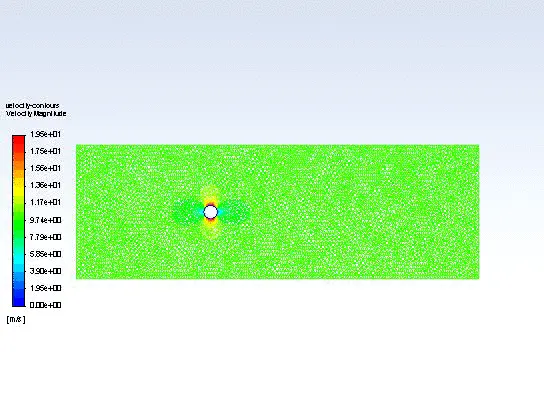
RE=1000
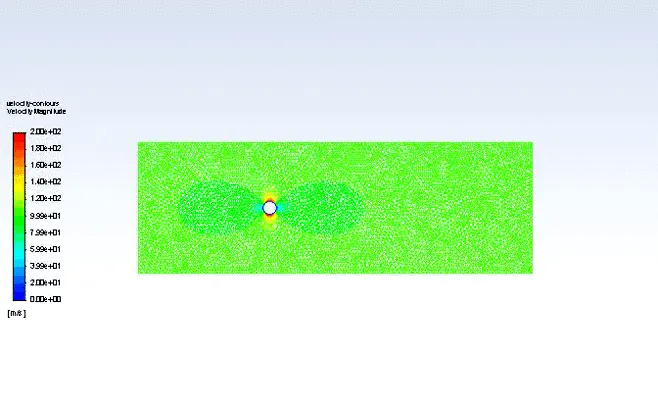
RE=10000
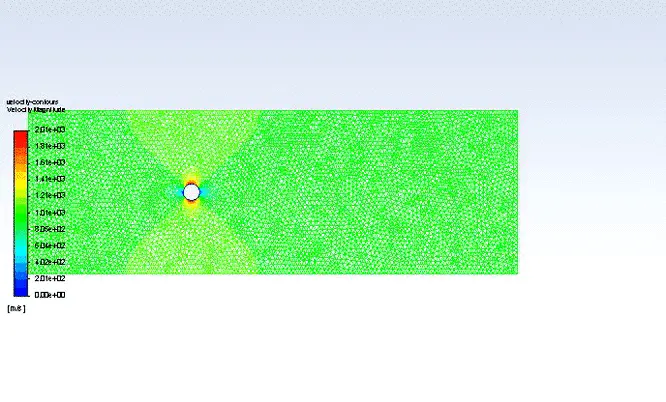
RE=100000
Material preffered for instability reduction.
Design can be change to reduce instability by adding porous and dimple in the surface.
We can add device on the structure for suppression of vortex-induced vibration of cylinder.
Conclusion: -
1) If we compare the data in the table, it is seen that as Reynolds number is increasing the coefficient of Drag is decreasing and coefficient of lift is increasing. This data is compared with research paper given for reference and another research paper titled as "Simulation of Cross flow Induced Vibration" by Eric Williams et. al.
This phenomenon is happening because of when Reynolds number get increased the surface friction between fluid and cylinder is also increasing which casue the boundary layer to break before flow seperated hence amount of drag get decreases and lift get increases.
2) As the Reynolds number increase in value the wake region behind the cylinder is also increasing which results in bigger domain capturization for further simulations.
3) For lower Reynolds number the vortices are bit symmetrical in nature but as Reynolds number get increase it start to deviate more.
4) It can be seen that the steady state solver are more time friendly compared with transient one but Non-iterative Time Advance method can provide better opportunity to solve same trasient problem with less number iteration and time also.