Week 2 - Converging diverging nozzle
Aim:
- To perform CFD analysis on Converging Diverging Nozzle.
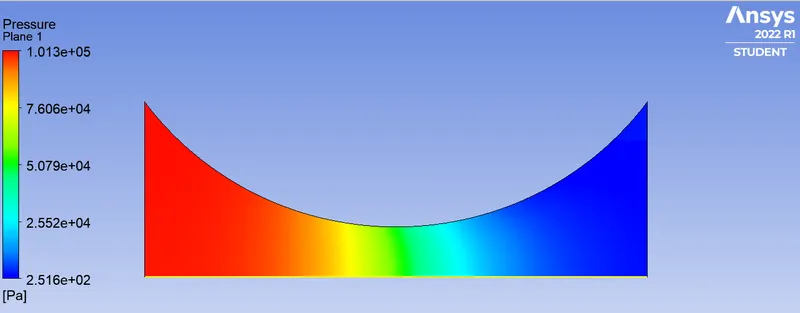
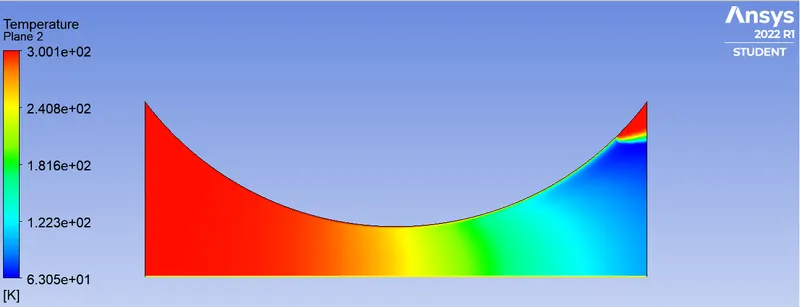
- Plot variation of velocity, temperature and pressure along the length of the nozzle.
- Plot the variation of Mach Number along the length of the nozzle and identify at what distance from the inlet it becomes Supersonic.
- Understand the variation of change in area on the Mach Numeber.
Take away:
By the end of this article one will be able to,
- Simulate this particular case set up.
- Plot the graphs.
==============================================================================
Simulation Setup:
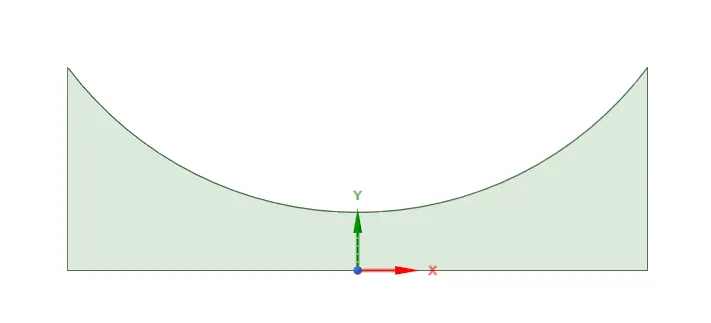
- Geometry:
==============================================================================
- Mesh:
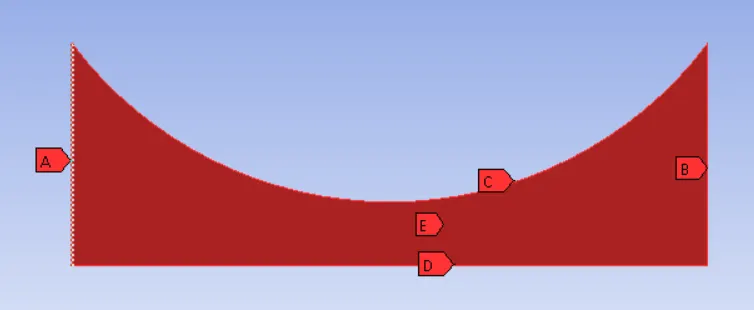
Named Selection:
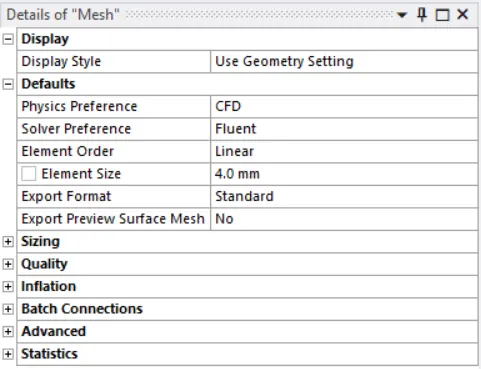
- Mesh element size is given as 4 mm.
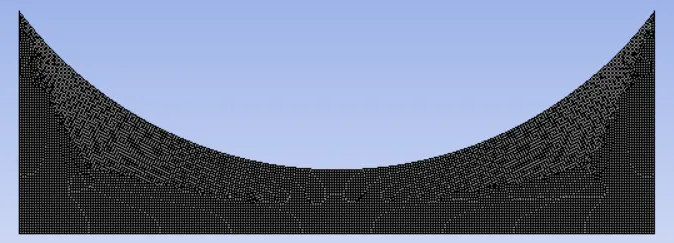
- Mesh is shown below:
==============================================================================
Setting up the physics:
- Solver Type = Density Based solver. (Since Mach Number can exceed 0.3 and it is compressible flow)
- 2D space = Axisymmetric.
- Time = Steady State.
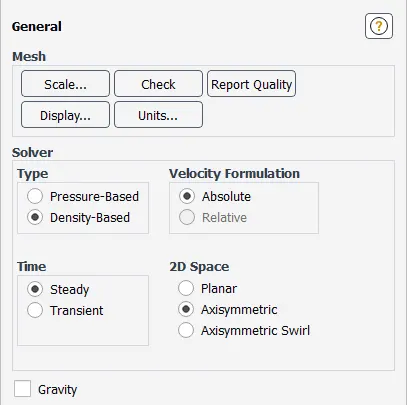
- Energy equation must be turned on.
- Viscous Model = K-Omega SST (default)
Boundary Condition:
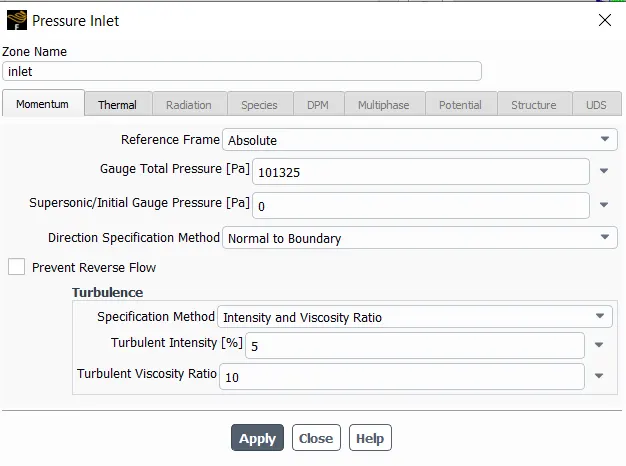
- Inlet = Pressure inlet (101325 Pa); Temperature = 300 K
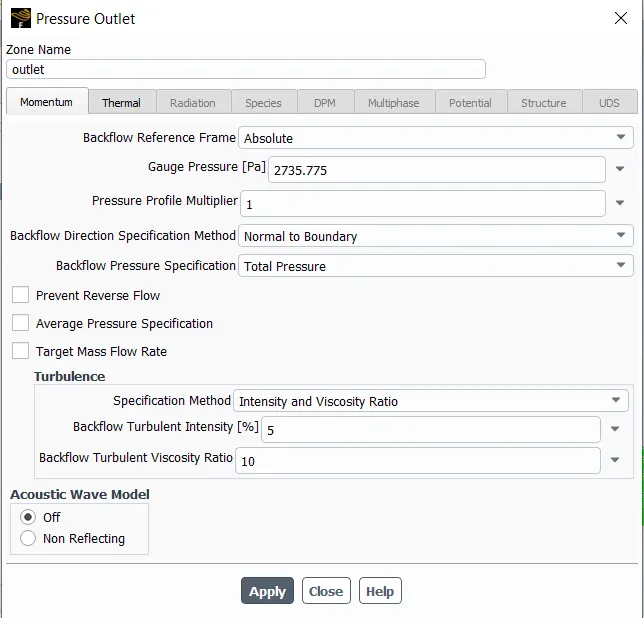
- Outlet = Pressure outlet (2735.775 Pa)
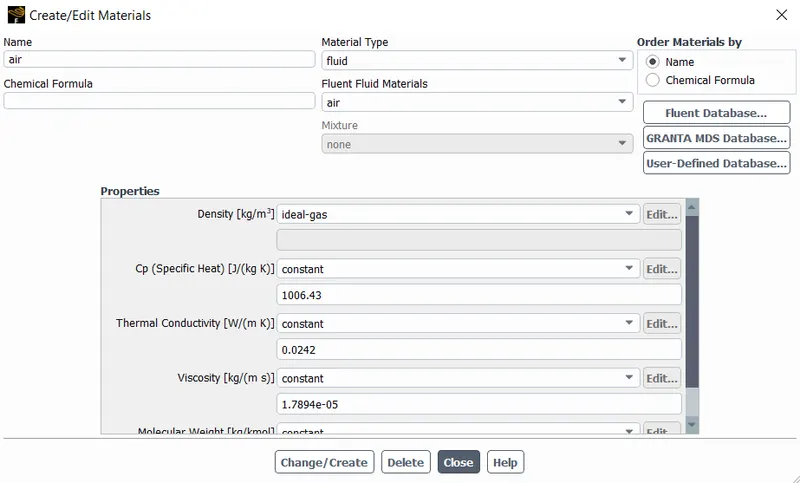
- Material Properties: Material = Air; Density = Ideal gas Law.
- Next step is to do a hybrid initialization.
- Make sure that Courant number is selected properly to avoid divergence.
==============================================================================
Results:
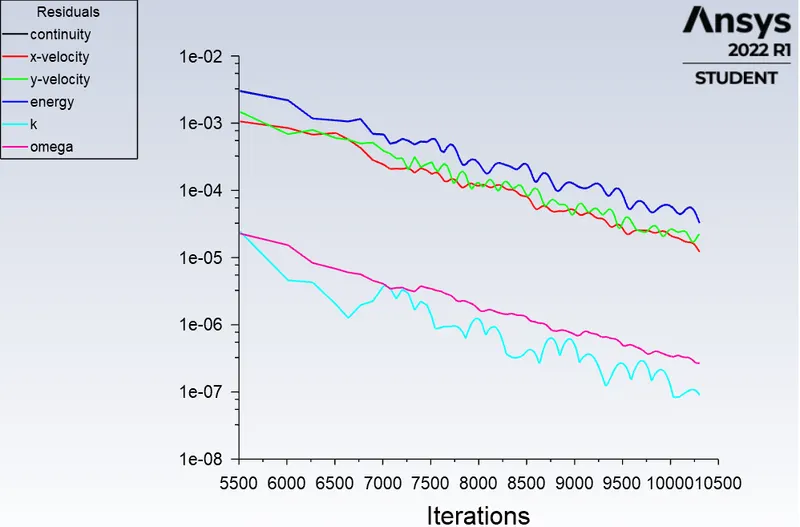
- Residual:
- Mach Number:
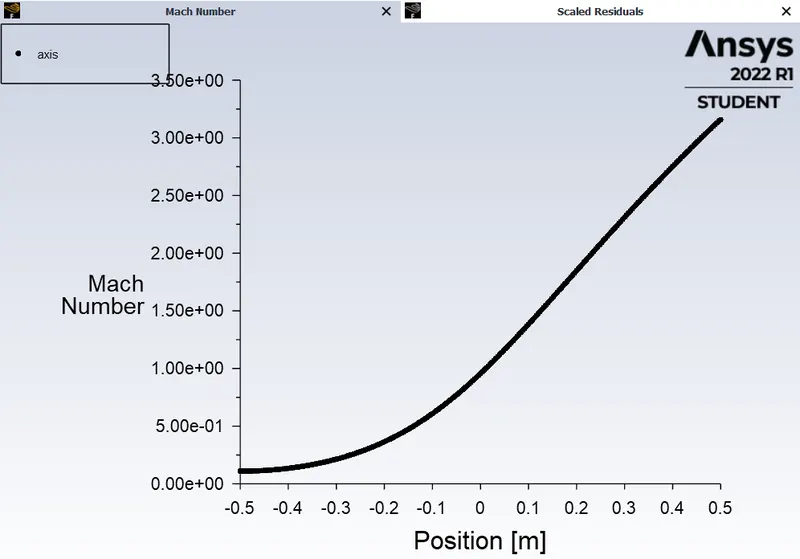
- Here the 0 point on the x axis is the throat section of the pipe.
- Since the area of the nozzle decreases the velocity increases to conserve the mass.
- Therefore, from the graph it is quite evident that the Mach number at the throat section exceeds 1 and the flow becomes supersonic.
- Pressure Contour:
- Temperature Contour:
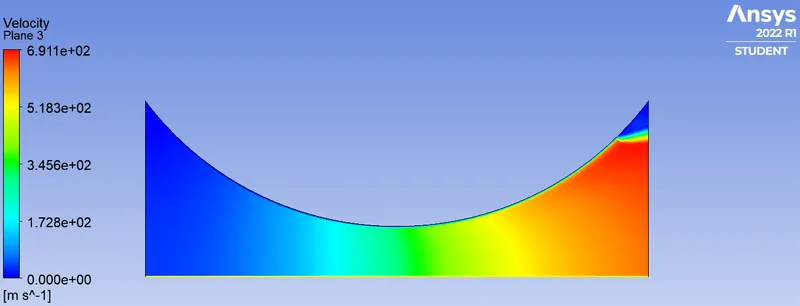
- Velocity Contour:
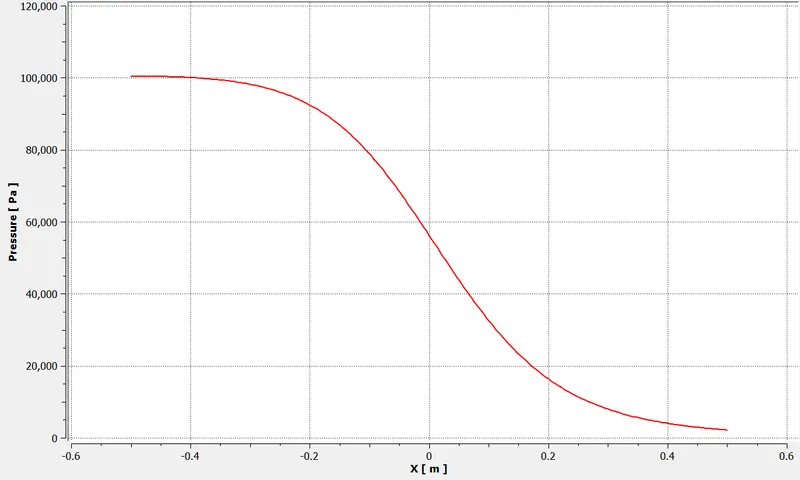
- Pressure Graph:
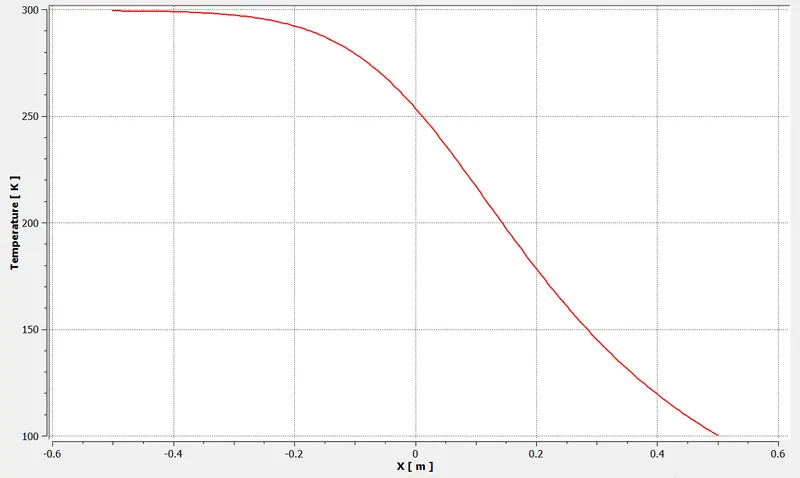
- Temperature Graph:
- Velocity Graph:
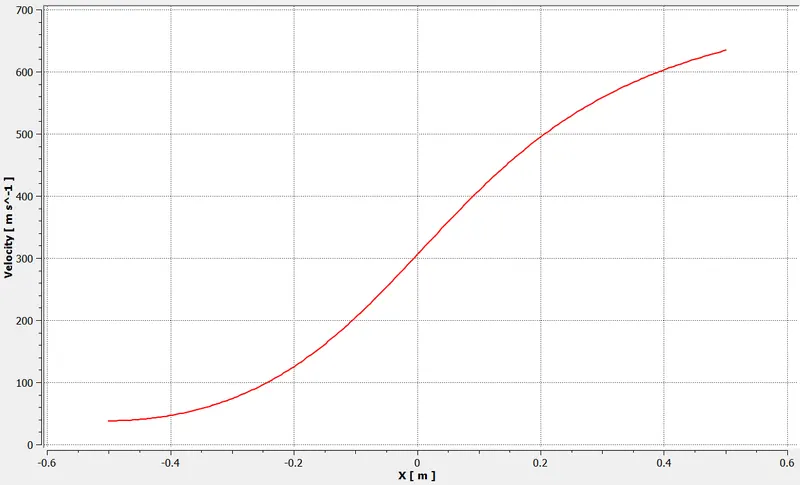
- Comparing the above graphs with the below graph.
==============================================================================
Conclusion:
- As the crosectional area decreases, the velocity increases, hence, the Mach Number increases.