Week 2 Air standard Cycle
aim - to write code in python to solve an otto cycle
program-
import math
import numpy
import matplotlib.pyplot as plt


def otto(p1,bore,stroke,con_rod,cr,t1,gamma,t3,samples):


#p1=101325
#bore=0.1
#stroke=0.1
#con_rod=0.15
#cr=12
#t1=500
#gamma=1.4
#t3=2300

# state 1 and 2
    v_swept= (math.pi/4)*pow(bore,2)*stroke
    v_c=v_swept/(cr-1)
    v1=v_swept
    v2=v_c
    p2=p1*pow(v1,gamma)/pow(v2,gamma)
    t2=t1*pow(cr,gamma-1)

#state 3 and 4
    v3=v2
    p3=(p2*t3)/t2

    v4= v1
    p4=p3*pow(v3,gamma)/pow(v4,gamma)

    efficiency=1-(1/pow(cr,gamma-1))
    print(efficiency)

    p=[]
    v=[]
    p.extend([p1,p2,p3,p4,p1])
    v.extend([v1,v2,v3,v4,v1])
#plt.plot([v1,v2,v3,v4,v1],[p1,p2,p3,p4,p1])
#plt.show()
# now we take values between v1 and v2 as the line is not straight higher samples  will give a better result
    a=numpy.linspace(v1,v2,samples)
    p_1=[p1]
    v_1=a
    for i in range(0,samples-1):
        p=p_1[i]*pow(v_1[i],gamma)/pow(v_1[i+1],gamma)
        p_1.append(p)


    b=numpy.linspace(v3,v4,samples)
    p_2=[p3]
    v_2=b
    for i in range(0,samples-1):
       p=p_2[i]*pow(v_2[i],gamma)/pow(v_2[i+1],gamma)
       p_2.append(p)
    plt.plot(v_2,p_2,color='red')
    plt.plot(v_1,p_1,color='red')
    plt.plot([v2,v3],[p2,p3],marker='o',color='blue')
    plt.plot([v4,v1],[p1,p4],marker='o',color='blue')
    plt.xlabel('vol')
    plt.ylabel('pressure')
    plt.show()


otto(101325,0.1,0.1,0.15,12,500,1.4,2300,100)
output-
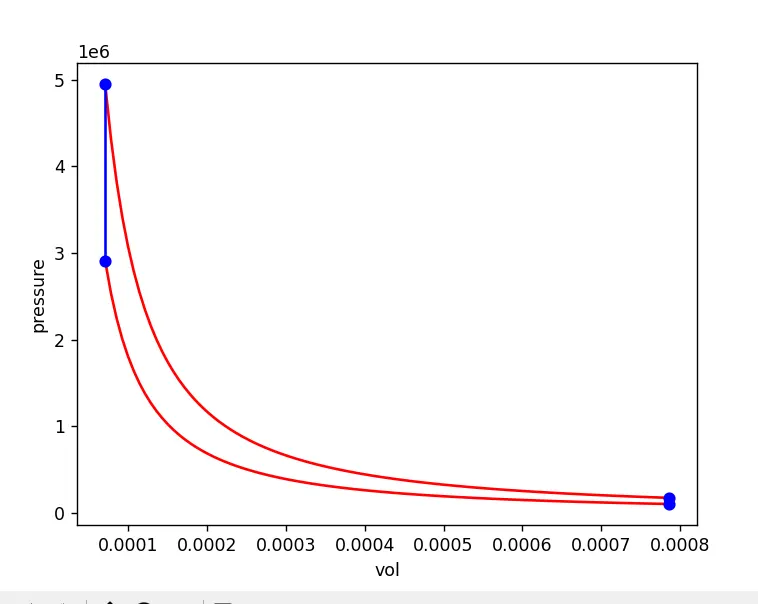

procedure-
1)create a function that take following inputs -(p1,bore,stroke,con_rod,cr,t1,gamma,t3,samples)
2) define v_swept v_clearance
3)now we will calculate alll the state points for 2 isentropic and constant volume process
4)now we can calculate efficiency
5)as the isentropic line is not linear we will need multiple points to better represent ht isentropic process using linspace we take samples between v1 and v2 for these each values of v we will calculate all values(samples-1 as initial values of p is known) of p using for loop and store it in a empty array
6)for process 2 -3 is cv process it is a straight line
7) for process 3-4 we will use same process as we used for process 1-2
result - efficiency is calculated and graph is plotted