Project 1 - Parsing NASA thermodynamic data
AIM: To write a code in matlab to parsing NASA thermodynamic data file and calculate the thermodynamic properties of various gas species.
Governing equation-
Given formula to calculate the specific heat, enthalpy and entropy.
SPECIFIC HEAT:Specific heat, the quantity of heat required to rise the temperature of one gram of substance by one celsius degree. The units of specific heat are usally calories or joules per gram per celsius degree.
ENTROPY:Entropy, the measure of a system's thermal energy per unit temperature that is unavailable for doing useful work. Because work is obtained from ordered molecular motion, the amount of entropy is also a molecular of the molecular dis order, or randomness of a system,
ENTHALPY: Enthalpy change of a system is equal to the heat absorbed or evolved by the system at constant pressure. A alomst of the reaction are carried out at constant pressure, the measured value of the heat evolved or absorbed is the enthalpy change entalpy.
MOLECULAR WEIGHT:Molecular weight is the measure of the sumof the atomic weight values of the atoms in a melecular. Molecular weight is used in chemistry to detemine stoichiomerty in chemical reactions and equations. Molecular weight is either unitless or expressed in terms of atomic mass units (amu) or Daltons (Da).
Procedure-
1) Copy and paste the thermos.dat file in same folder with matlab program.
2) Using fgetl() and strsplit() get the gobal temp data.
3) Using loop skip the unwanted 3 lines.
4) Use for loop
5) Use strsplit() to get species name and the local high med and low temp
6) Using strfind() find location of E
7) As all the coeff have 3 int after E use str2float(1:E+3) to get first coeff
8) similarly next coeff will start from E+4, repeat till you find all the coeff of the line
9)Similarly repeat and find all coeff of all the line
10)Take appropriate no of values between mid, low and high temp using linspace
11)using for loop calculate specific heat, enthalpy and entrophy for low mid high temp
12)change directory using cd()
13)make a folder using mkdir() to save graphs
14) Plot the required graphs
Main code-
close all
clear all
clc

f1=fopen('THERMO.dat','r');

fgetl(f1)

% temp values
temp=str2num(fgetl(f1))
global_low=temp(1)
global_mid=temp(2)
global_high=temp(3)

%skipping unwanted values
for i=1:3
    fgetl(f1);
end

for i=1:53

line1 = fgetl(f1);
l = strsplit(line1, ' ');

% Storing the values of the local temp

m=length(l)

species=l{1};

low_temp = str2double(l(m-3));
high_temp = str2double(l(m-2));
mid_temp = str2double(l(m-1));

line2=fgetl(f1)

strpos=strfind(line2,'E');

a1 = str2double(line2(1:strpos(1)+3));
a2 = str2double(line2(strpos(1)+4:strpos(2)+3));
a3 = str2double(line2(strpos(2)+4:strpos(3)+3));
a4 = str2double(line2(strpos(3)+4:strpos(4)+3));
a5 = str2double(line2(strpos(4)+4:strpos(5)+3));

line3=fgetl(f1);

strpos2=strfind(line3,'E');

a6 = str2double(line3(1:strpos2(1)+3));
a7 = str2double(line3(strpos2(1)+4:strpos2(2)+3));
a8 = str2double(line3(strpos2(2)+4:strpos2(3)+3));
a9 = str2double(line3(strpos2(3)+4:strpos2(4)+3));
a10 = str2double(line3(strpos2(4)+4:strpos2(5)+3));

line4=fgetl(f1)
strpos3=strfind(line4,'E');
a11 = str2double(line4(1:strpos3(1)+3));
a12 = str2double(line4(strpos3(1)+4:strpos3(2)+3));
a13 = str2double(line4(strpos3(2)+4:strpos3(3)+3));
a14 = str2double(line4(strpos3(3)+4:strpos3(4)+3));


lower_temp = linspace(low_temp,mid_temp,100);
higher_temp = linspace(mid_temp,high_temp,100);

R=8.314

for k=1:100;

    cp_low(k)=(a8+(a9*lower_temp(k))+(a10*(lower_temp(k)^2))+(a11*(lower_temp(k))^3)+(a12*(lower_temp(k))^4))*R;

    h_low(k)=(a8+(a9*lower_temp(k))/2+(a10*lower_temp(k)^2)/3+(a11*lower_temp(k)^3)/4+a12*(lower_temp(k)^4)/5+(a13/lower_temp(k)))*R*lower_temp(k);

    s_low(k)=((a8*log(lower_temp(k))+(a9*lower_temp(k))+((a10*lower_temp(k)^2)/2)+((a11*lower_temp(k)^3)/3)+((a12*lower_temp(k)^4)/4)+a14)*R);

    cp_high(k)=(a1+(a2*higher_temp(k))+(a3*(higher_temp(k)^2)+(a4*(higher_temp(k))^3)+a5*(higher_temp(k))^4))*R;

    h_high(k)=(a1+(a2*higher_temp(k))/2+(a3*higher_temp(k)^2)/3+(a4*higher_temp(k)^3)/4+(a5*(higher_temp(k)^4))/5+(a6/higher_temp(k)))*R*higher_temp(k);

    s_high(k)=((a1*log(higher_temp(k))+a2*higher_temp(k)+((a3*higher_temp(k)^2)/2)+((a4*higher_temp(k)^3)/3)+((a5*higher_temp(k)^4)/4)+a7)*R);
end

cd("C:\Users\alsig\OneDrive\Desktop\temp code")
mkdir(species);
cd(species);

figure(1)
plot(lower_temp,cp_low,'linewidth',4,'color','k');
hold on
plot(higher_temp,cp_high,'linewidth',4,'color','k');
hold off
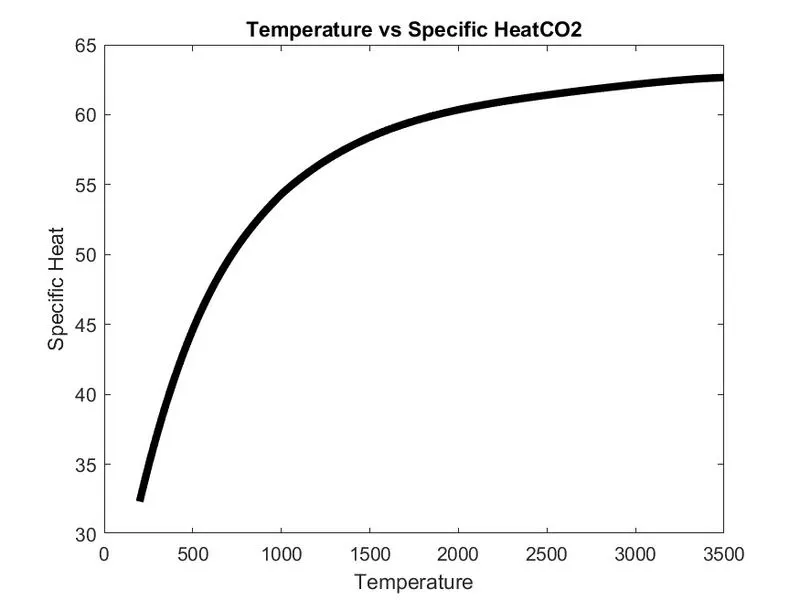
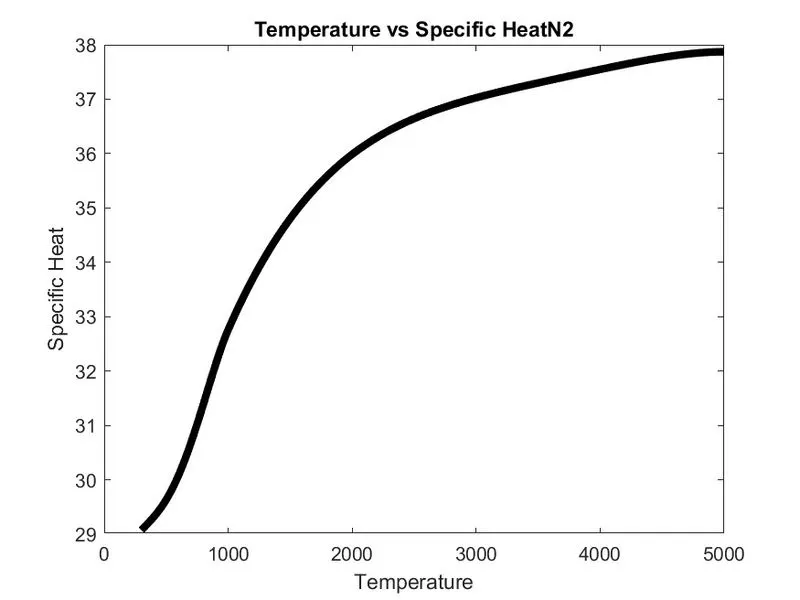
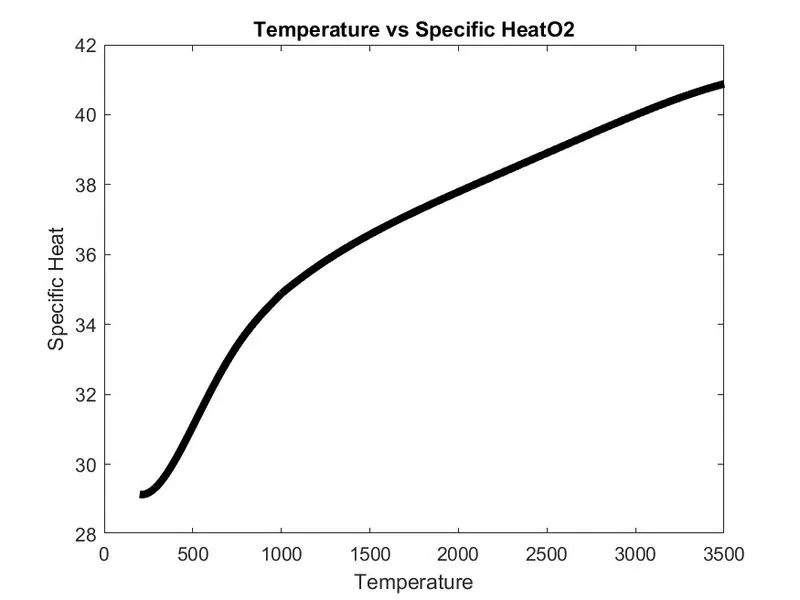
title(['Temperature vs Specific Heat',species]);
xlabel('Temperature');
ylabel('Specific Heat');
saveas(figure(1),'cp.jpg');

figure(2)
plot(lower_temp,h_low,'linewidth',4,'color','g');
hold on
plot(higher_temp,h_high,'linewidth',4,'color','g');
hold off
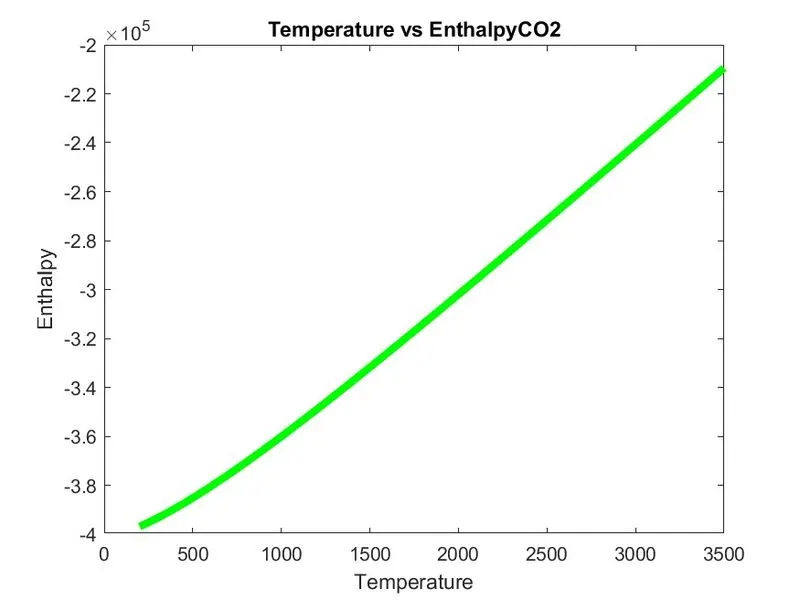
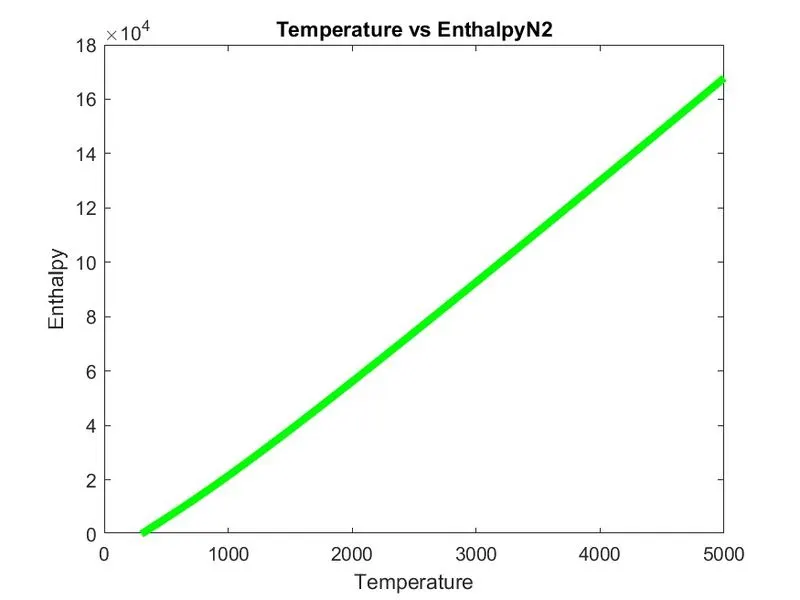
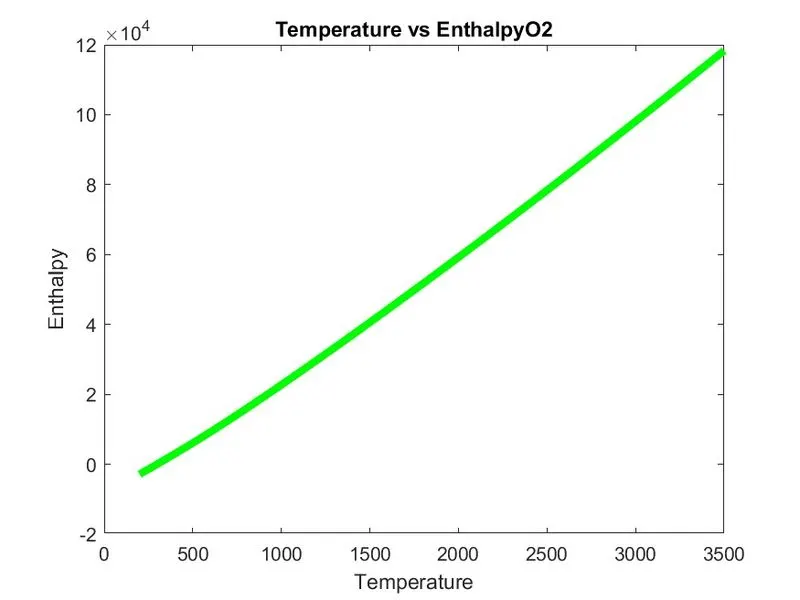
title(['Temperature vs Enthalpy',species]);
xlabel('Temperature');
ylabel('Enthalpy');
saveas(figure(2),'H.jpg');

figure(3)
plot(lower_temp,s_low,'linewidth',2,'color','b');
hold on
plot(higher_temp,s_high,'linewidth',2,'color','b');
hold off
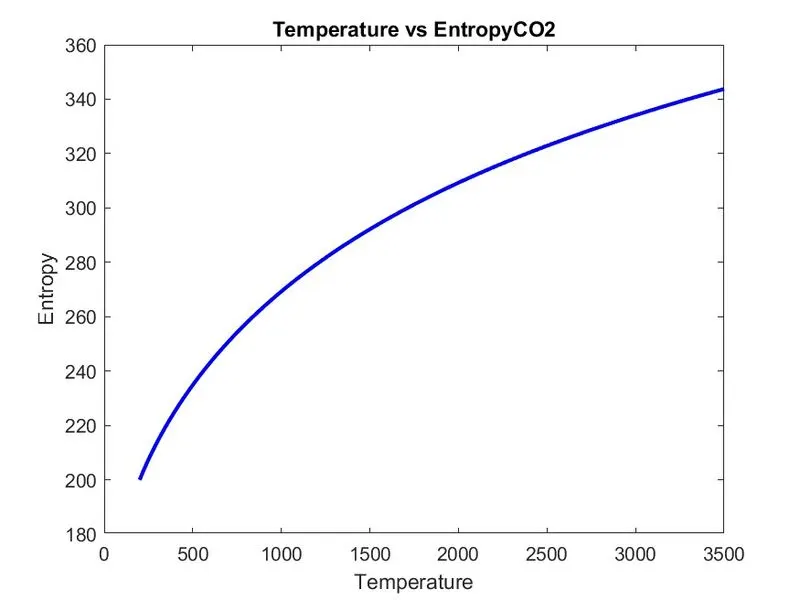
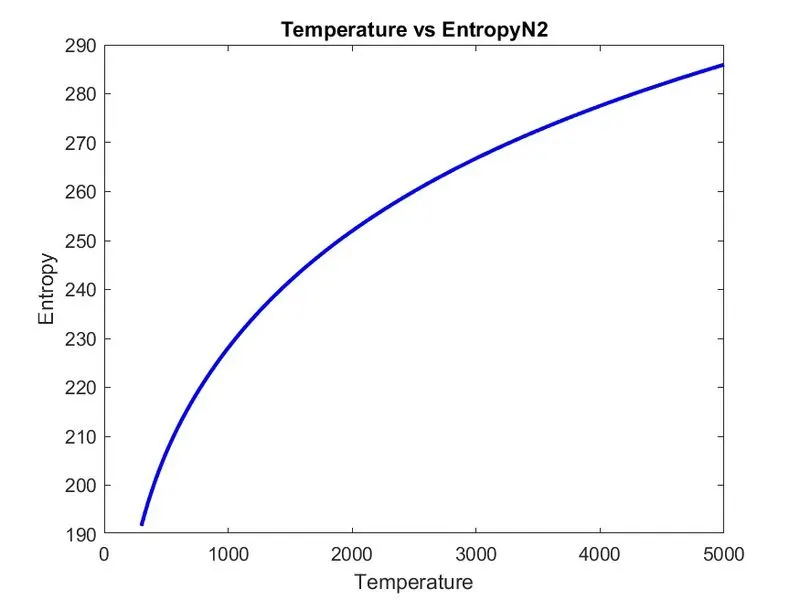
title(['Temperature vs Entropy',species]);
xlabel('Temperature');
ylabel('Entropy');
saveas(figure(3),'S.jpg');

cd ..
end
output-
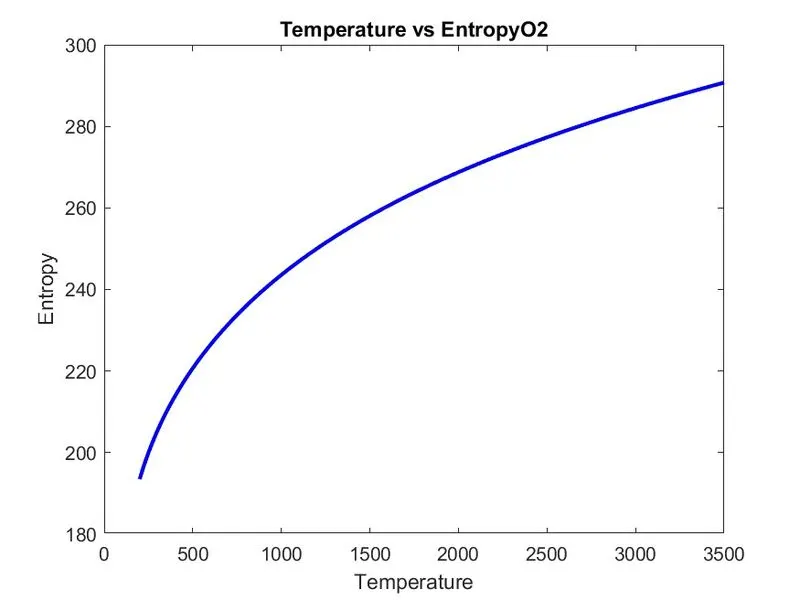

result- Study of Nasa thermodynamic file done