Week 2 Air standard Cycle
Aim:
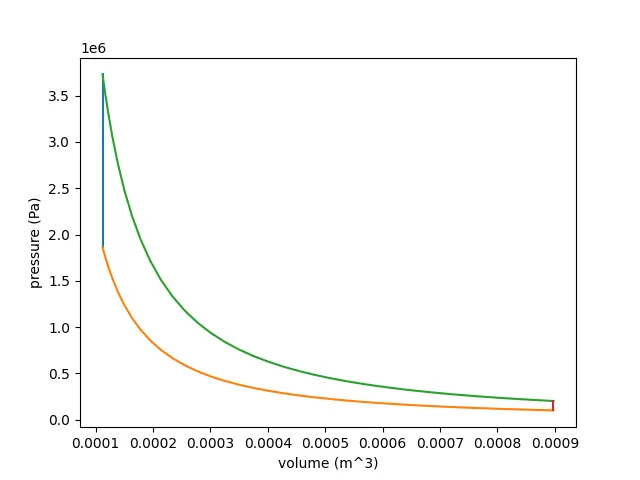
Write a program in python to simulate otto cycle, plots for the given cycle and find out thermal efficiency of the cycle.
Solution:
Values of parameters that have been taken in the beginning.
P1 = 101325 Pa, t1 = 500 K, gamma = 1.4, t3 = 2300 K, bore = 0.1 m, stroke = 0.1 m, connecting rod = 0.15 m, compression ratio (cr) = 8, a = stroke/2, R = connecting rod/a
Equations used in the program:
Swept Volume,
Vs = π4 ⋅ bore2 ⋅strokeVs = 𝜋4 ⋅ bore2 ⋅stroke
Clerance Volume,
Vc = Vscr−1Vc = Vscr−1
Thermal Efficiency,
ηc =1−1crgamma−1𝜂c =1−1crgamma−1
Program:
#Otto Cycle Simulator
#Anvar Choksi

import math
import matplotlib.pyplot as plt

def engine_kinematics(bore,stroke,con_rod,cr,start_crank,end_crank):
	#Engine Kinematics
	#Anvar Choksi

	#inputs
	#geomatric parameters
	a = stroke/2
	R = con_rod/a

	#Volume parametrs

	v_s = math.pi/4*pow(bore,2)*stroke
	v_c = v_s/(cr-1)

	sc = math.radians(start_crank)
	ec = math.radians(end_crank)

	num_values = 50
	dtheta = (ec-sc)/(num_values-1)
	v = []
	for i in range(0,num_values):
		theta = sc + i*dtheta
		term1 = 0.5*(cr-1)
		term2 = R + 1 - math.cos(theta)
		term3 = pow(R,2) - (pow(math.sin(theta),2))
		term3 = pow(term3,0.5)

		v.append((1 + term1*(term2 - term3))*v_c)
	return v


#inputs

p1 = 101325
t1 = 500
gamma = 1.4
t3 = 2300

#Geomatric parameters
bore = 0.1
stroke = 0.1
con_rod = 0.15
cr = 8

#Volume Computation

v_s = (math.pi/4)*pow(bore,2)*stroke
v_c = v_s/(cr-1)
v1 = v_c + v_s

#State Point 2
v2 = v_c

#p2v2^gamma = p1v1^gamma
p2 = p1*pow(v1,gamma)/pow(v2,gamma)

#p2v2/t2 = p1v1/t1 | rhs = p1v1/t1 | p2v2/t2 = rhs | t2 = p2v2/rhs
rhs = p1*v1/t1
t2 = p2*v2/rhs

v_compression = engine_kinematics(bore,stroke,con_rod,cr,180,0)
constant = p1*pow(v1,gamma)

p_compression = []

for v in v_compression:
	p_compression.append(constant/pow(v,gamma))

print(p_compression)

#State Point 3
v3 = v2

#p3v3/t3 = p2v2/t2 | rhs = p2v2/t2 | p3 = rhs*t3/v3
rhs = p2*v2/t2
p3 = rhs*t3/v3

v_expansion = engine_kinematics(bore,stroke,con_rod,cr,0,180)
constant = p3*pow(v3,gamma)

p_expansion = []

for v in v_expansion:
	p_expansion.append(constant/pow(v,gamma))

#State Point 4
v4 = v1

#p4v4^gamma = p3v3^gamma
p4 = p3*pow(v3,gamma)/pow(v4,gamma)

#p4v4/t4 = p3v3/t3
t4 = p4*v4/rhs

plt.plot([v2,v3,],[p2,p3])
plt.plot(v_compression,p_compression)
plt.plot(v_expansion,p_expansion)
plt.plot([v4,v1],[p4,p1])
plt.xlabel('volume (m^3)')
plt.ylabel('pressure (Pa)')
plt.show()
#plt.savefig('otto.png')

#Thermal Efficiency of the engine
Thermal_efficiency = 1 - (1/pow(cr,gamma-1))

print('thermal efficiency of the otto cycle is:', Thermal_efficiency)
Output:

P-V diagram:
Conclusion:
The desired P-V diagram of otto cycle was obtained by finding Volume trace and pressure against crank angle by using array in python.