Week 2- 2R Robotic Arm Challenge
Aim of the project
1.To write a program in Matlab and python to simulate the forward kinematics of a 2R Robotic Arm.
- Create an animation file of the plot
Introduction
- Kinematics :is the study of motion of a system of bodies without directly considering the forces or potential fields affecting the motion
- Forward kinematics: forward kinematics refers to process of obtaining Position and velocity of end effector
- Robotic Arm: Robotic arm are machines that are programmed to execute a specific task robotic joint provides relative motion between two link
-
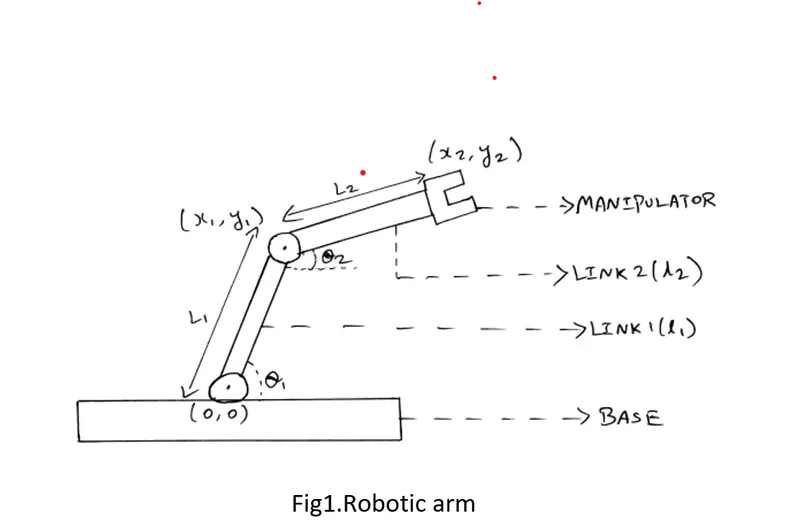
Link-joint numbering
The robotic base and its connection to the first joint are referred to as link 0. The first joint in the sequence is joint 1. Link 0 is the input link for joint 1, while the output link from joint 1 is link 1 which leads to joint 2. Thus link 1 is, simultaneously, the output link for joint 1 and the input link for joint 2. This joint-link-numbering scheme is followed for all joints and links in the robotic system
MATLAB Program
% Forward kinematics of a 2R Robotic Arm
clear all
close all
clc
%inputs

l1=1.5 % lenth of 1st arm

l2=0.5 % lenth of 2nd arm

theta1= linspace(0,90,10)%angle of 1st arm

theta2= linspace(0,90,10)%angle of 2nd arm

ct=1;% initial counter value

for i=1:length(theta1)

    Theta1=theta1(i);

    for j=1:length(theta2)

        Theta2=theta2(j);

        x0=0;
        y0=0;              % co-ordinate of link 1 at fix support

        x1=l1*cosd(Theta1);
        y1=l1*sind(Theta1); %co-ordinate of link 1 at point joint

        x2=x1+l2*cosd(Theta2);
        y2=y1+l2*sind(Theta2);%co-ordinate of link 2 at free end

        %plotting


        plot([x0 x1],[y0 y1],'linewidth',3,'Color','r')
        hold on
        plot([x1 x2],[y1 y2],'linewidth',3,'color','g')
        axis([-0.1 3 -0.1 3])
        hold off

        pause(0.03)
        M(ct)=getframe(gcf)
         ct=ct+1;

    end
end
%conversion of plot into video
movie(M)
videofile=VideoWriter('rc1program.m','Uncompressed AVI');
open(videofile)
writeVideo(videofile,M)
close(videofile)
Inputs
L1-Link1=1.5 Length of link1
L2-Link2=0.5 Length of link2
(X0,y0) = starting point of link1
(X1,Y1)= ending point of link1/starting point of link2
(X2,Y2)=ending point of link2
Step-wise explanation of your code
1.Clear Screen
- 1st start writing the code it is important to start wirh clear all,close all,and clc
- Clear all-remove the data from workplace and freeing up system memory
- Close all-deletes the current figure or the specified fig
- Clc =clears all input and output from the command window display
2.Inputs
- Assign l1=1.5 and l2=0.5 (length of link )
- Assign theta1 & theta 2(0 to 90) here we use the linspace command
0 to 90 there are infinite position are develop but we plot only 10 position therefore we use linspace command (theta1=10pos,theta2=10pos)
3.For loop which allows code to be executed repeatedly
- for loop operated as 100 times therefore assign ct=1 after evey for loop ct increment by 1 till the 100
- For plotting link 1 wrt theta1 & link 2 wrt theta2 Assign ‘I’ as variable for theta1 and ‘j’ for theta2 to calculating theta1 & theta2
- Calculating the position of co-ordinates using the value of theta1 & theta2
- X0=0
Y0=0 (fix point co-ordinate)
x1=l1*cosd(Theta1);
y1=l1*sind(Theta1); (1st point co-ordinate)
x2=x1+l2*cosd(Theta2);
y2=y1+l2*sind(Theta2); (2nd point co-ordinate)
4.Plotting
- Writing the plot command we plot the position for link 1[(x0,x1),(y0,y1)] & link2([x1 x2],[y1 y2]
plot([x0 x1],[y0 y1],'linewidth',3,'Color','r')
- plot([x1 x2],[y1 y2],'linewidth',3,'color','g')
- to adjust the width of plot we use line width taking as 3 and selecting red colour
- hold on to display all result on one plot we use hold on command
- axis([-0.1 3 -0.1 3]) to arrange the axis point on plot as (x=-0.1,3) and y=(-0.1,3)
- hold off to sets the hold state to off so that new plot added
- pause(0.03) time to hold state between 2 plot
- M(ct)=getframe(gcf) to display all output state in one frame
- ct=ct+1;ct=count increasing by 1 for next for loop
5.Create an animation file
Converting all position of output into video format using mat lab command
- movie(M)
- videofile=VideoWriter('rc1program.m','Uncompressed AVI');
- open(videofile)
- writeVideo(videofile,M)
- close(videofile)
Errors faced while programming.
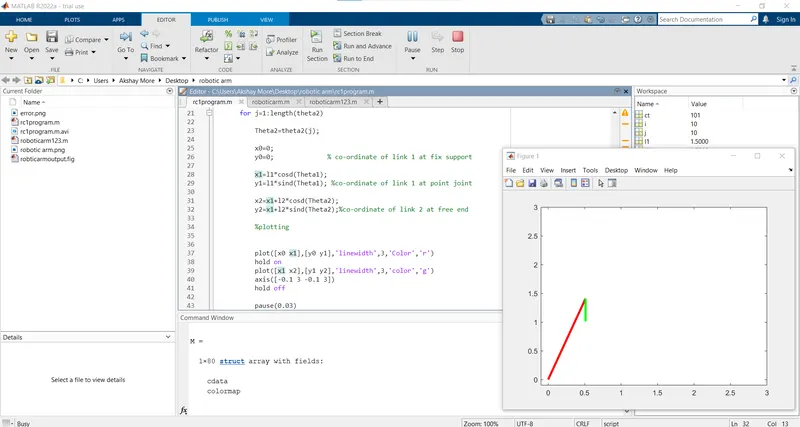
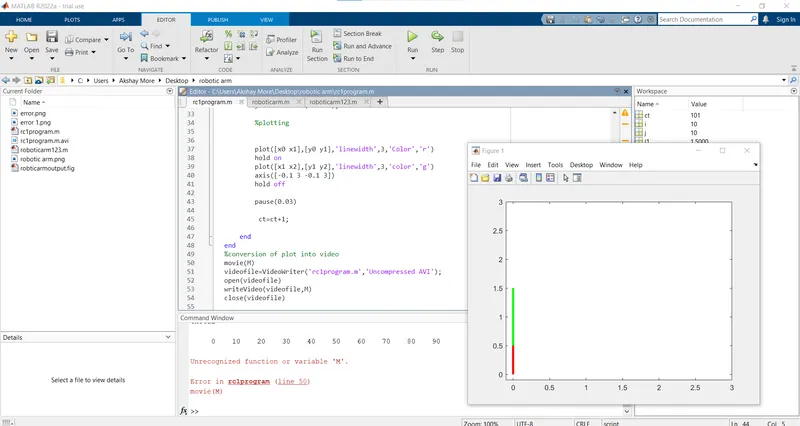
At time of practicing the program lots of errors happens with me here i am presenting 2 Majar errors
Error1. in formula of y2 y2=y1+l2sind(Theta2); at place of y1 is replace by x1