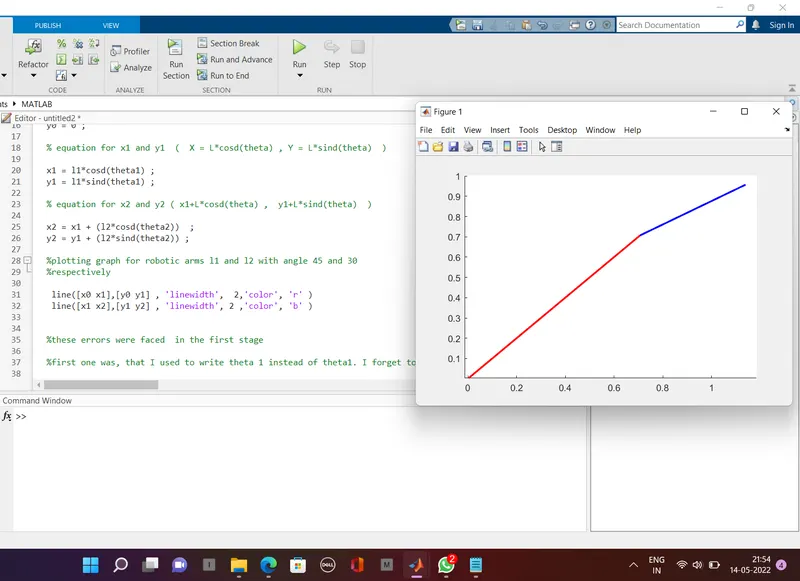
% forward kinematics of a robotic arm

clear   all
close all
clc

% inputs
l1 = 1;
l2 = 0.5;
theta1 = 45;
theta2 = 30;

% coordinates

x0 = 0 ;
y0 = 0 ;

% equation for x1 and y1  (  X = L*cosd(theta) , Y = L*sind(theta)  )

x1 = l1*cosd(theta1) ;
y1 = l1*sind(theta1) ;

% equation for x2 and y2 ( x1+L*cosd(theta) ,  y1+L*sind(theta)  )

x2 = x1 + (l2*cosd(theta2))  ;
y2 = y1 + (l2*sind(theta2)) ;

%plotting graph for robotic arms l1 and l2 with angle 45 and 30
%respectively

 line([x0 x1],[y0 y1] , 'linewidth',  2,'color', 'r' )
 line([x1 x2],[y1 y2] , 'linewidth', 2 ,'color', 'b' )


%these errors were faced  in the first stage

%first one was, that I used to write theta 1 instead of theta1. I forget to remove the space between theta and 1. I solved that. Then I wrote L2 instead of l2, however, I have solved it. Then I made a mistake in the line command instead of writing the same coordinate name in an array I wrote x0 and y0. At the time the error was shown, I corrected it by myself.

 2 main_program


clear all
close all
clc
 %inputs
% getting the result for different angles,and so we use linspace command
 theta1 = linspace (0,90, 10) ;
 theta2 = linspace(0 ,120 ,10) ;
 l1 = 1;
 l2 = .5;

 % figure(ctr ) used to plot graph for each value , and 100 graphs were plotted.
 % we can start ctr from 1 and excute in each for loop.

ctr=1;
 for i = 1: length(theta1)
     THETA1 = theta1(i);
      for j = 1: length(theta2)
          THETA2 = theta2(j);


% the  1 : length(theta1)  means  the value of i and j changes from 1 to 10
% but at a time it stores only one value
% THETA1 and THETA2 are variables not an array
% when i = 1 program will accept the 1st value, when i =2 take 2nd value ,
% etc..


x0 = 0 ;
y0 = 0 ;
x1 =         l1*cosd(THETA1) ;
y1 =         l1*sind(THETA1) ;

x2 = x1   +   l2*cosd(THETA2) ;
y2 = y1   +   l2*sind(THETA2) ;

% plotting

% changed the line command to plot command

%plot([x0 x1],[y0 y1] , 'linewidth', 2 ,'color', 'r' )
%plot([x1 x2],[y1 y2] , 'linewidth', 2 ,'color', 'b' )


% used single plot rather than two plots


% plot ([x0 x1],[y0 y1],[x1 x2],[y1 y2] , 'linewidth', 2 ,'color', 'r' )

% error faced

% both link are showed in red color
% to avoide that , just remove color command

 % using hold on command along with that to avoid geting only the last plot
 % by using pause command , we can visualise the movement

%hold on
%plot ([x0 x1],[y0 y1],[x1 x2],[y1 y2] , 'linewidth', 2  )
%pause(.03)


%fix a x limit and y limit by using axis command

plot ([x0 x1],[y0 y1],[x1 x2],[y1 y2] , 'linewidth', 2 )

axis([-0.5 2 -0.5 2])

% faced some error relate to axis values. for a clear visualization I
% prefer the above mentioned axis

 % by using pause command , we can visualise the movement

pause(.03)


% create a movie

% individual frames stored in an array called M
%getframe used to get the current figure window

M(ctr) = getframe(gcf);

ctr = ctr+1;


      end
 end


% after the end of  for loop , we use a Movie command to geneate a movie realte to
% above program
movie(M);

%create an avi file to store the movie
%we have to give file name and profile , that we done above in videofile
%command

videofile = VideoWriter('robotic arm.avi' , 'Uncompressed AVI') ;


open(videofile)
writeVideo(videofile,M)
%here  I faced an error
%I wrote writevideo instead of writeVideo ( v, V)
close(videofile)