Project 1 - Parsing NASA thermodynamic data
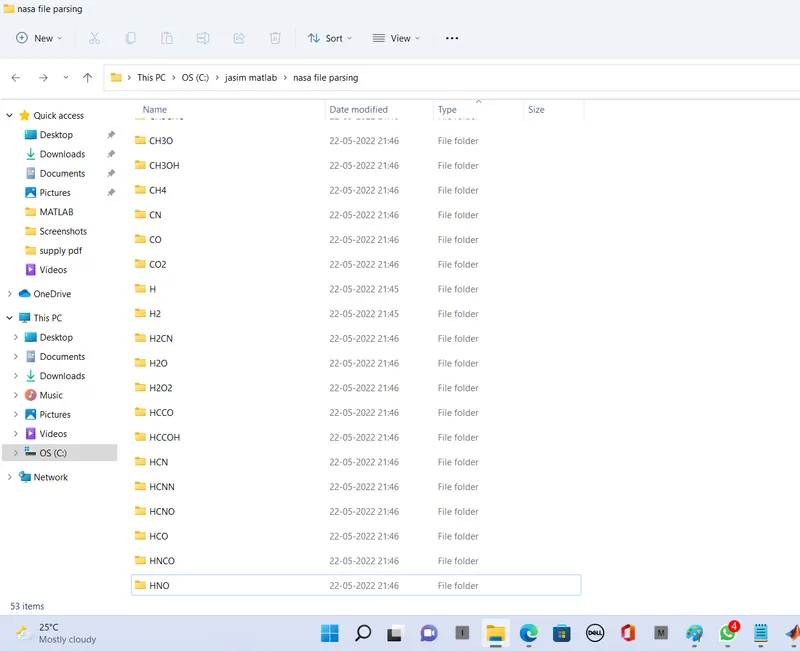
plot saving folders screen shot

 nn
nn
n2, o2, co2 plots shown here
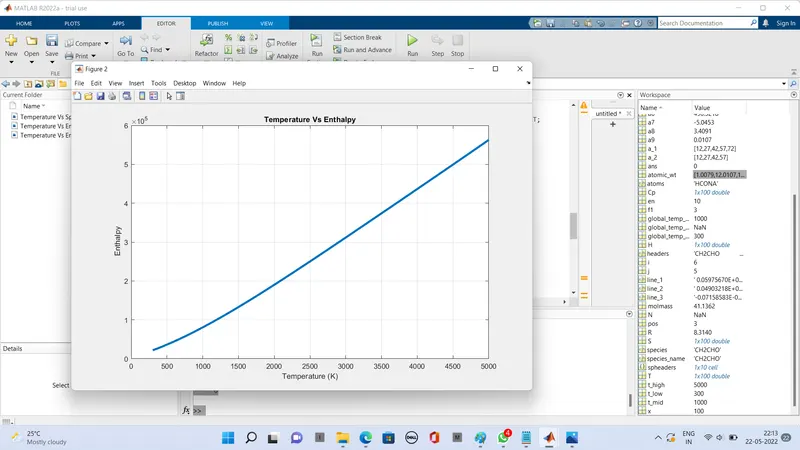
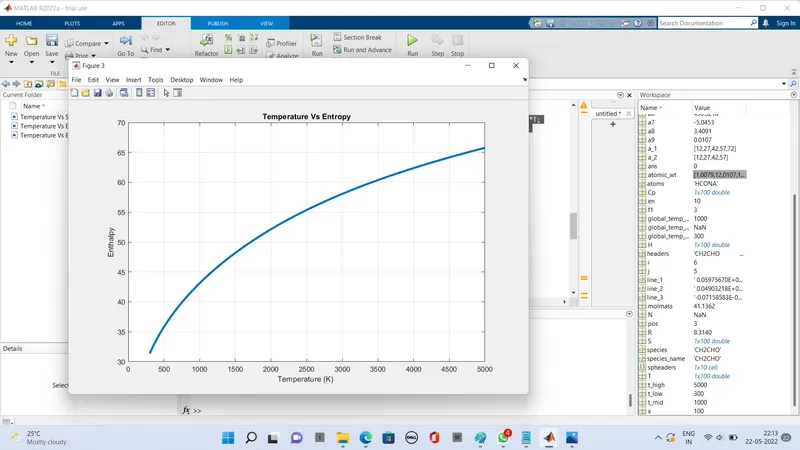
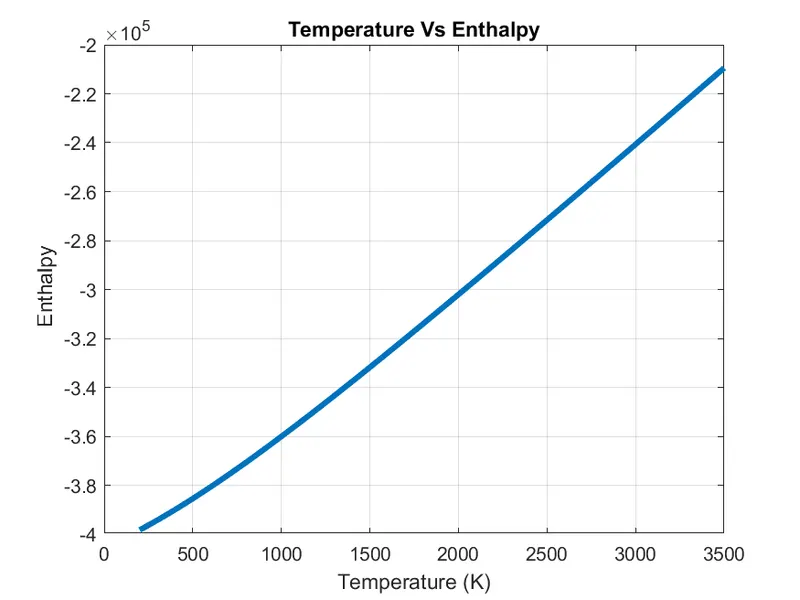
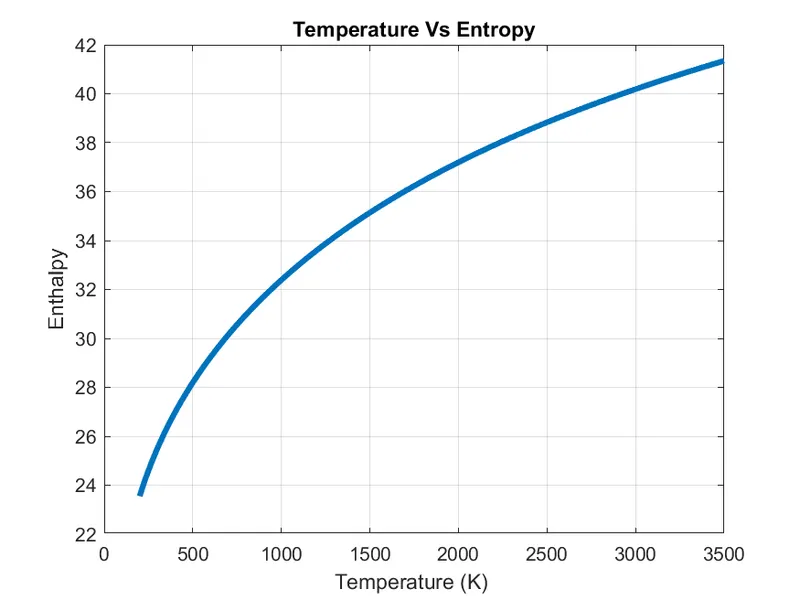
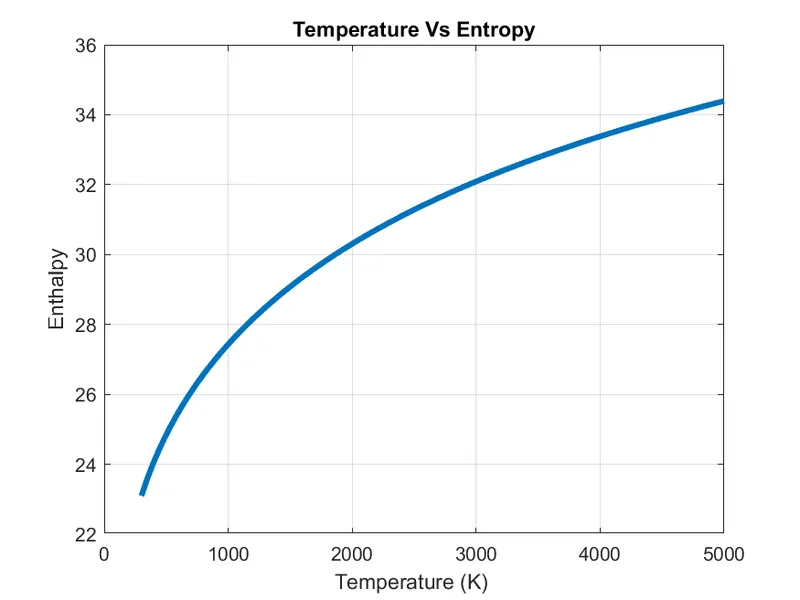
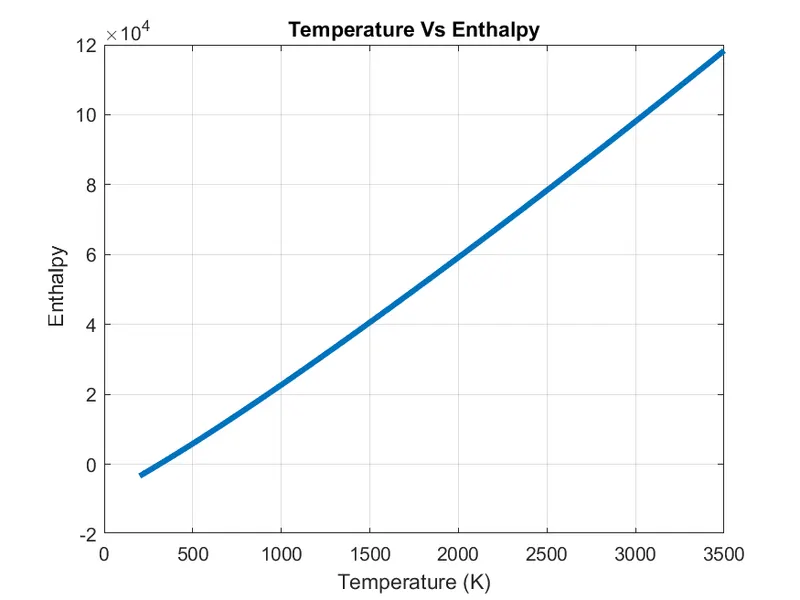
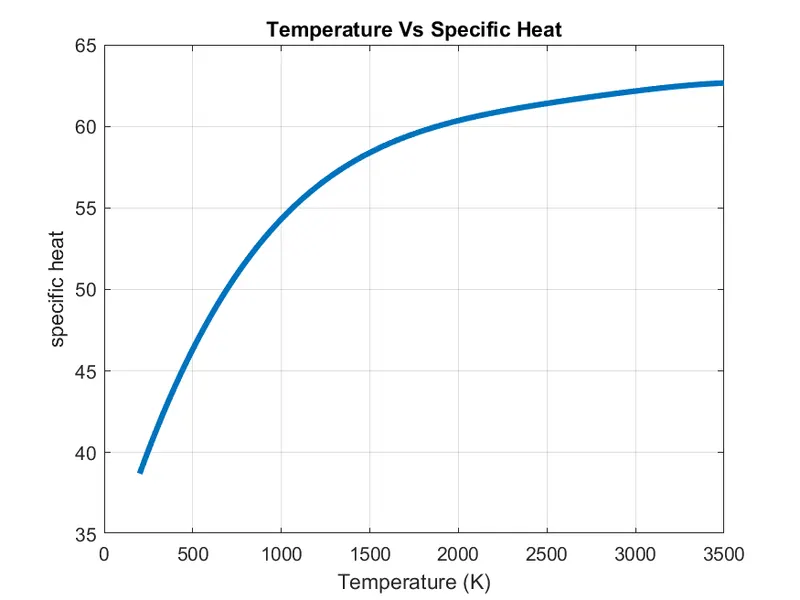
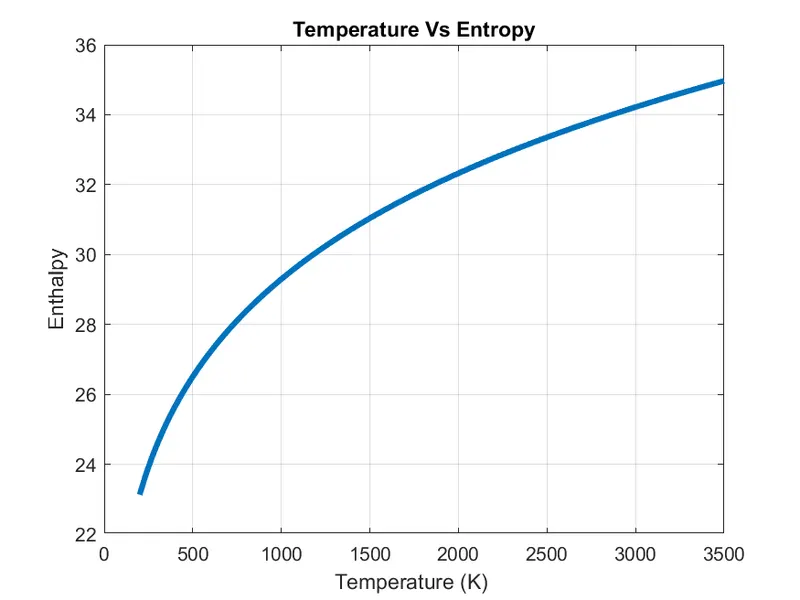
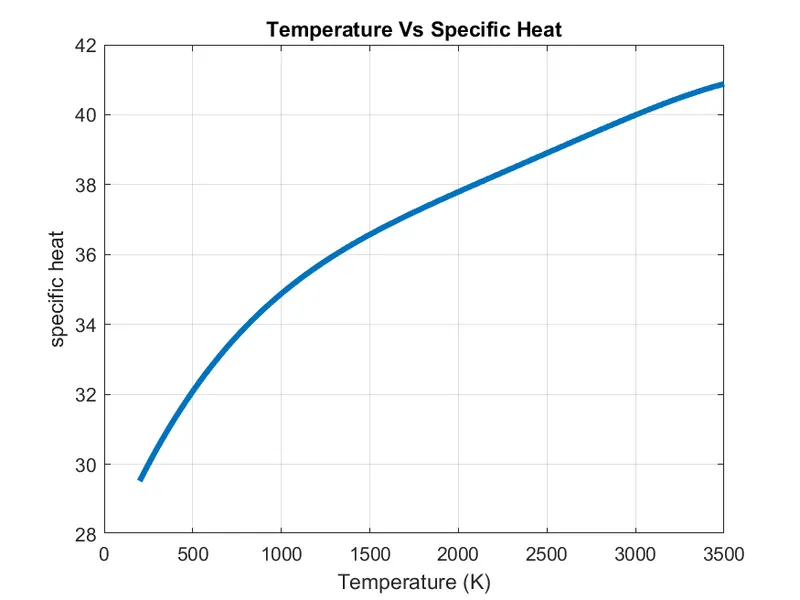
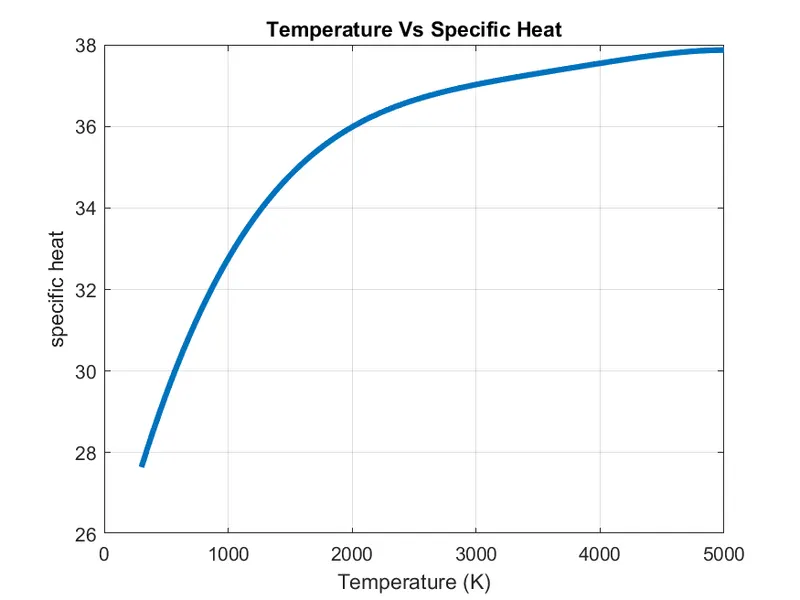
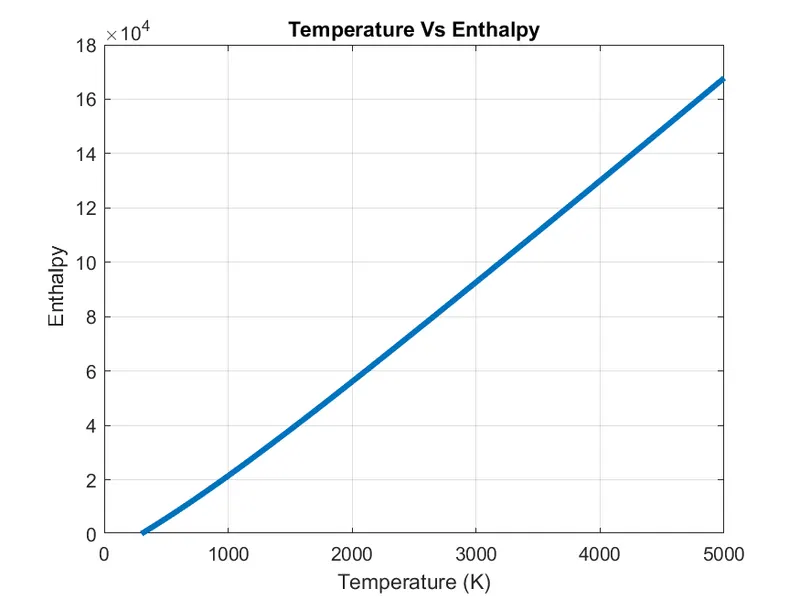 n2
n2
program

%Program to extract the 14 co-efficients and calculate Cp, H and s for all the species in the data file
clear all
close all
clc

%opening the file
f1 = fopen( 'THERMO.DAT', 'r');
fgetl(f1);

%Read the header file data
H = fgetl(f1);

%In nasa_data.dat, there is space between the string, we can eliminate it

%split the lines
H = strsplit (H, ' ');

%converting strings and using the data in cells.

global_temp_low = str2double(H{1});
global_temp_mid = str2double(H{2});
global_temp_high = str2double(H{3});

% Next three comments will skip after the temperature range.
for i = 1:3
fgetl(f1);
end

% working with the species

for i = 1:53
%Total No. of species is 53.
headers= fgetl(f1); %Skipping the header(0)
spheaders = strsplit(headers, ' ' );
species_name = spheaders {1};
en = length(spheaders); %en is the last column of the local temp line.

t_high = str2double(spheaders(en-2) );
t_mid = str2double(spheaders(en-1));
t_low = str2double( spheaders(en-3) ) ;

%extract the first five coefficients of first species
line_1 = fgetl(f1);

a = strfind(line_1, 'E' );
a1 = str2double(line_1(1:a(1)+3) );
a2 = str2double(line_1(a(1)+4:a(2)+3));
a3 = str2double(line_1(a(2)+4:a(3)+3) );
a4 = str2double(line_1(a(3)+4:a(4)+3) );
a5 = str2double(line_1(a(4)+4:a(5)+3) );

%Extract the Next five coefficients of first species
line_2 = fgetl(f1);

a_1 = strfind(line_2, 'E' );
a6 = str2double(line_2(1:a_1(1)+3));
a7 = str2double(line_2(a_1(1)+4:a_1(2)+3));
a8 = str2double(line_2(a_1(2)+4:a_1(3)+3) );
a9 = str2double(line_2(a_1(3)+4:a_1(4)+3) );
a10 = str2double(line_2(a_1(2)+4:a_1(5)+3));

%Extract the Next four coefficients of first species

line_3 = fgetl (f1);
a_2 = strfind(line_3, 'E' );
a11 = str2double(line_3(1:a_2(1)+3));
a12 = str2double(line_3(a_2(1)+4:a_1(2)+3));
a13 = str2double(line_3(a_2(3)+4:a_1(3)+3));
a14 = str2double(line_3(a_2(3)+4:a_1(4)+3));


%Creating a folder

mkdir(['C:\jasim matlab\nasa file parsing\',species_name])

%If T>1000 high temp coeff and if T<1000 Low temp coeff
T = linspace(t_low, t_high, 100) ;

R = 8.314;
%calculating Cp, H, and s
for x = 1: length(T)
%Finding high temp coefficients
if T(x) > t_mid

Cp = (a1 +( a2.*T) + (a3.*T.^2) + (a4.*T.^3) + (a5.*T.^4))*R;
H = (a1 + (a2.*T)/2 + (a3.*T.^2)/3 + (a4.*T.^3)/4 + (a5.*T.^4)/5 + (a6./T))*R.*T;
S = a1.*log(T) + (a2.*T) + (a3.*T.^2)/2 + (a4.*T.^3)/3 + (a5.*T.^4)/4 + a7;
else

%Finding Low temp coefficients
Cp = (a8 + a9.*T + a10.*T.^2 + a11.*T.^3 + a12.*T.^4)*R ;
H = (a8 + (a9.*T)/2 + (a10.*T.^2)/3 + (a11.*T.^3)/4 +(a12.*T.^4)/5 + (a13./T))*R.*T;
S = a8.*(log(T)) + (a9.*T) + (a10.*T.^2)/2 + (a11.*T.^3)/3 + (a12.*T.^4)/4 + a14;

end
end
%plotting the graphs

figure(1)
plot(T,Cp, 'linewidth' , 3);
grid on
title( 'Temperature Vs Specific Heat');
xlabel('Temperature (K)');
ylabel('specific heat' );

figure(2)
plot(T,H, 'linewidth', 3);
grid on
title('Temperature Vs Enthalpy');
xlabel('Temperature (K)' );
ylabel(' Enthalpy' );

figure(3)
plot(T,S, 'linewidth' ,3);
grid on
title( 'Temperature Vs Entropy' );
xlabel ( 'Temperature (K) ' );
ylabel ( 'Enthalpy' );

% we have many plots, so we have to save the plots in a folder.
% create folder to save plots
cd (['C:\jasim matlab\nasa file parsing\',species_name])
saveas (1, 'Temperature Vs Specific Heat', 'png' )
saveas (2, 'Temperature Vs Enthalpy' , 'png')
saveas (3, 'Temperature Vs Entropy' , 'png' )


%calculating the moleculer weight of each species.

species = species_name;

atoms = ['H', 'C' , 'O', 'N' , 'A'];
atomic_wt = [1.0079, 12.0107, 15.099, 14.0067, 39.948];

molmass = 0;
for i = 1: length(species)
for j = 1: length(atoms)
if strcmp(species(i),atoms(j)) ; %comparing the strings.

molmass = molmass + atomic_wt(j);
pos = j;
end
end
end

N = str2double(species(i)) ;
if N > 1
molmass = molmass + (atomic_wt (pos)*(N-1) );
end
disp(sprintf('Molecular Weight of %s is %f',species,molmass ))

end
fclose (f1)


explenation

Firstly download the THERMO.dat file
( but in the program,I used to open Nasa_data.dat because I renamed it during the programming process)


Then open the file
fopen( 'nasa_data.dat', 'r')


After that, we skipped the first line because we don't need that in our function
Then returns to the next line
To get the required data, we have to eliminate space between the strings
%split the lines
H = strsplit (H, ' ');


Then obtain the global temperature ranges from the data file by getting the data from a line and assigning it.

Also, there are 53 different items, we have to use the loop to obtain the plots.

Now we extract the coefficients from the data file. Set the index value and assign it to a variable,
we used 'strfind'

We can now find the variables with respect to the indexing variable that is already assigned. All the 14 coefficients are found in that same way.

Make a folder using 'mkdir' and creates a path to save the code data along with the species name.

by using the formulae , we find specific heat , enthalpy and entropy

Then plot the graphs

Save the plots


finally, we  Calculated the molecular weight of each species.


Molecular Weight of O is 15.099000
Molecular Weight of O2 is 30.198000
Molecular Weight of H is 1.007900
Molecular Weight of H2 is 2.015800
Molecular Weight of OH is 16.106900
Molecular Weight of H2O is 16.106900
Molecular Weight of HO2 is 31.205900
Molecular Weight of H2O2 is 31.205900
Molecular Weight of C is 12.010700
Molecular Weight of CH is 13.018600
Molecular Weight of CH2 is 14.026500
Molecular Weight of CH2(S) is 13.018600
Molecular Weight of CH3 is 15.034400
Molecular Weight of CH4 is 16.042300
Molecular Weight of CO is 27.109700
Molecular Weight of CO2 is 42.208700
Molecular Weight of HCO is 28.117600
Molecular Weight of CH2O is 28.117600
Molecular Weight of CH2OH is 29.125500
Molecular Weight of CH3O is 28.117600
Molecular Weight of CH3OH is 29.125500
Molecular Weight of C2H is 13.018600
Molecular Weight of C2H2 is 14.026500
Molecular Weight of C2H3 is 15.034400
Molecular Weight of C2H4 is 16.042300
Molecular Weight of C2H5 is 17.050200
Molecular Weight of C2H6 is 18.058100
Molecular Weight of CH2CO is 40.128300
Molecular Weight of HCCO is 40.128300
Molecular Weight of HCCOH is 41.136200
Molecular Weight of H2CN is 27.025300
Molecular Weight of HCN is 27.025300
Molecular Weight of HNO is 30.113600
Molecular Weight of N is 14.006700
Molecular Weight of NNH is 29.021300
Molecular Weight of N2O is 29.105700
Molecular Weight of NH is 15.014600
Molecular Weight of NH2 is 16.022500
Molecular Weight of NH3 is 17.030400
Molecular Weight of NO is 29.105700
Molecular Weight of NO2 is 44.204700
Molecular Weight of HCNO is 42.124300
Molecular Weight of HOCN is 42.124300
Molecular Weight of HNCO is 42.124300
Molecular Weight of NCO is 41.116400
Molecular Weight of CN is 26.017400
Molecular Weight of HCNN is 41.032000
Molecular Weight of N2 is 28.013400
Molecular Weight of AR is 39.948000
Molecular Weight of C3H8 is 20.073900
Molecular Weight of C3H7 is 19.066000
Molecular Weight of CH3CHO is 41.136200
Molecular Weight of CH2CHO is 41.136200

ans =

     0

>>