Week 11: FSAE Car Project
Aim
To simulate the flow over FSAE car for two different races using converge and understand the drag and lift force parameters for the same. The Race Track specifications are as follows:
1) Race 1:
- Racing track conditions - Lot of turns
- Average lap speeds - 45kmph
- 70% turns at 45 degrees, 20% turns at 80 degrees, 10% turns at 20 degrees
2) Race 2:
- Racing track conditions - Straights
- Average lap speed - 75kmph
The geometry used in the simulation.
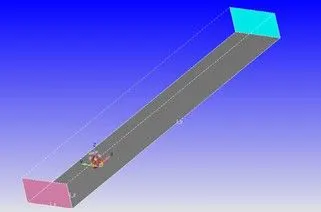
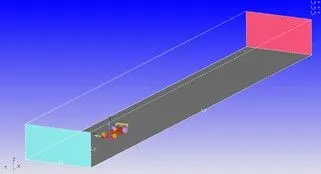
Setup-
Application Type
Time-based
Materials
Species: O2 and N2 were selected from the gas data.
Simulation Parameters:
Run Parameters:
Transient, Time based simulation, full hydrodynamic solver, compressible.
Simulation Time Parameters:
Start time : 0.0 s
end time : 5.2 s
initial time step/min time step: 1e-7/1e-7
max time step:1.0
max convection/diffusion CFL limit: 1.0 / 2.0
Solver Parameters:
PISO Navier stokes solver scheme
Boundary Conditions:
• Body - wall, stationary, fixed, law of wall, temperature – law of wall, 300K
• Rear wing - wall, stationary, fixed, law of wall, temperature – law of wall, 300K
• Front wheels - wall, stationary, fixed, law of wall, temperature – law of wall, 300K
• Rear wheels - wall, stationary, fixed, law of wall, temperature – law of wall, 300K
• Inlet – Inflow – Pressure – Zero normal gradient, Velocity – 20.833 m/s (x) (Race 1), 12.5 m/s (x) (Race 2), Temperature – 300K, Species - O2 and N2
• Front suspension right - wall, stationary, fixed, law of wall, temperature – law of wall, 300K
• Front suspension left - wall, stationary, fixed, law of wall, temperature – law of wall, 300K
• Rear suspension right - wall, stationary, fixed, law of wall, temperature – law of wall, 300K
• Rear suspension left - wall, stationary, fixed, law of wall, temperature – law of wall, 300K
• Front wing left - wall, stationary, fixed, law of wall, temperature – law of wall, 300K
• Front wing right - wall, stationary, fixed, law of wall, temperature – law of wall, 300K
• Underbody - wall, stationary, fixed, law of wall, temperature – law of wall, 300K
• Human - wall, stationary, fixed, law of wall, temperature – law of wall, 300K
• Symmetry – symmetry type
• Outlet – Outflow – Pressure – 101325Pa, Velocity – Zero normal gradient, Temperature – 300K, Air – O2 and N2
• Bottom wall - wall, stationary, fixed, law of wall, temperature – law of wall, 300K
Initial conditions and Events
Regions and Initial conditions:
• Region 0
Velocity – 20.833 m/s (x) (Race 1), 12.5 m/s (x) (Race 2)
Pressure – 101325Pa
O2 - 0.23
N2 - 0.77
Temperature – 300k
Physical Models
Turbulence Modeling:
Standard k-w 2006 model
Grid Control
Base Grid:
dx=0.32m dy= 0.25m dz=0.25m
Fixed Embedding:
Embedding 13
Entity: box
Mode: permanent
Scale: 3
Center of box given
Length in each direction – dx/2=4.5m, dy/2=1.0m, dz/2=1.0m
Embedding 1
Entity: Boundary
Boundary ID: Underbody
Mode: Permanent
Scale: 5
Embed Layers: 1
Embedding 2
Entity: Boundary
Boundary ID: Front wheels
Mode: Permanent
Scale: 5
Embed Layers: 1
Embedding 3
Entity: Boundary
Boundary ID: Front wing right
Mode: Permanent
Scale: 5
Embed Layers: 1
Embedding 4
Entity: Boundary
Boundary ID: Front wing left
Mode: Permanent
Scale: 5
Embed Layers: 1
Embedding 5
Entity: Boundary
Boundary ID: Rear wheels
Mode: Permanent
Scale: 5
Embed Layers: 1
Embedding 6
Entity: Boundary
Boundary ID: Human
Mode: Permanent
Scale: 5
Embed Layers: 1
Embedding 7
Entity: Boundary
Boundary ID: body
Mode: Permanent
Scale: 5
Embed Layers: 1
Embedding 8
Entity: Boundary
Boundary ID: Rear wing
Mode: Permanent
Scale: 5
Embed Layers: 1
Embedding 9
Entity: Boundary
Boundary ID: Front suspension left
Mode: Permanent
Scale: 5
Embed Layers: 1
Embedding 1
Entity: Boundary
Boundary ID: Front suspension right
Mode: Permanent
Scale: 5
Embed Layers: 1
Embedding 11
Entity: Boundary
Boundary ID: Rear suspension right
Mode: Permanent
Scale: 5
Embed Layers: 1
Embedding 12
Entity: Boundary
Boundary ID: Rear suspension left
Mode: Permanent
Scale: 5
Embed Layers: 1
Grid Scaling:
Time Value
0 -3
8 -2
14 -1
20 0
Output/Post Processing
Post variable selection:
Y+ was turned on in Turbulence
Mesh
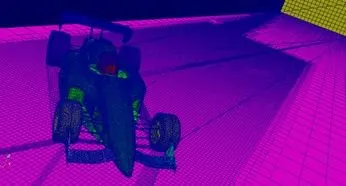
Graphs
Straight Track
Total Cells
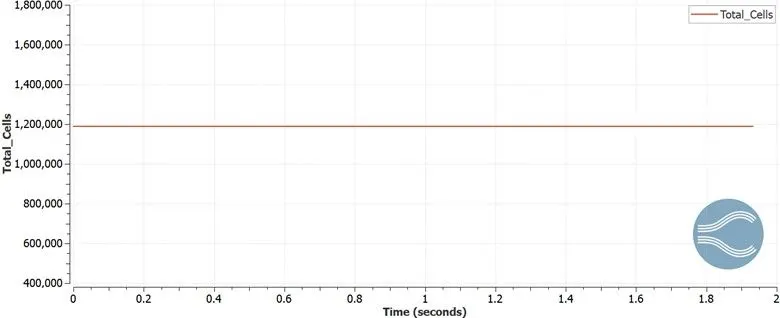
The total no of cells present in the geometry are about 1200000.
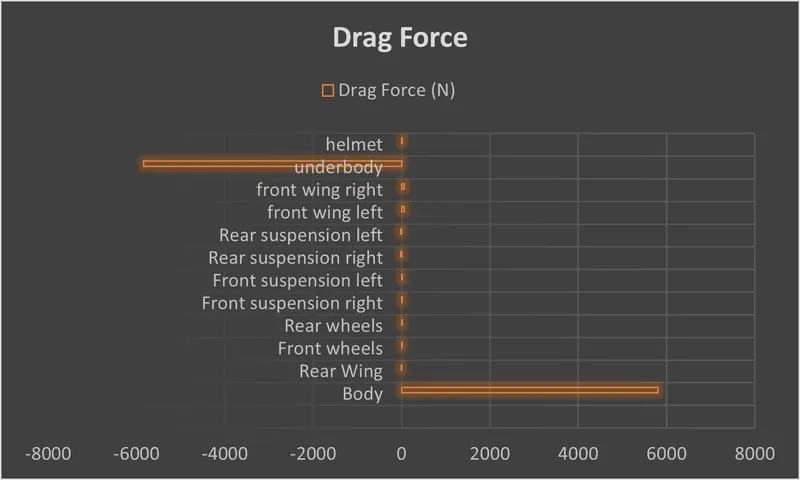
The graphs below show the drag force on each component of the vehicle.
Drag Force Body
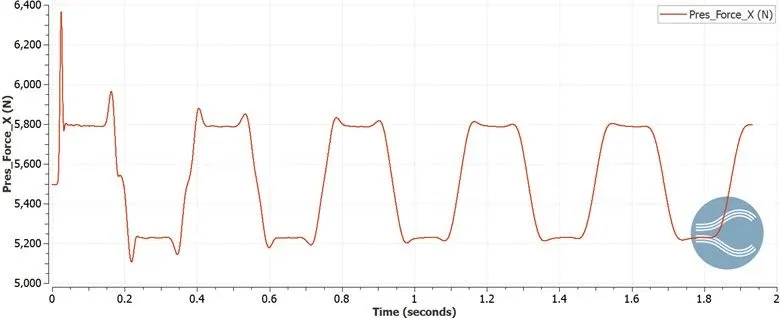
Drag Force = 5800N
Front wing right
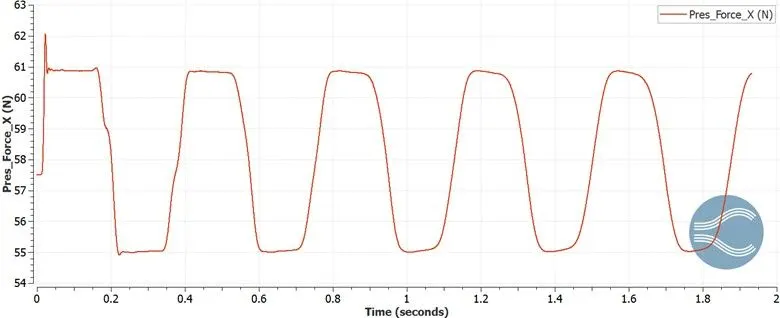
Drag Force=60.8N
Front wing left
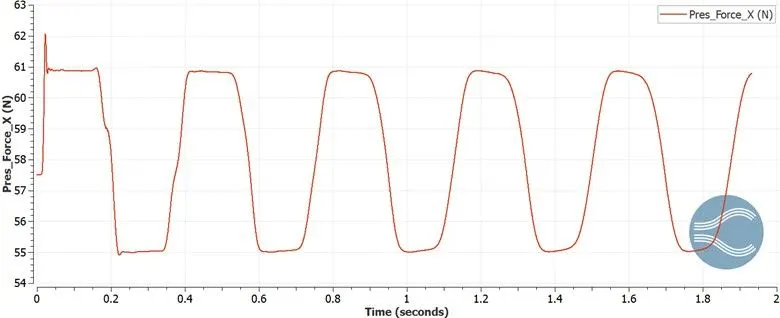
Drag force = 60.8N
Underbody
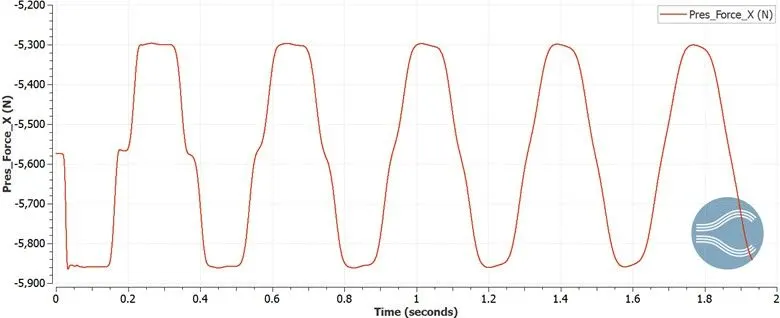
Drag force = -5840N
Helmet
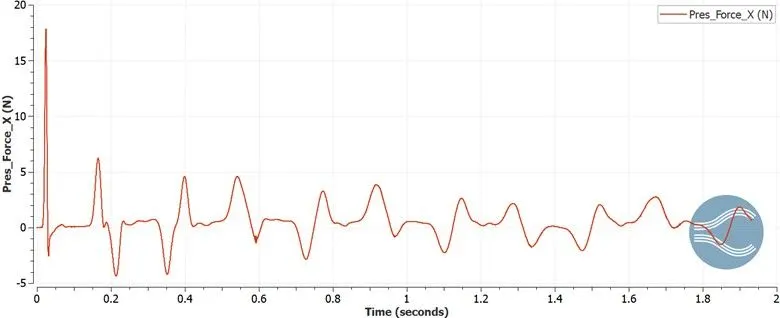
Drag force= 1 N
Rear wing
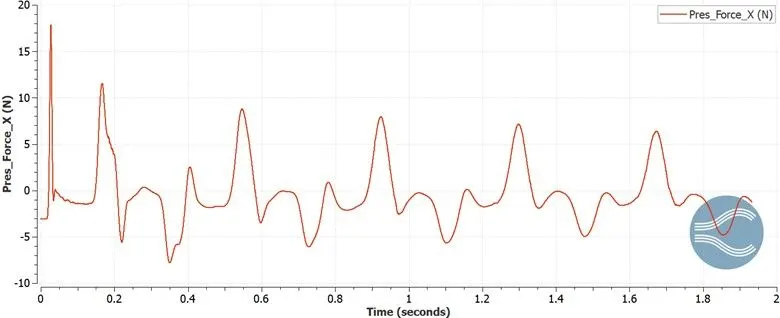
Drag Force=-1N
front wheels
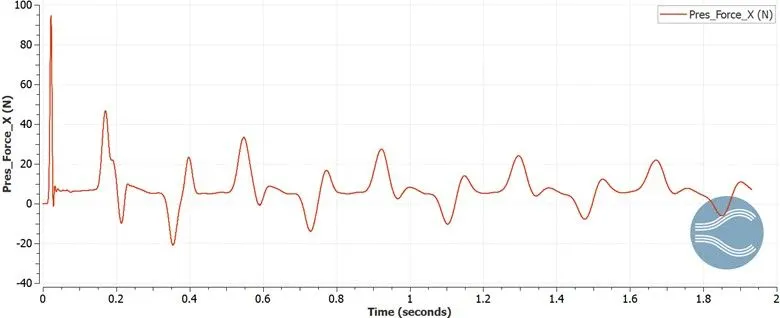
Drag force = 10N
Rear wheels
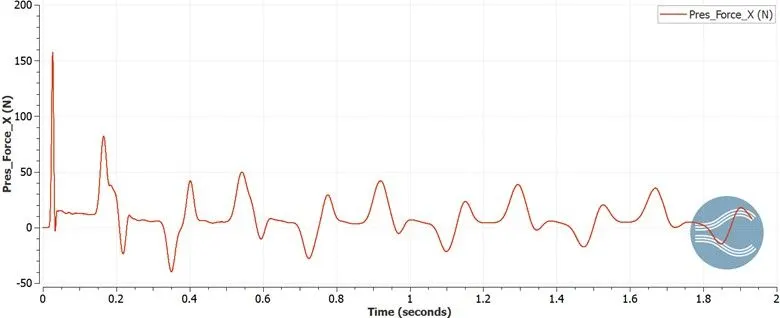
Drag Force = 10N
Front suspension right
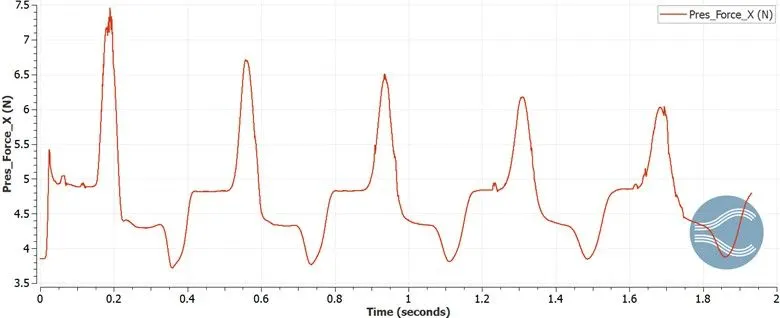
Drag Force=4.8N
Front suspension left
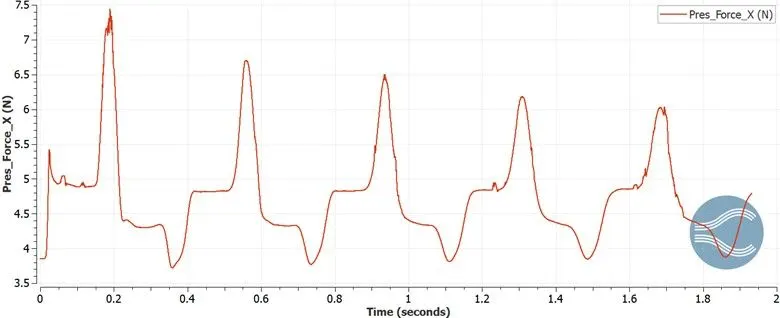
Drag Force=4.8N
Rear suspension right
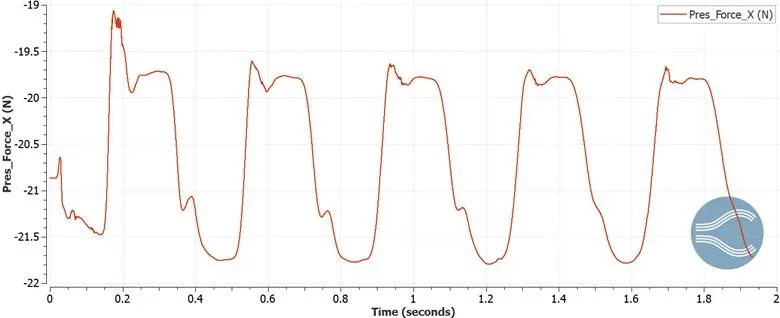
Drag Force = -21.7N
Rear suspension left
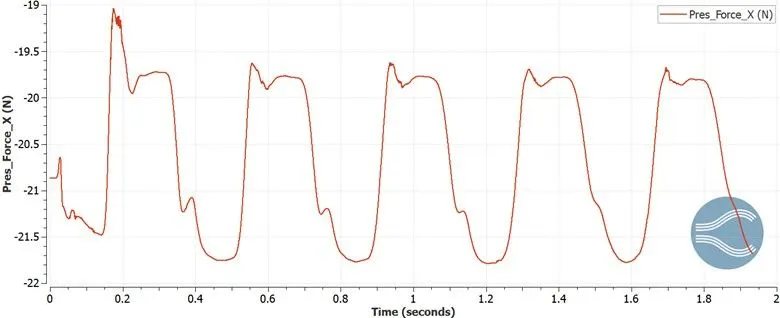
Drag Force = -21.7N
The drag force graphs shown above show varying pattern for each of the component as they are transient simulation. Thus, they don’t converge as the simulation reaches end time for each part. The average of these values are suppose to be taken.
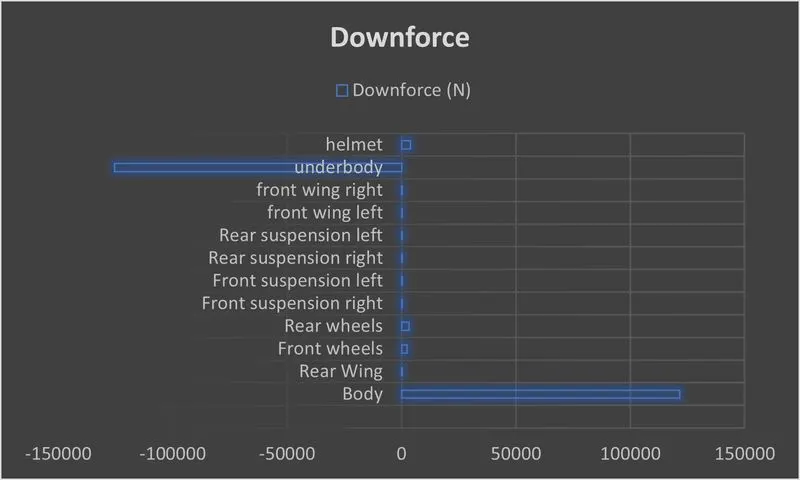
The graphs below show the downforce on each component of the vehicle.
Lift Force
Body
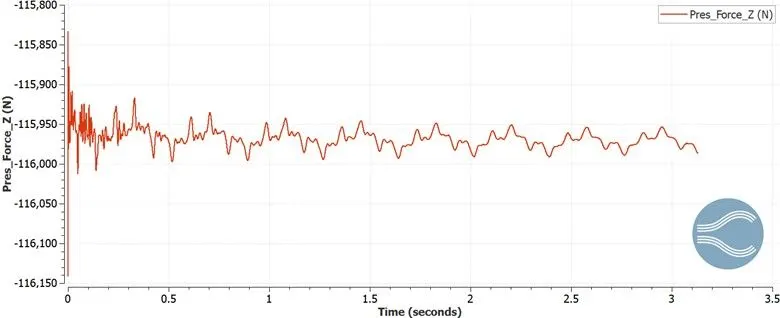
Downforce = 121500N
Front wing left
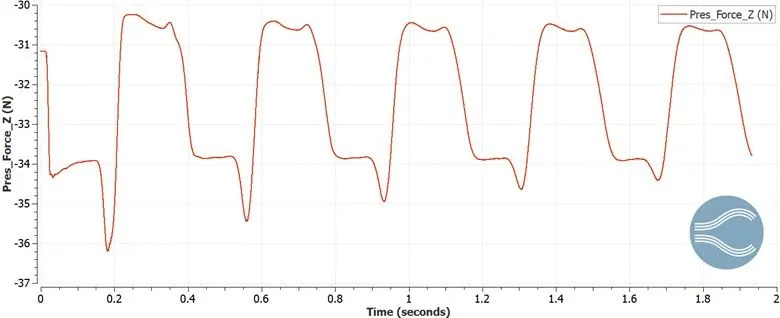
Downforce = 33.8N
Front wing right
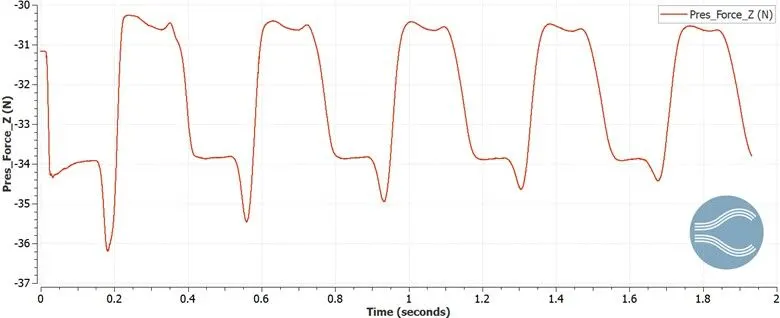
Downforce = 33.8N
Underbody
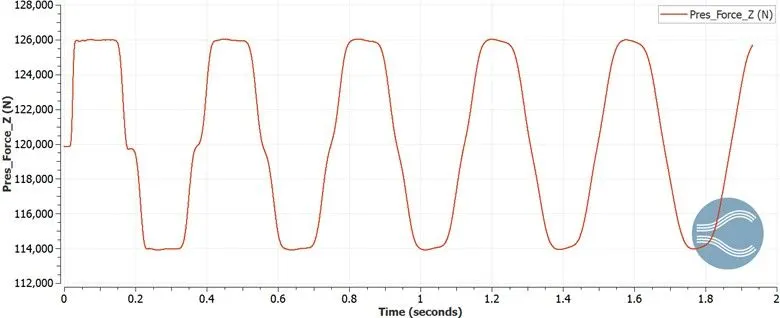
Downforce = -125500N
Helmet
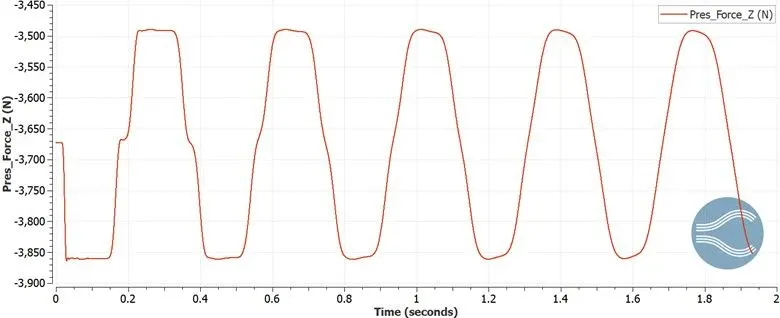
Downforce = 3850N
Rear wing
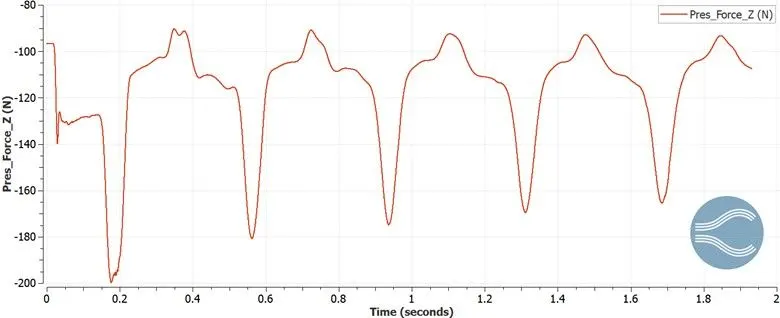
Downforce = 110N
Front wheels
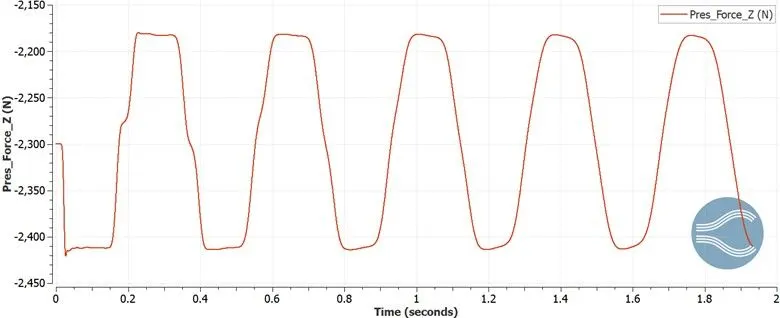
Downforce = 2410N
Rear wheels
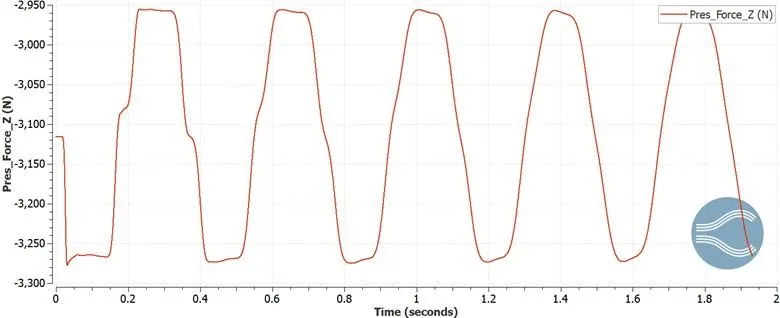
Downforce = 3270N
Front suspension right
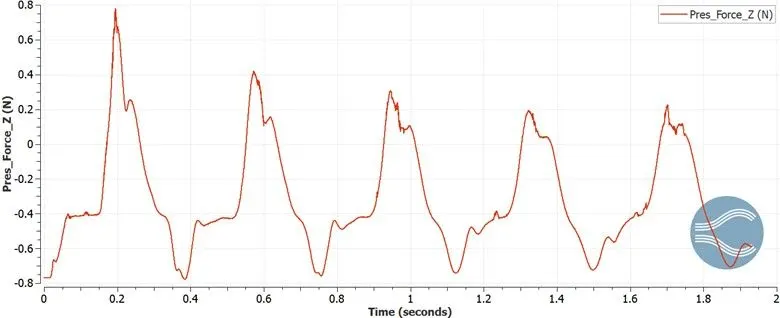
Downforce = 0.6N
Front suspension left
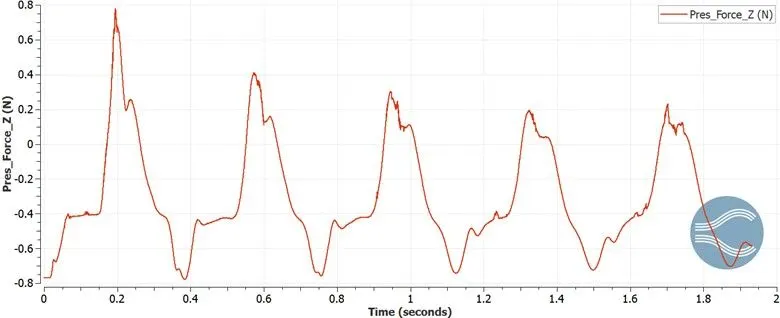
Downforce = 0.6N
Rear suspension right
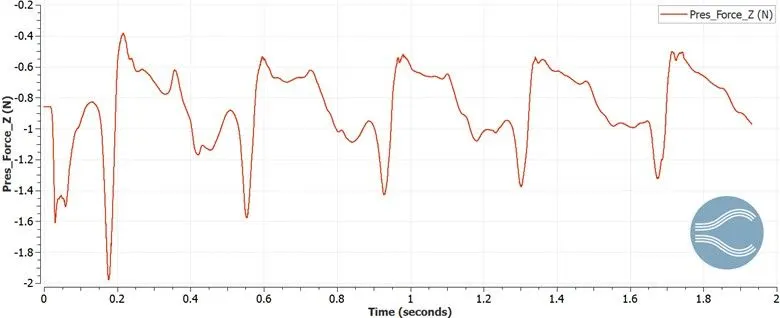
Downforce = 1N
Rear suspension left
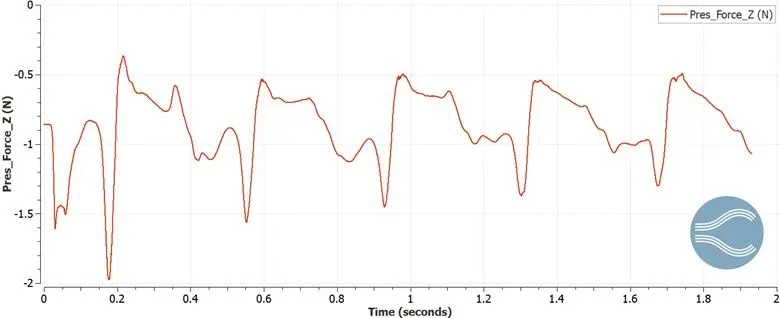
Downforce = 1.1N
Yplus body Straight Track
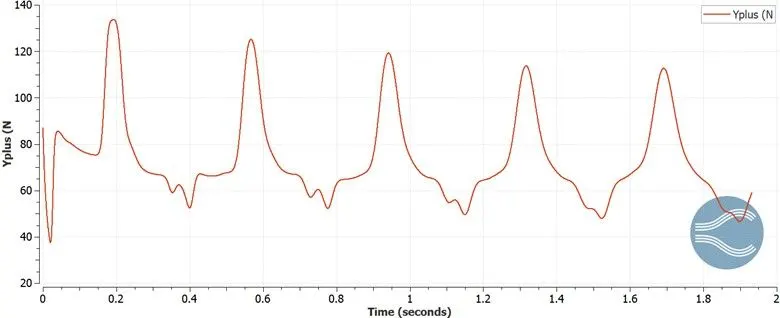
The Downforce/lift force graphs shown above show varying pattern for each of the component as they are transient simulation. Thus, they don’t converge as the simulation reaches end time for each part. The average of these values are suppose to be taken.
Turn Track
Total cells
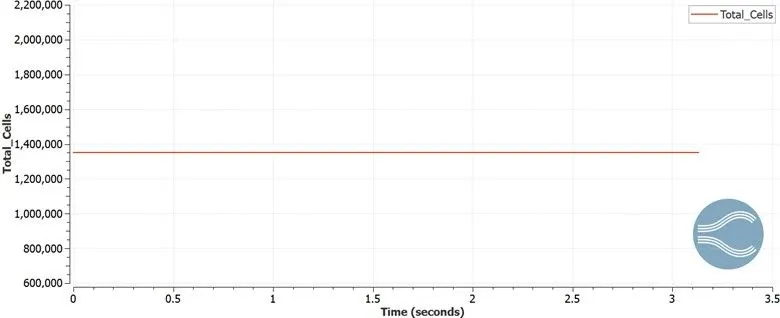
The total no of cells present in the geometry are about 1350000.
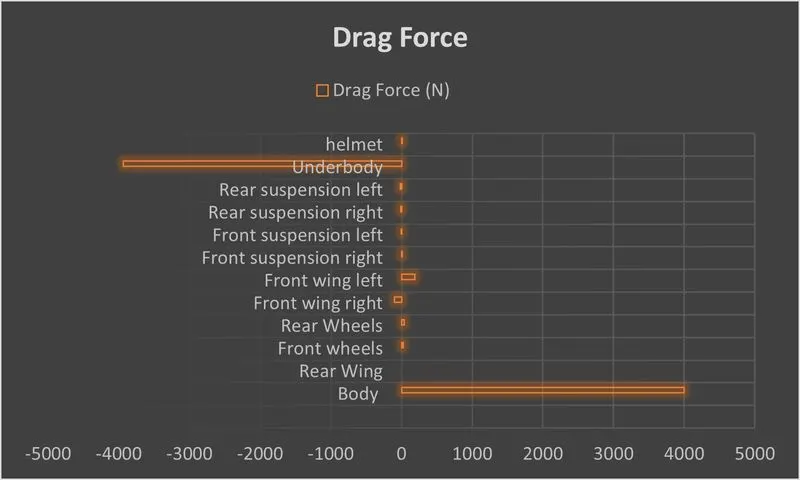
The graphs below show the drag force on each component of the vehicle.
Drag Force Body Turn Track
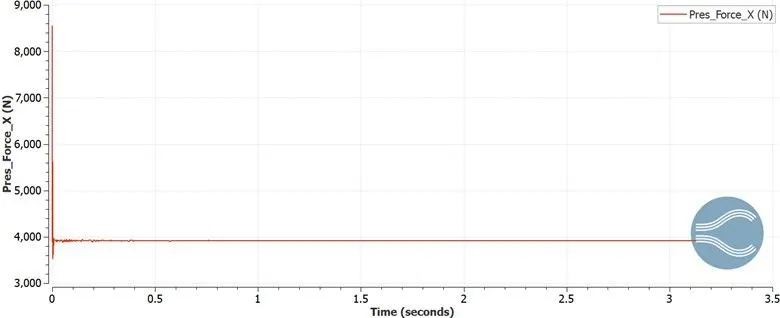
Drag force = 4000N
Rear suspension left
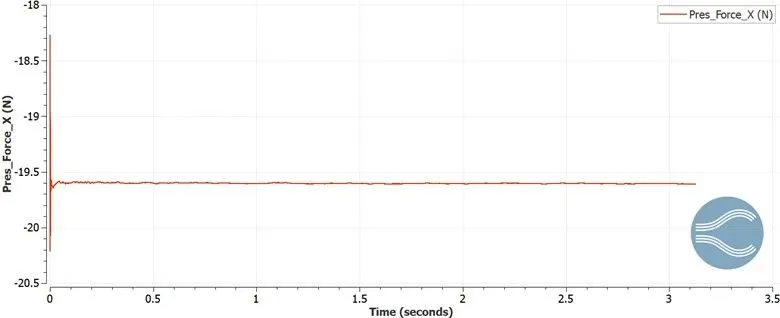
Drag force = -19.6N
Helmet
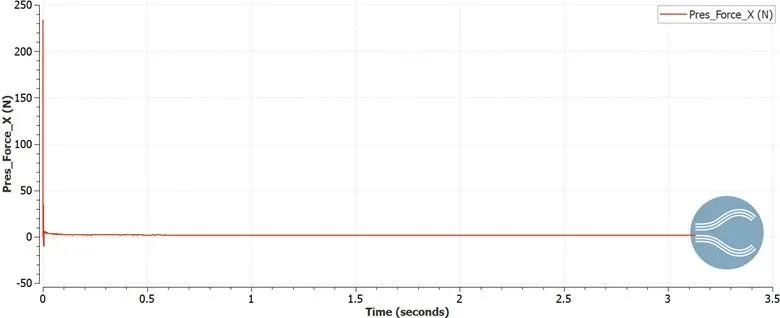
Drag force = 7N
Underbody
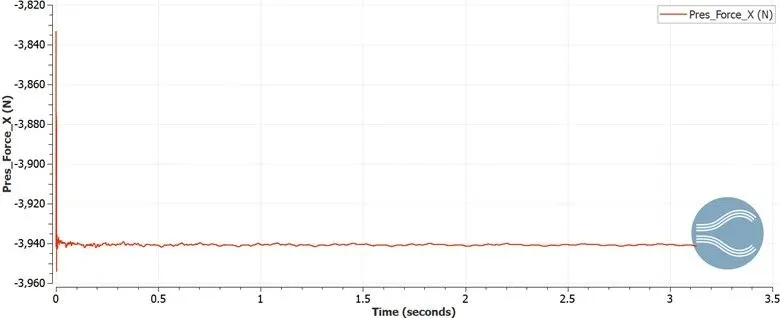
Drag force = -3940N
Rear wing
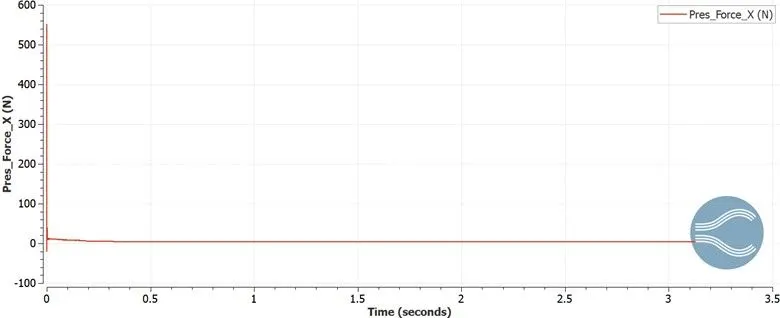
Drag force = 0N
Front wheels
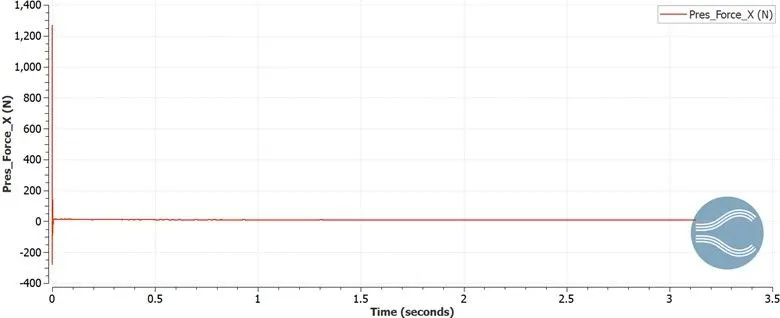
Drag force = 25N
Rear wheels
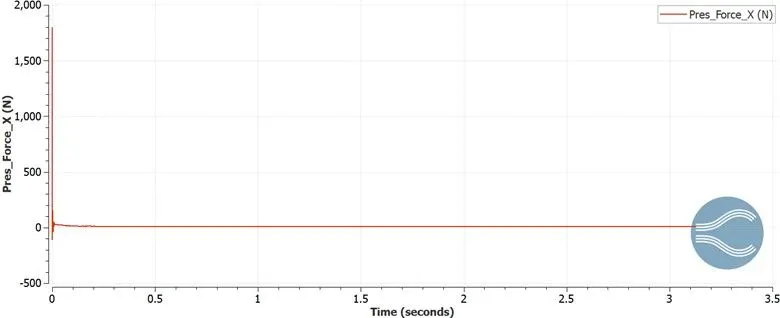
Drag force = 40N
Front wing right
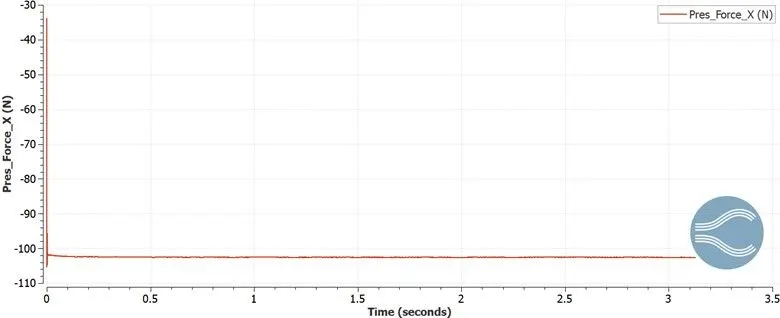
Drag force = -102N
Front wing left
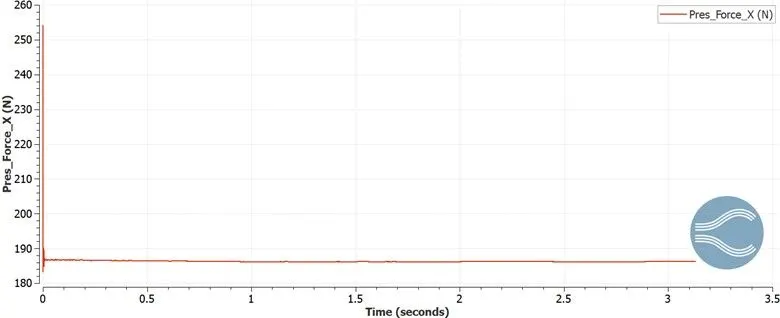
Drag force = 186N
Front suspension right
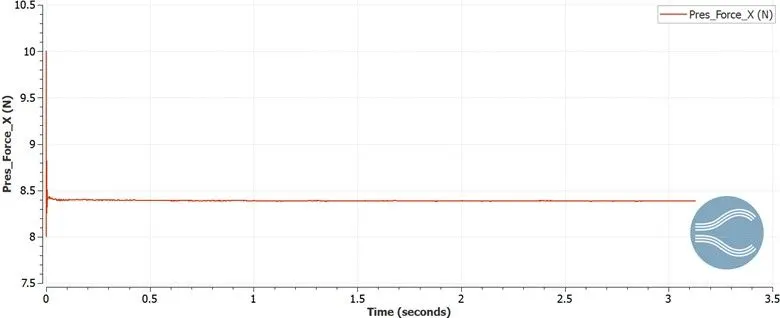
Drag force = 8.4N
Front suspension left
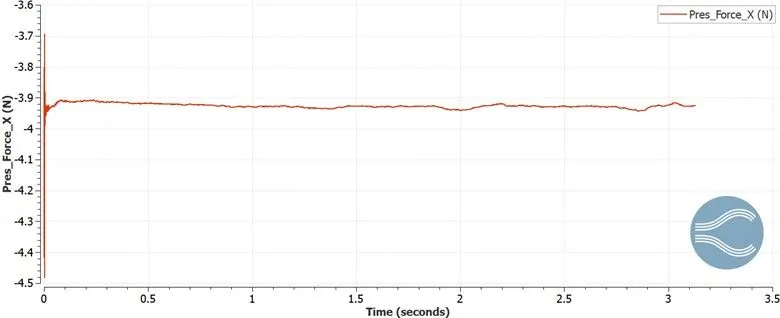
Drag force = -3.92N
Rear suspension right
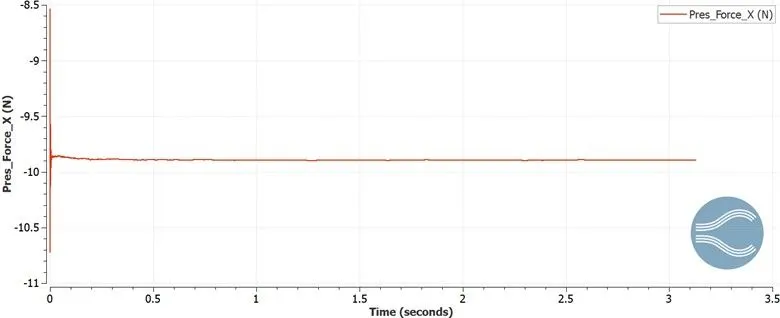
Drag force = -9.8N
The drag force graphs shown above show varying pattern for each of the component as they are transient simulation. Thus, they don’t converge as the simulation reaches end time for each part. The average of these values are suppose to be taken.
Turn Track
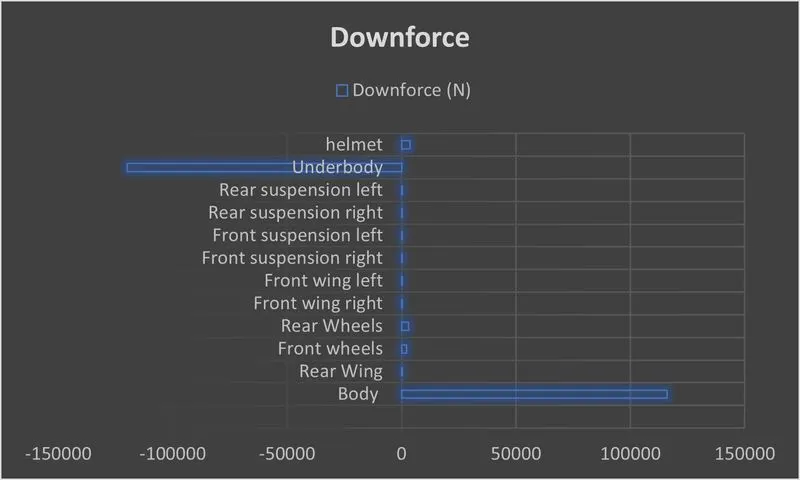
The graphs below show the down force on each component of the vehicle.
Lift Force Body
Downforce = 115980N
Rear suspension left
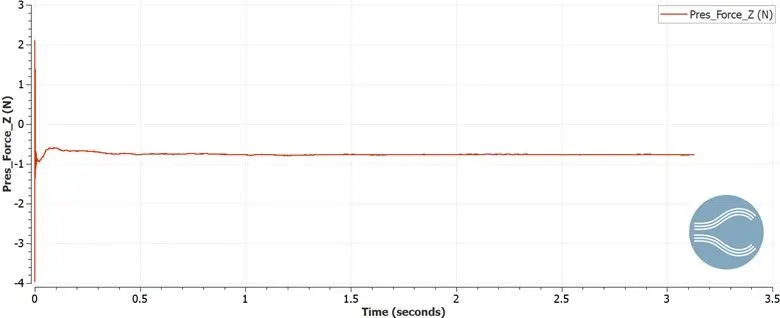
Downforce = 0.8N
Underbody
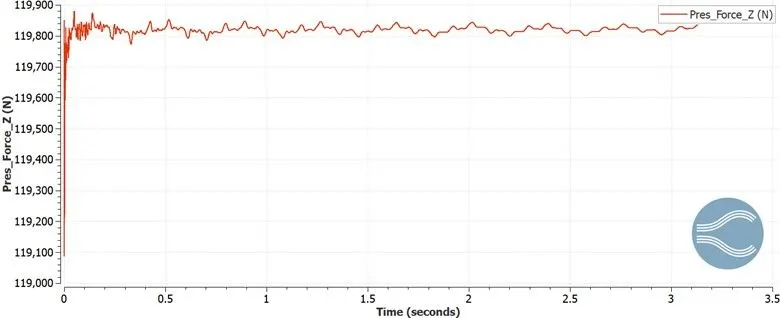
Downforce = -119840N
Helmet
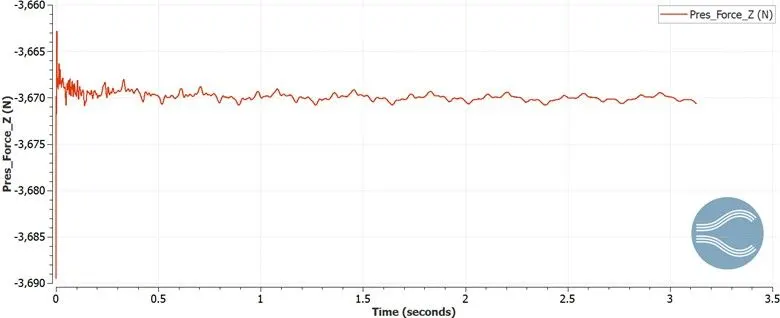
Downforce = 3670N
Rear wing
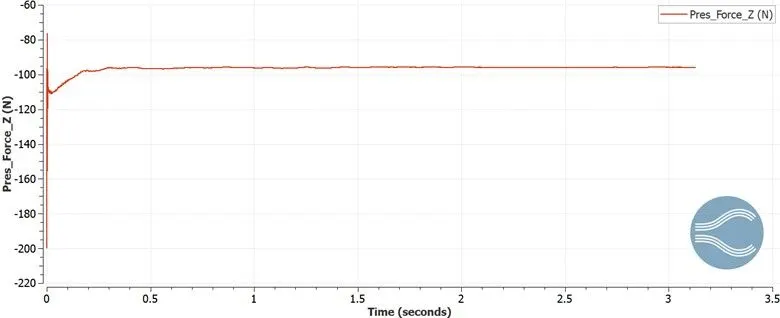
Downforce = 95N
Front wheels
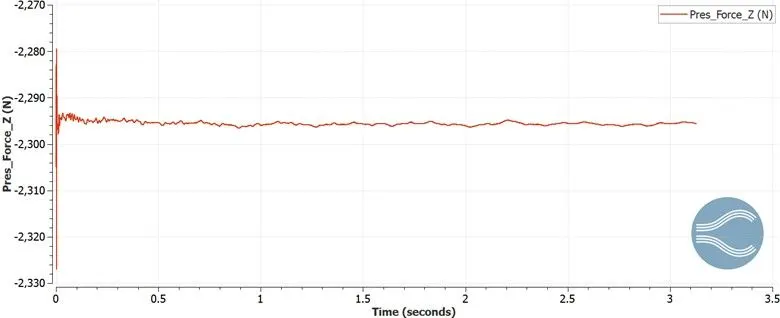
Downforce = 2295N
Rear wheels
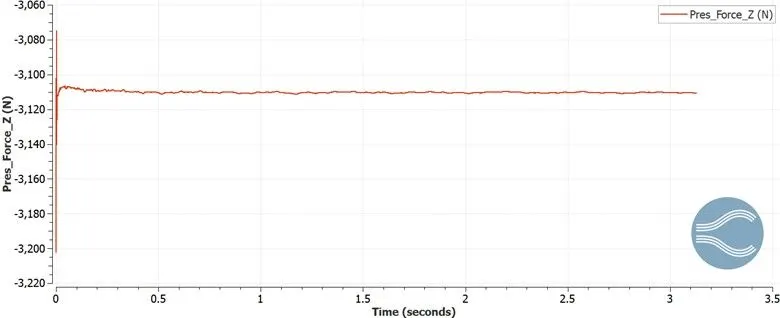
Downforce = 3110N
Front wing right
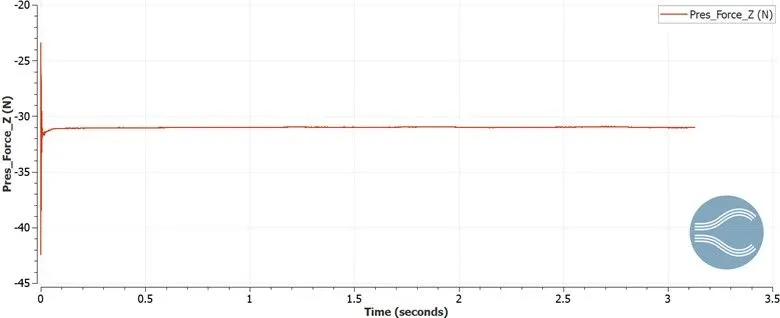
Downforce = 31N
Front wing left
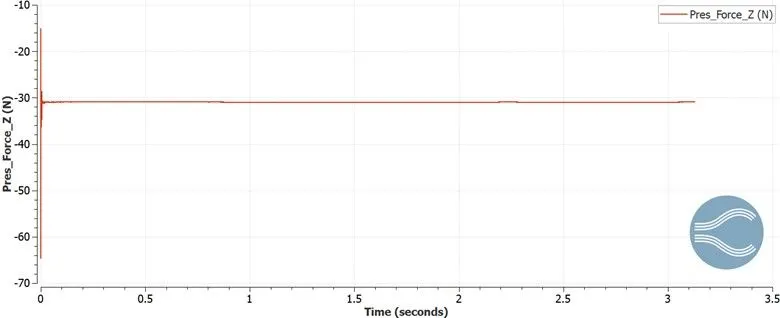
Downforce = 32N
Front suspension right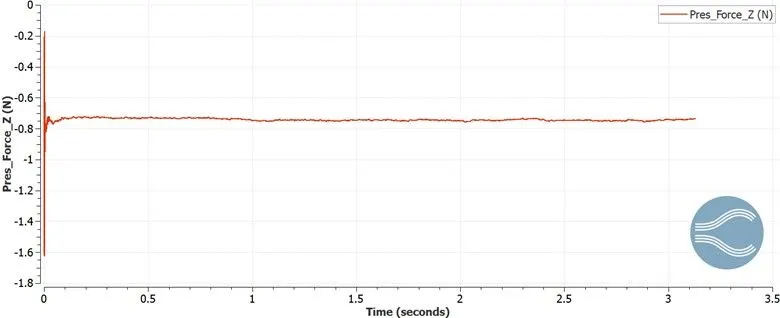
Downforce = 0.75N
Front suspension left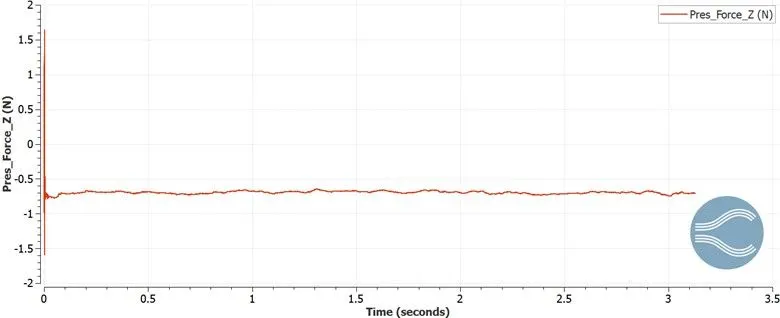
Downforce = 0.7N
Rear suspension right
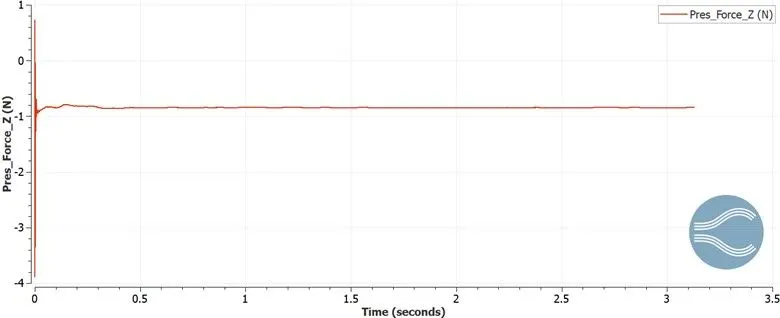
Downforce = 0.8N
Yplus Turn Track
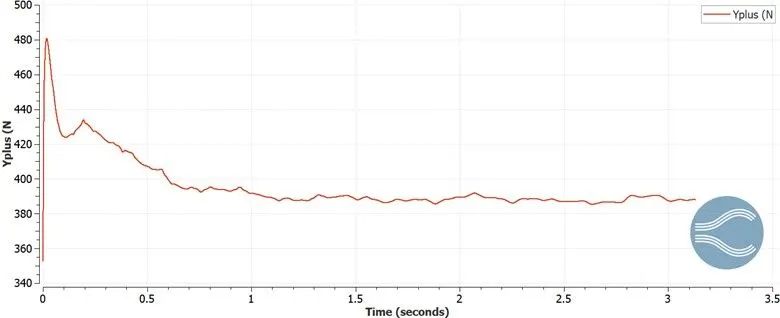
The downforce/lift force graphs shown above show varying pattern for each of the component as they are transient simulation. Thus, they don’t converge as the simulation reaches end time for each part. The average of these values are suppose to be taken.
Force Graph
The bar graphs below show the drag force and downforce distributed all over body for each of the components. The max forces are generally seen for underbody and body.
Straight Track
Drag Force
Downforce
Turn Track
Drag force
Downforce
Contours
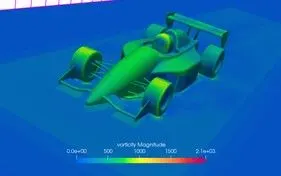
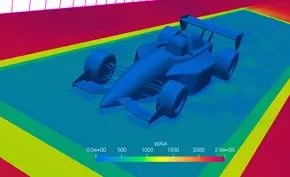
Straight Track
Velocity
Pressure
Vorticity
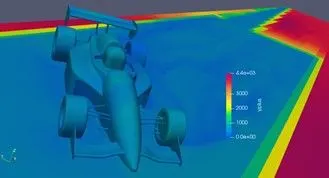
Yplus
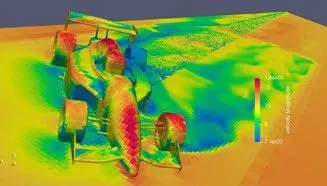
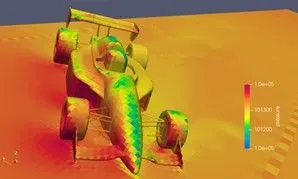
Turn Track
Velocity
Pressure
Vorticity
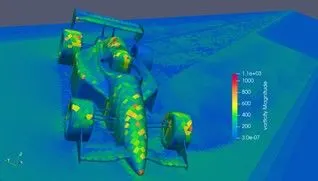
Yplus
Conclusion:
The project aim was to simulate the flow over FSAE car for two different races using converge and understand the drag and lift forces on each part. The races included straight track and track with lots of turns.
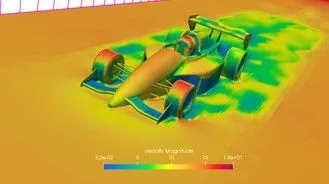
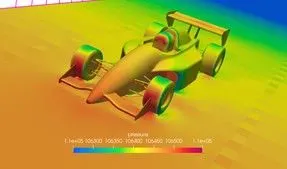
The velocity, pressure, Vorticity and yplus contours were seen.
The drag and downforces for each part was done.