Week-11 Challenge: Braking
1:For a defined driving cycle, calculate the energy required for braking.
As with any system, the process of braking must follow the principal of conservation of energy. Energy cannot be created or destroyed but only converted from one form to another,
∑EIN=∑EOUT
The energy present in an object in motion is given by the following equation:
EKINETIC=mv^2/2
where,
m- mass of the object in Kilogram(Kg),
v - velocity of the object in meters per second(m/s),
EKINETIC - Kinetic energy in Joules(J)
From this above equation, and assuming the mass of the object is constant, it is clear the in order to remove the kinetic energy from the system, the velocity must be brought to zero.
Braking is the process of controlling the velocity of an object by inhibiting its motion. An object in motion possesses kinetic energy and to bring the object to a stop this kinetic energy must be removed. Removing the kinetic energy can be accomplished by dissipating the energy to the atmosphere through friction or by converting it into another form of energy. The most common type of braking is a mechanical brake which inhibits motion through friction brake pads.A mechanical brake applies a friction force to convert the kinetic energy of the vehicle into thermal energy which then dissipates into the atmosphere. Braking systems which don't use friction are referred to as Regenerative Braking System (RBS). In RBS, the kinetic energy is converted into other forms of useful energy, which can be stored for later use, increasing fuel efficiency.
Braking Energy Calculation :
For Calculating the Energy required for Braking, Drivecycle data is prepared in the Excel sheet, which Drive cycle data includes Time and Speed.
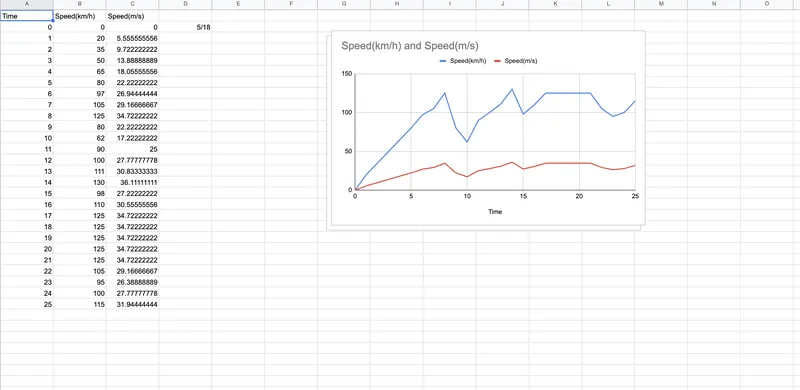
After Preparing Drivecycle data, Import the Drivecycle data in MATLAB file by using 'Import Data' option in MATLAB
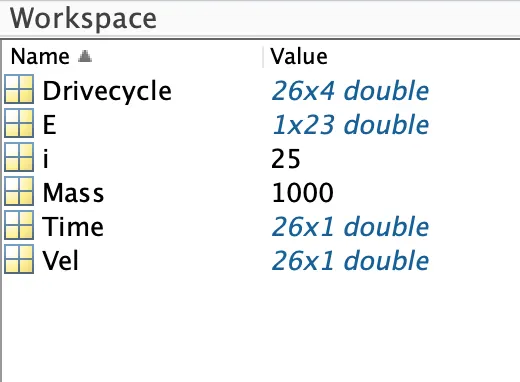
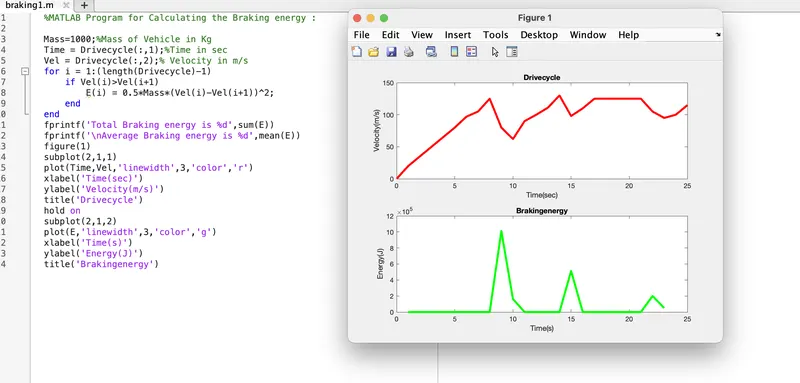
After Importing the Drive Cycle Data, Create a Program to Calculate the energy required for Braking for the above Imported Drivecycle.
MATLAB Program for Calculating the Braking energy :

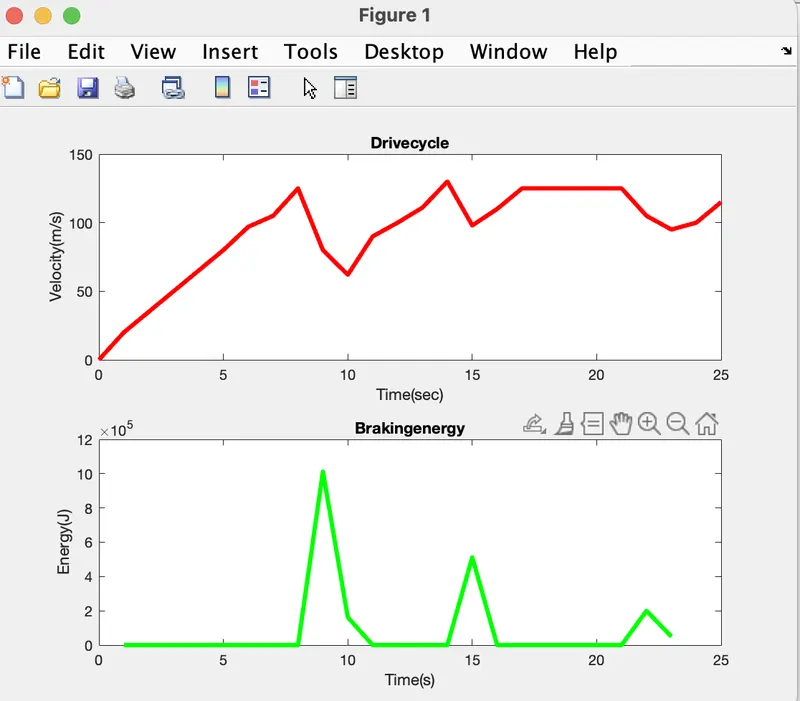
- Plot window refers Drivecycle and energy required for Braking for given Drive Cycle
- workshop shows that assinged and calculated values stored in Workspace
command window shows that the Total Braking energy(J) and Average Braking energy(J) required for Braking for a given Drive Cycle.
Explanation for above Program :
- Assume Mass of the Vehicle is 1000 Kg, and assume Time and Velocity value from the Imported drive cycle data
-
For Deceleration Initial Velocity[Vel(i)] is greater than Final Velocity[Vel(i+1)], for that using 'if condition' to check [Vel(i)]>[Vel(i+1)] and the condition satisfies which calculate the Braking enrgy. Braking Energy Formula is
E=m⋅(vi-vf)22">E=m⋅(vi−vf) ^2/2
where,
m- Mass of the Vehicle(kg),
vi">vi- Initial Velocity(m/s),
vf">vf - Final Velocity(m/s),
-
Calculate the Braking Energy for the length of Drive cycle using 'for loop' condition. E - Braking Energy (J)
-
After Calculating all Braking Energy for given Drive cycle, find Total Braking energy using 'sum(E)' command and Average Braking energy by using 'mean(E)' command.
- Plot the results using 'plot' command and use 'xlabel','ylabel','title command for proper identification in the Plot window.
-
Using 'subplot' command to display two plot results in a single window.
- Finally Click the 'Run' button to get the Output results.
results:
--------------------------------------------------------------------------------------------------------------------
2:Why electric motor can’t develop braking torque at high speed similar to starting? How electric and mechanical brakes are coordinated?
Regenerative Braking: It is a form of braking in which the kinetic energy of the motor is returned to the power supply system.
Regenerative braking turns kinetic energy into electricity by reversing the process that drives the car forward. In electric cars, the drivetrain is powered by a battery pack that powers a motor (or motors), creating torque–rotational force–on the wheels. In other words, electrical energy from the battery becomes mechanical energy that spins the wheels.Regenerative braking takes place whenever the speed of the motor exceeds the synchronous speed. This baking method is called regenerative baking because here the motor works as generator and supply itself is given power from the load, i.e. motors. The main criteria for regenerative braking is that the rotor has to rotate at a speed higher than synchronous speed, only then the motor will act as a generator and the direction of current flow through the circuit and direction of the torque reverses and braking takes place.
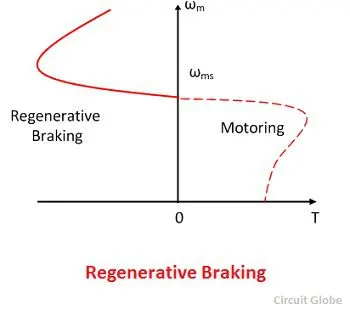
Fig : Speed-Torque Characteristics of Regenerative Braking
With regenerative braking, the energy from your spinning wheels is used to reverse the direction of electricity - from the electric motor(s) to the battery. All you have to do is remove your foot from the accelerator or, in some cases, press the brake pedal to activate regenerative braking. The electric motor not only acts as an electric generator, but it also helps slow your car down because energy is consumed by the wheels as they rotate the shaft in the electric motor.
Sometimes after accelerating you can't reach the maximum torque. The reason is that no matter how much the current loop wants to increase current (proportional to torque) by increasing the PWM duty cycle of the power stage, the Vmotor is too close to Vbemf and therefore current can't increase more.This situation does not occur at the beginning of an acceleration because most of the torque is used to increase the kinetical energy of the load (and motor). But when the speed is already high and no extra load is applied it is not possible to increase the torque.
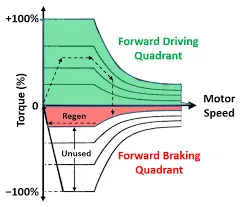
Here it is clearly shown in the first graph that till the motor reaches the critical speed it has constant torque and once it reaches the critical speed, the curve is having a down slope which is a constant power region. And this graph denotes the accelerating operation of the motor. For the deceleration or braking operation of the motor, this graph is mirrored down which will be having the speed (+ve) and torque (-ve).
Peak Acceleration Torque and Peak Deceleration torque are not equal for Electric Vehicle Motor. So the Peak Torque during acceleration and the Peak torque during deceleration or braking are not equal. Acceleration is usually higher, at low speed we get higher Torque but high speed the value of the torque gets lower. So we cannot say that the motor which is producing 7Nm Torque for Acceleration can also produce -7Nm of Braking Torque. So beacuse we Operating the Motor in Field Weakening region or we are operating the Motor above base speed we must know that the torque is compromised or the torque value is lower.
Electric motor can’t develop braking torque at high speed similar to starting, because Braking torque is applied in the opposite direction of the rotation. We can use a mechanical brake to produce a braking torque. We can also do it electrically.
So Electric motor can’t develop braking torque at high speed similar to starting, because Braking Torque of an EV Motor is not as high as the Acceleration Torque. Therefore Regenerative braking is cannot happen so effectively that we can get all the power back to the battery.
Coordination of Electric and Mechanical Brake :
in a electric Motor the Total Brake distribution is in two aspects which are Electrical Brake which is called Regenerative Brake and Mechanical Brake or Classical Brake with hydraulic cylindrical system. Brake Force distribution must be uniform, If the Regenerative braking power requirement is more than the charging limit of the battery or more than regenerative capacity of the machine we must apply Mechanical brakes as well. In practical case the combination of these two is applied. So usually it is combined response of Mechanical brake and Regenerative brake. The reason for how these brake force are combined, that particular phenomena is called Brake Control Strategies. There are two Brake Control Strategies, which are
---------------------------------------------------------------------------------------------------------------------------
3:Make a MATLAB program which plots contour of given motor speed, torque and efficiency values. Attach the code as a .m file attach a screenshot of all the plots.
To plot contour line for a given Motor. A Motor have various types of losses happening inside. The various types of losses are
Copper Losses - I *2⋅R, where R is the Armature resistance and we say that Torque is proportional to Current, this copper loss can be consider askc⋅T*2.where kc is to take care of resistance of brushes and also take care of flux and its effect.
Copper losses = kc⋅T*2
Iron Losses - Iron Losses are nothing but Magnetic losses, which is denoted as ki⋅ω, where ki factor is based on the Magnetic field effect. For Permanent Magnets have constant Magnetic field and this Iron losses is based on the value of kii and this are going to change according to the Speed. At Various Speed have different value of Back EMF and that is going to affect the Iron Losses.
Iron Losses = ki⋅ω
Windage Losses - This is a Mechanical or friction of Windage losses. This is based on size of shape of Motor and the amount of windage losses that the motor is going to experience.
Windage Losses = kw⋅ω*3
Constant Losses - This is denoted as C.
Total Losses - The Total Losses are considering the above four losses and denoted as,
Total Losses = kc⋅T2kc⋅T2 + ki⋅ωki⋅ω+ kw⋅ω3kw⋅ω3 + C
All Motors are model as per the above equation of losses. This above equation is not only applicable for Permanent Magnet DC Motor, but other motors as well like induction motor.
Contour : contour(Z) creates a contour plot containing the isolines of matrix Z, where Z contains height values on the x-y plane. MATLAB automatically selects the contour lines to display. The column and row indices of Z are the x and y coordinates in the plane, respectively.
'contour(X,Y,Z)' specifies the x and y coordinates for the values in Z.
MATLAB Program to Plot Motor Speed-Torque Contour Efficiency :
Results:
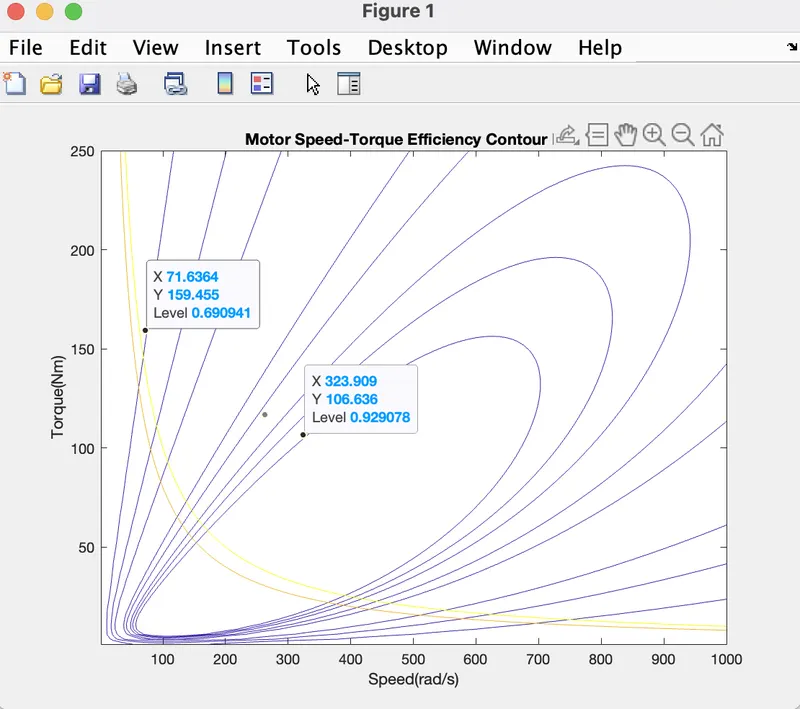
The above Plot shows the Motor Speed-Torque Efficiency Contour Plot. A Point is denoted in innermost contour line is group of efficiencies which is highest value of the efficiency as 93%, because where the height is maximum and another point is denoted outermost contour line is contain group of efficiencies which is the lowest value of efficiency as 70%, because where the height reduces. Increasing efficiency order as going inward and Decreasing efficiency order as going outward. The yellow line shows the 8kw and 10kw Power.
Explanation for above Program :
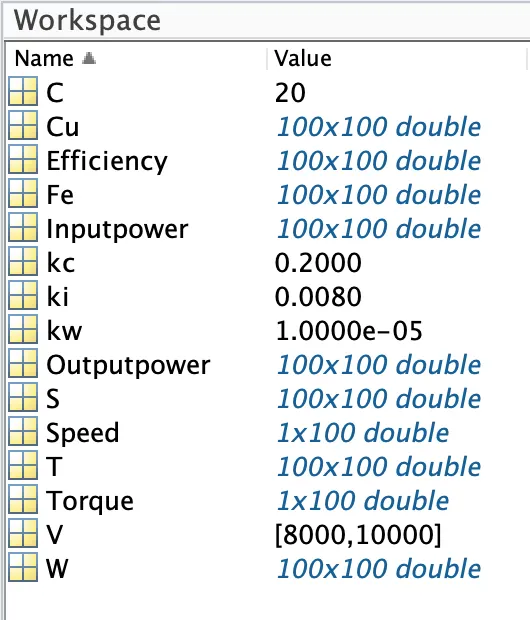
- Assign Input of Speed and Torque in an array using 'linspace' Command and allocate Constant Values for four losses(Copper Loss, Iron Loss, Windage Loss and Constant Motor Loss)
- Mesh the Speed and Torque values using 'meshgrid' command.
- Calculate the Output Power by multiplying Speed and Torque values
- Calculate Copper Loss, Iron Loss, Windage Loss using those formulas.
- Calculating Inputpower by adding Output Power and Four Losses(Copper Loss, Iron Loss, Windage Loss and Constant Motor Loss).
-
The ratio of Output Power and Input Power we can get the Efficiency.
- Now Set the Efficiencies for which a contour will be plotted. The range of contour efficiency is to plot from 70% to 93% efficiency. V is the Mapping of those efficiency points.
- Plot the Contour Efficiency using 'contour' command and plot Speed,Torque,Efficiency and V.
- Now plot a contour of Power Output. Plotting contour of 8kw and 10kw of a Motor.
- Run the Program and get the Motor Speed-Torque Efficiency Contour Plot.